The main tag of cryptocurrency price today Articles.
You can use the search box below to find what you need.
[wd_asp id=1]
The main tag of cryptocurrency price today Articles.
You can use the search box below to find what you need.
[wd_asp id=1]
September is historically a bad month for Bitcoin and altcoins alike, and current indicators show the market may be overbought, suggesting more price drops. XRP’s price movements have been closely mirroring Bitcoin’s. Historically, whenever Bitcoin shows lower highs after each correction, XRP tends to follow the same pattern. This means that as Bitcoin drops, XRP is expected to decline in value as well.
However, the recent news of Grayscale launching an XRP Trust has positively impacted XRP’s price. This trust is designed to give institutional investors exposure to XRP, indicating growing confidence in the asset’s long-term potential.
XRP is also one of the nine cryptocurrencies compliant with the ISO 20022 standard, which is crucial for integrating into traditional financial systems and could position it to be used in future CBDCs.
XRP Price Analysis:
Triangle Pattern and Waves: The price movement since the swing low on July 4th, around $0.38, saw a three-wave rally, labeled as wave A. Analysts are anticipating a continuation to the upside, although confidence in this outcome isn’t high. The current sideways movement is seen as a B-wave, which is expected to lead into a C-wave. This entire structure can be identified as a triangle with waves A, B, C, and D already completed, and a final E-wave potentially forming a higher low.
Key Levels and Invalidation Points: Both scenarios share the same invalidation point at $0.50. A break below this level would invalidate the microstructures of either pattern. The next crucial resistance is at $0.642 to $0.643, which is the swing high from August 7th.
A sustained break above this level could signal the start of a third wave to the upside, possibly reaching $0.86, the ideal target for a third wave based on Fibonacci extensions. However, if the price breaks above the previous B-wave high but does not hold above it, it could still be part of the triangle structure, forming a barrier triangle, though this is less common.
XRP performed well this week and closed with a 11% price increase.
Key Support levels: $0.54
Key Resistance levels: $0.68
After firmly securing the 54 cents level as support, XRP rushed higher and almost reached 60 cents before a pull back followed. Buy momentum remains strong and could see the price move higher in the coming week.
In the past week, buy volume exceeded any sell pressure in five out of seven days. This translated in a higher price and increased demand for this cryptocurrency. The current resistance around 60 cents will not be able to stop this buy pressure if it continues.

XRP also made a bullish cross on Friday which turned the momentum around. Buyers are controlling the price action right now and this pull back could be short lived. If the 60 cents resistance falls, look for 68 cents as the next target for this rally.

LIMITED OFFER 2024 at BYDFi Exchange: Up to $2,888 welcome reward, use this link to register and open a 100 USDT-M position for free!
Ripple [XRP] posted 11% gain last week, partly boosted by Grayscale’s inclusion of an XRP Trust to its line of crypto products.
However, the altcoin was on the verge of hitting a Q3 supply zone near $0.06. This zone has attracted intense profit-taking in the past, especially from whales. Will the trend repeat according to XRP price prediction?

Source: XRP/USDT, TradingView
XRP has printed a clear price trend in Q3. Notably, the strong recovery in July and the partial victory against SEC in August ended near the supply zone at $0.6. This has made $0.6 a key price level to watch, especially during price appreciation.
At press time, this week’s upswing was headed into the supply zone. If the trend repeats and another price rejection occurs, XRP could drag to $0.54 support.
In such a scenario, shorting the asset would yield gains, especially if the overall market cools off ahead of the FOMC meeting.
However, given the bullish expectations from Fed rate cuts, market re-entry would make sense only if XRP flips the supply zone into support.
Meanwhile, the RSI showed more room for the current uptrend, while the stochastic RSI flashed overbought conditions. This further signaled the supply zone should be pinned as a crucial watchlist.
Source: CryptoQuant
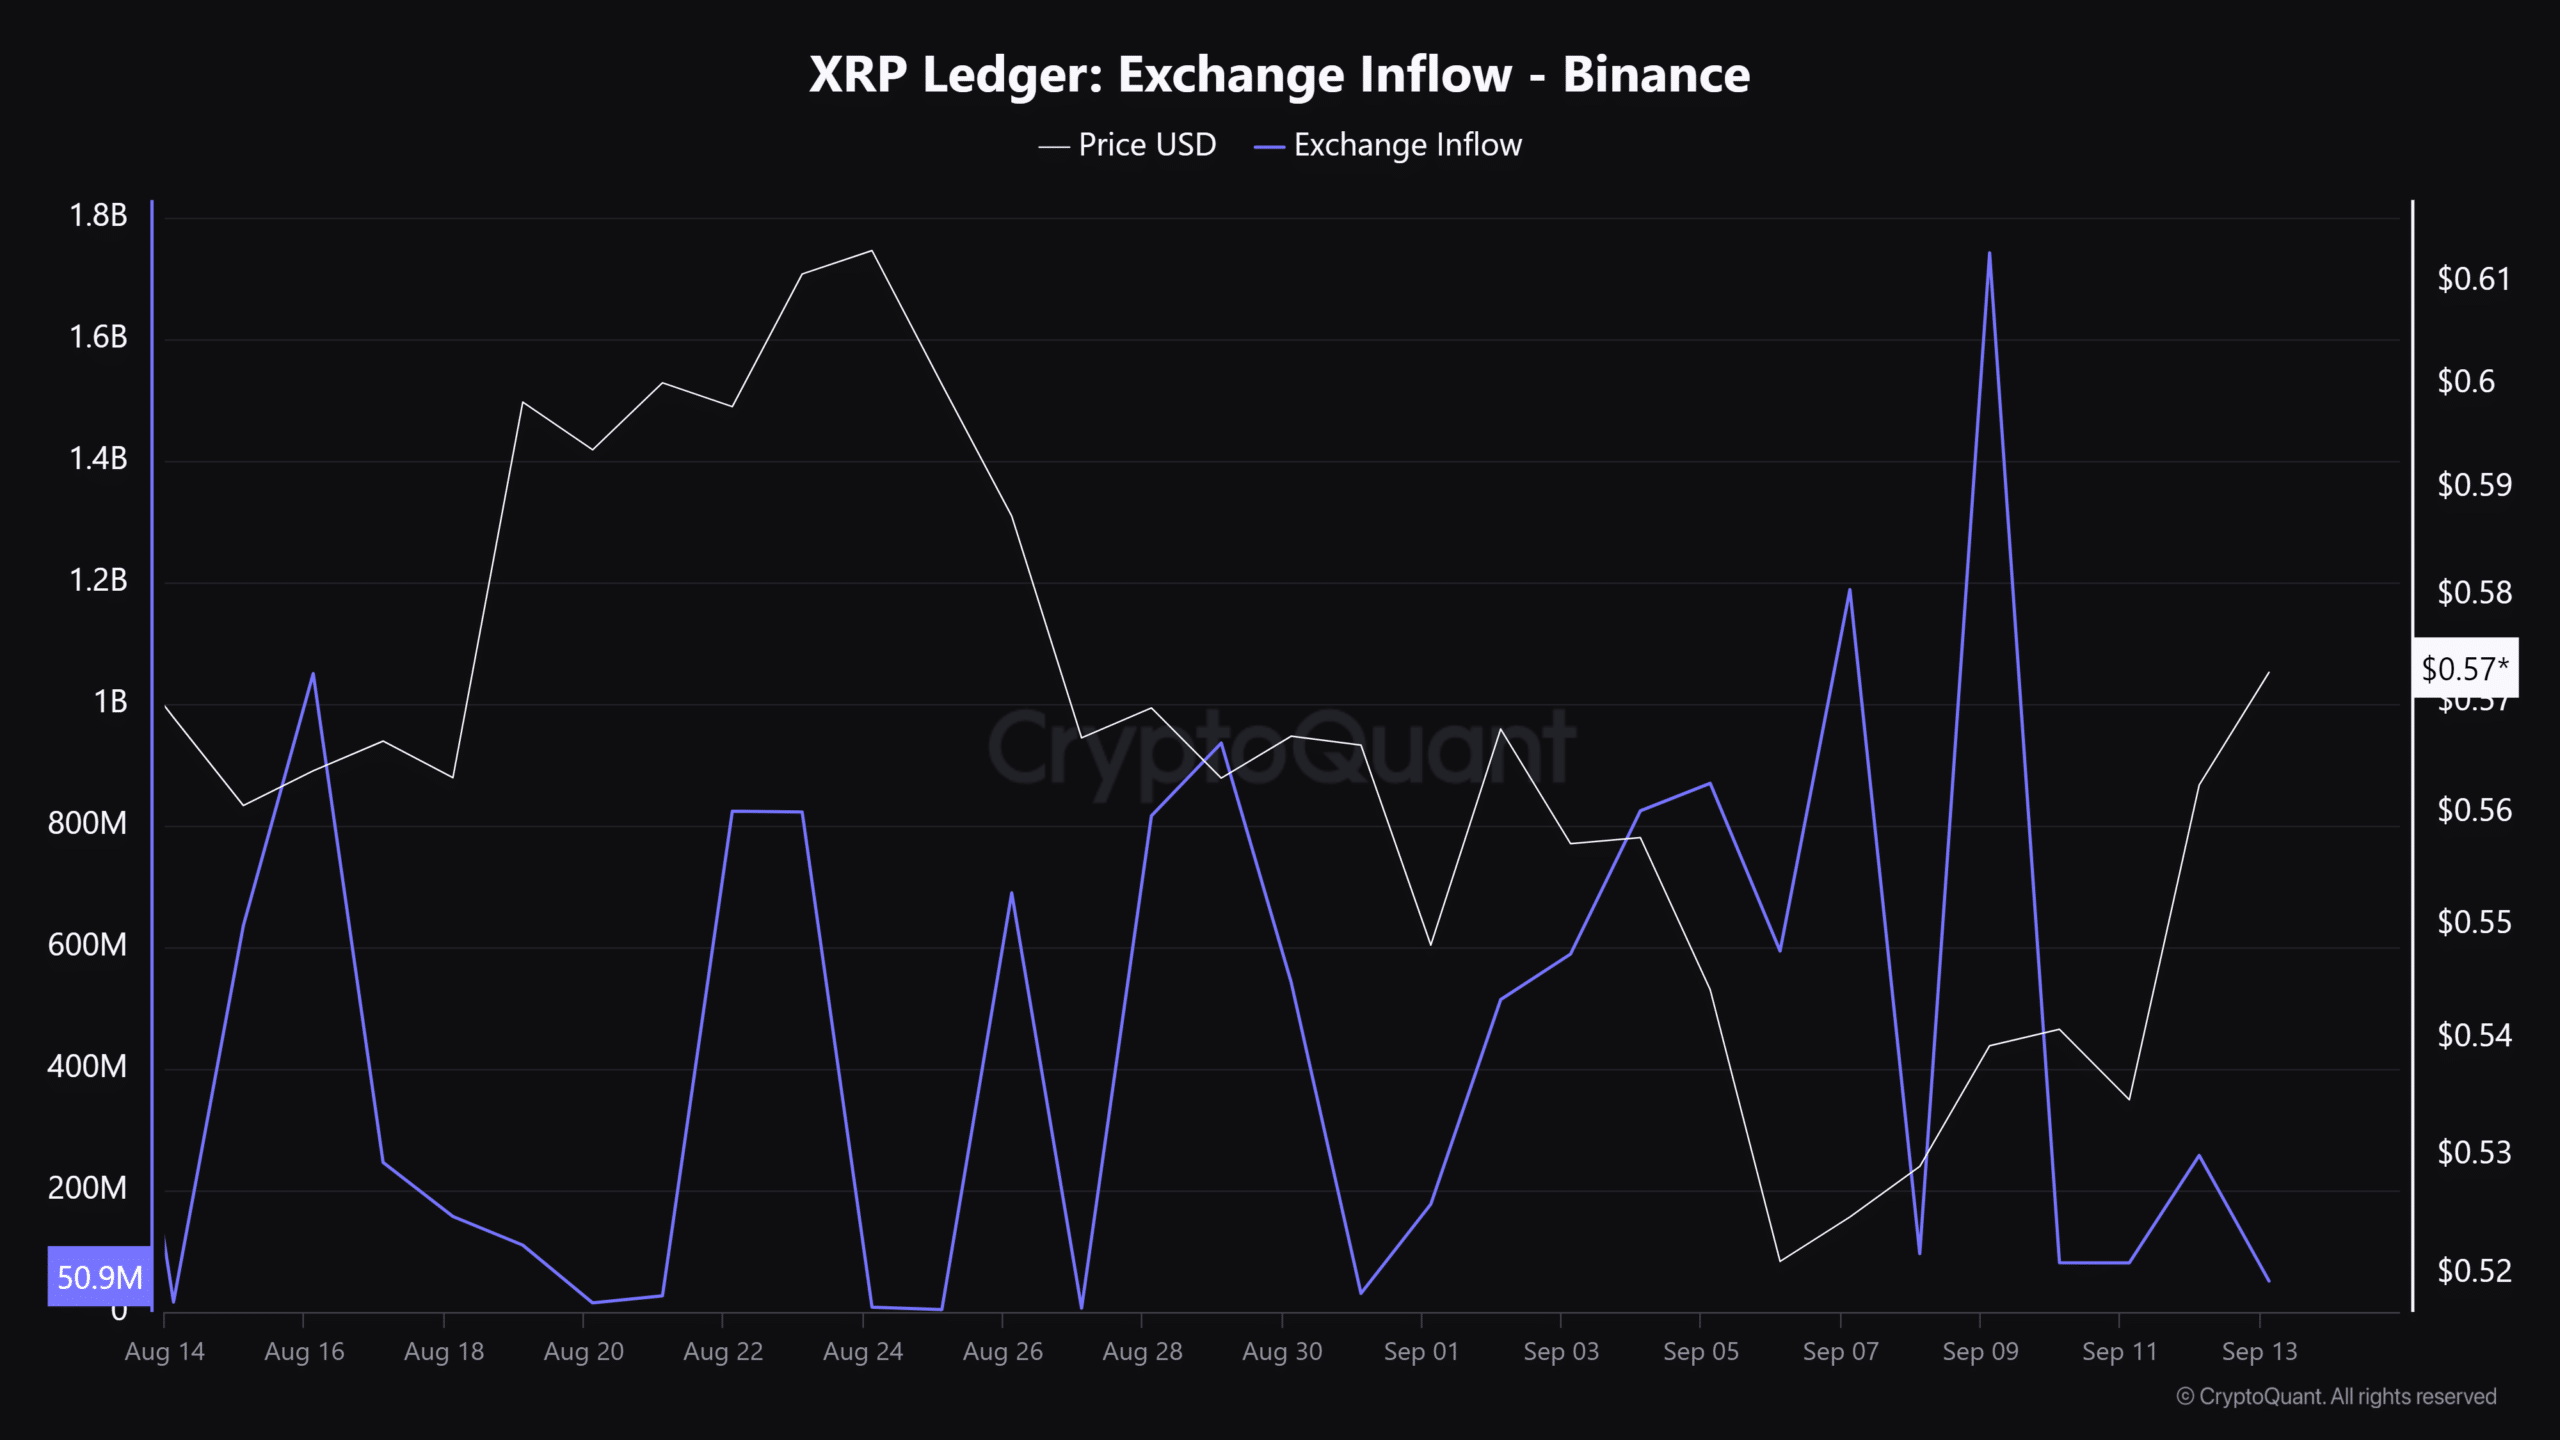
This week’s XRP rebound was also marked by reduced sell pressure on centralized exchanges, as shown by a sharp drop in exchange inflows.
On Binance, XRP’s inflow dropped from nearly 1.8 billion tokens on 8th September to around 50.9 million at the time of writing. This reduced supply pressure aided this week’s uptrend.
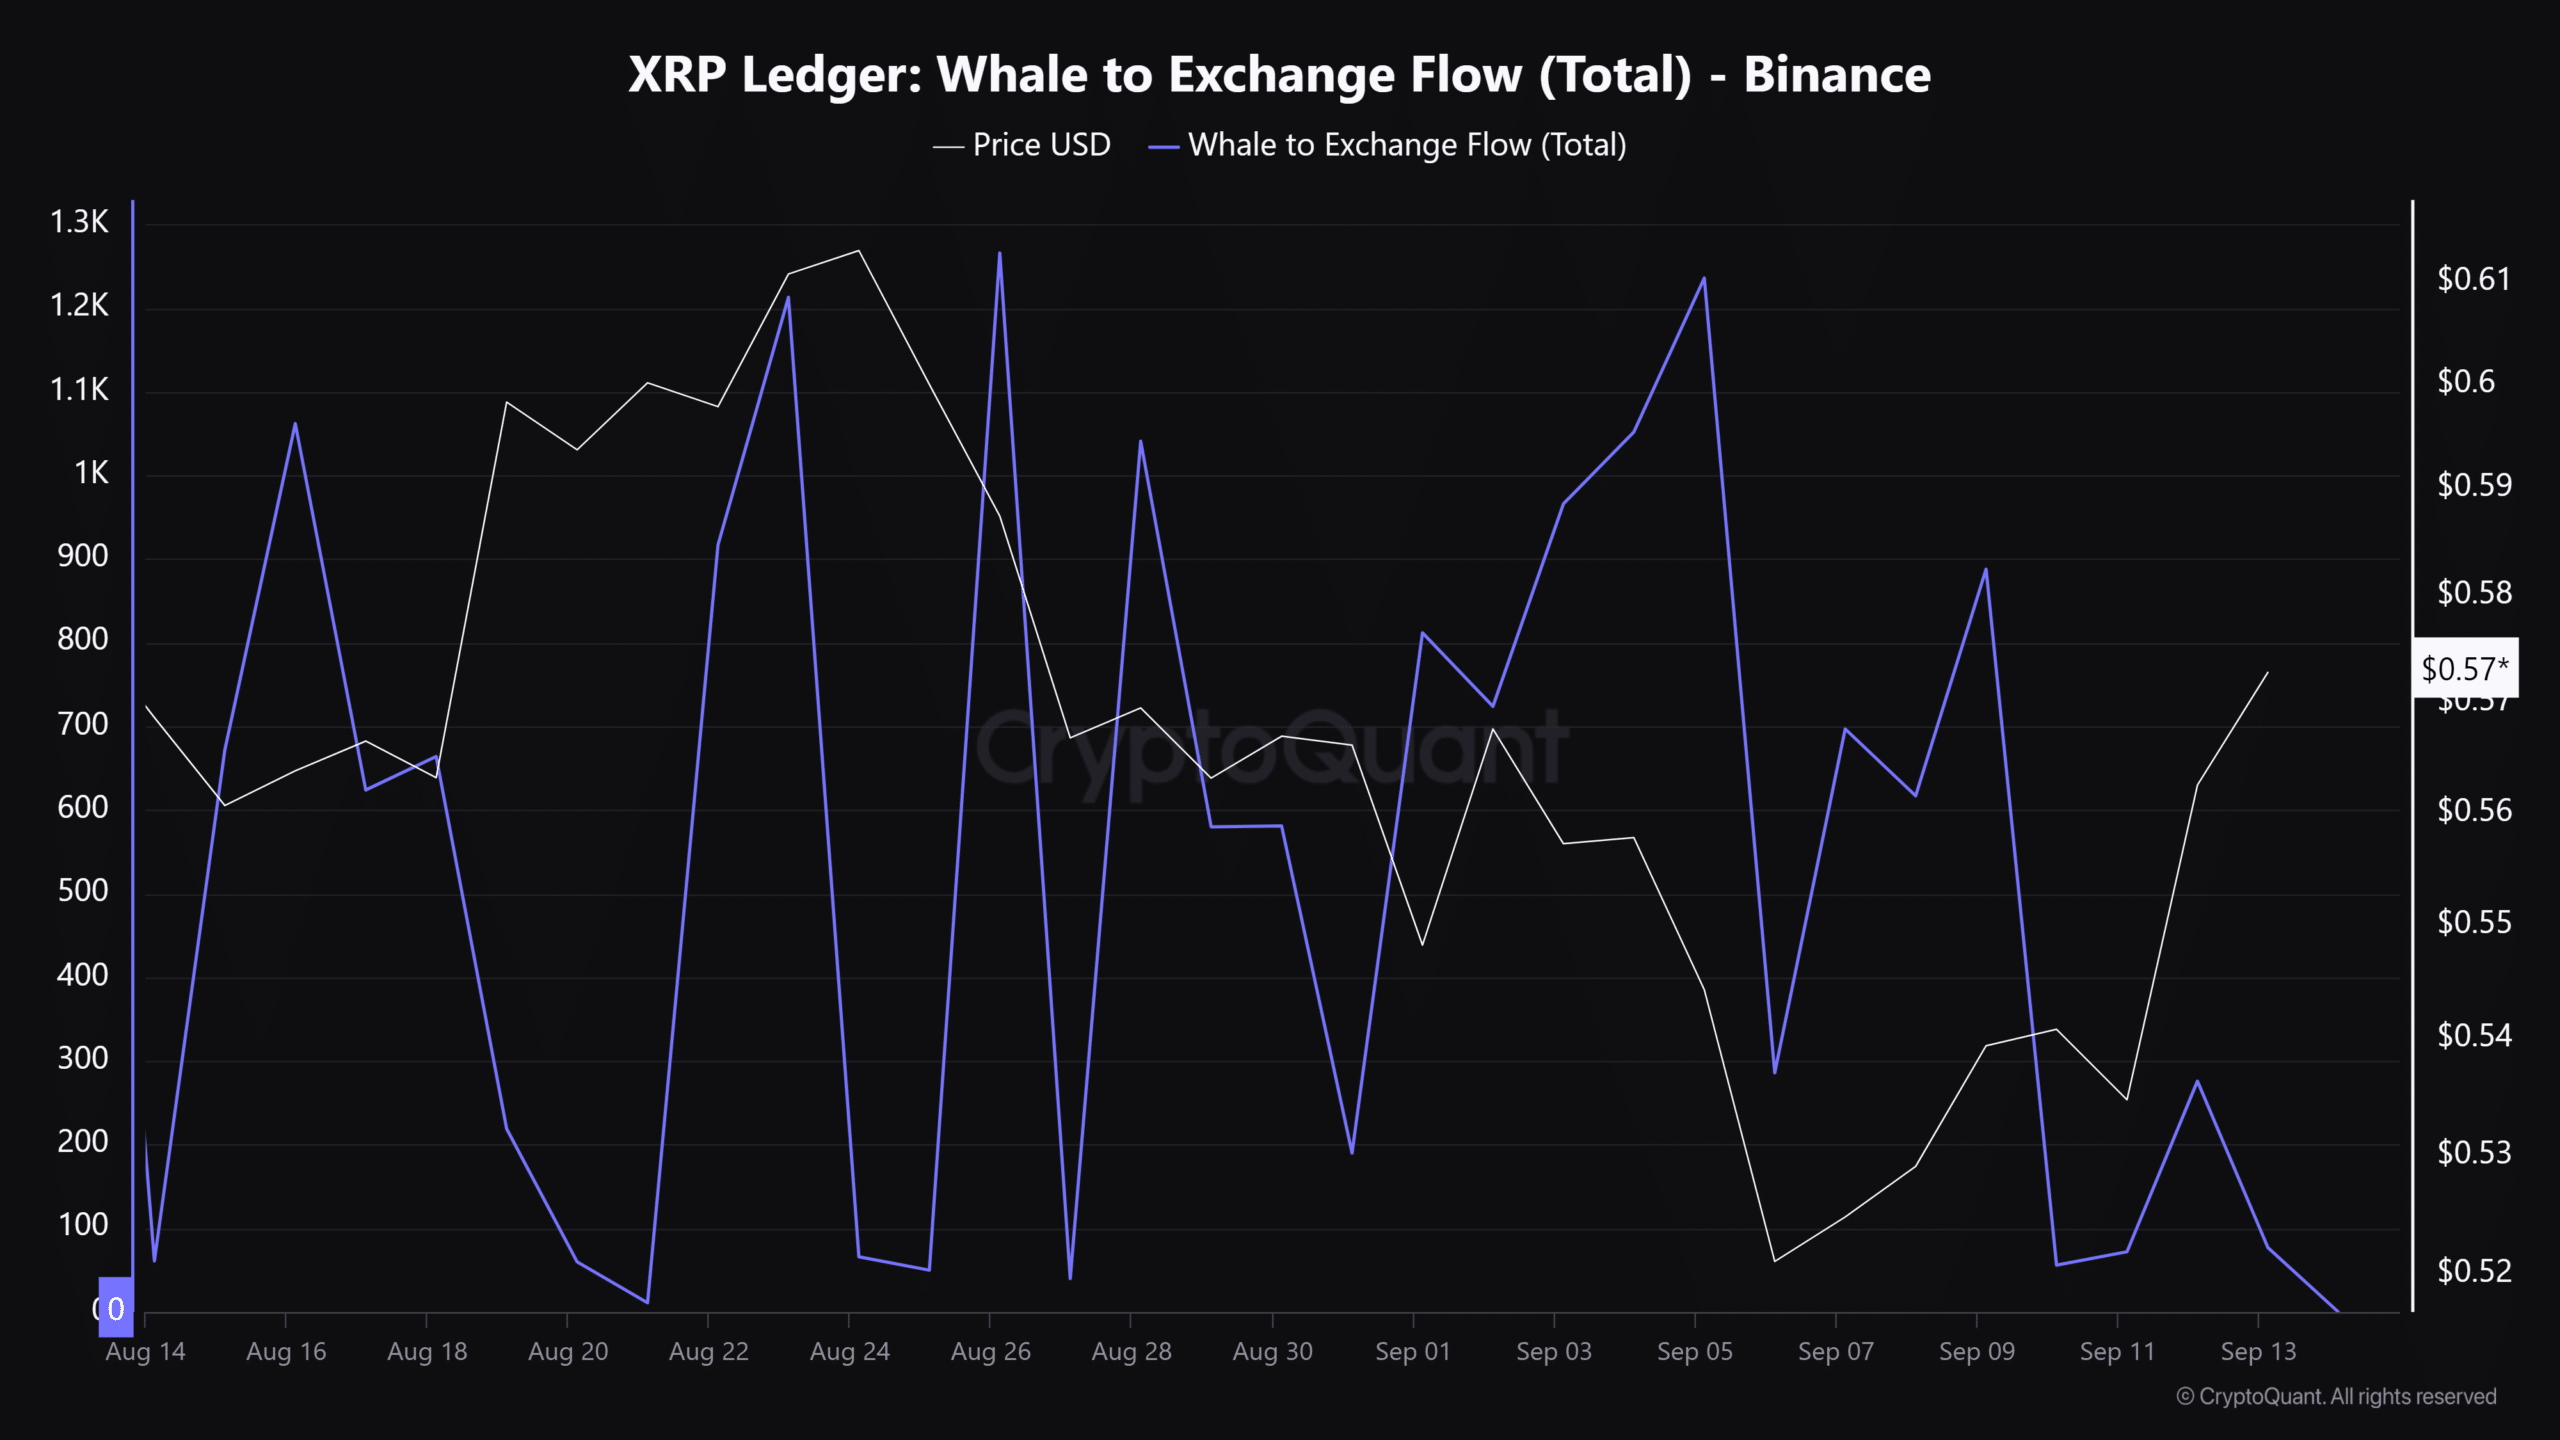
However, a price rally to $0.6 could attract a whale sell-off if the past month’s trend repeats. Whales triggered profit-taking in August when XRP hit the supply zone at $0.6, as illustrated by spikes in Whale-to-Exchange Flow.
Source: CryptoQuant
Read XRP’s Price Prediction 2024–2025
If the trend repeats, and whales opt for sell-offs again at the level, XRP’s move above the supply zone could be derailed. In such a case, speculators can seek another market re-entry at $0.54 or $0.50 support levels.
However, the bearish thesis could be invalidated if risk markets post a strong rally after the FOMC meeting.
As of September 15, 2024, the overall cryptocurrency market has been struggling to gain momentum including Bitcoin (BTC), Ethereum (ETH), and Solana (SOL). Amid this market downturn, Ripple’s native token XRP has outshined these major cryptos with a 4% price jump and is currently gaining significant attention from investors and traders.
It appears that XRP is poised for massive upside momentum, potentially due to several positive developments, including:
These recent positive developments have attracted investors and institutions, sparking optimism in the market.
At press time, XRP is trading near the $0.597 level and has experienced a price surge of over 4% in the last 24 hours. During the same period, its trading volume declined by 2%, indicating lower participation from traders and investors amid the current market sentiment.
According to expert technical analysis, XRP appears bullish as it is trading above the 200 Exponential Moving Average (EMA) on the daily time frame. The 200 EMA is a technical indicator used to determine whether an asset is in an uptrend or downtrend.
Given the current market sentiment, XRP is heading toward the $0.65 level, its upcoming resistance level. Based on the historical price momentum, if XRP closes a daily candle above the $0.65 level, there is a strong possibility it could reach the $0.75 level in the coming days.
This bullish outlook is further supported by the on-chain metrics. According to Coinglass data, XRP’s Long/Short ratio currently stands at 1.027, indicating bullish market sentiment. Additionally, 50.36% of top traders hold long positions, while 49.64% hold short positions, showing that bulls are dominating the asset.

Moreover, XRP’s future open interest has increased by 9% in the last 24 hours and continues to rise, signaling growing bullish bets on long positions.
Disclaimer: The opinions expressed by our writers are their own and do not represent the views of U.Today. The financial and market information provided on U.Today is intended for informational purposes only. U.Today is not liable for any financial losses incurred while trading cryptocurrencies. Conduct your own research by contacting financial experts before making any investment decisions. We believe that all content is accurate as of the date of publication, but certain offers mentioned may no longer be available.
Buyers are trying to hold the gained initiative at the beginning of the weekend, according to CoinStats.
The rate of Ethereum (ETH) has gone up by 2.20% over the past 24 hours.
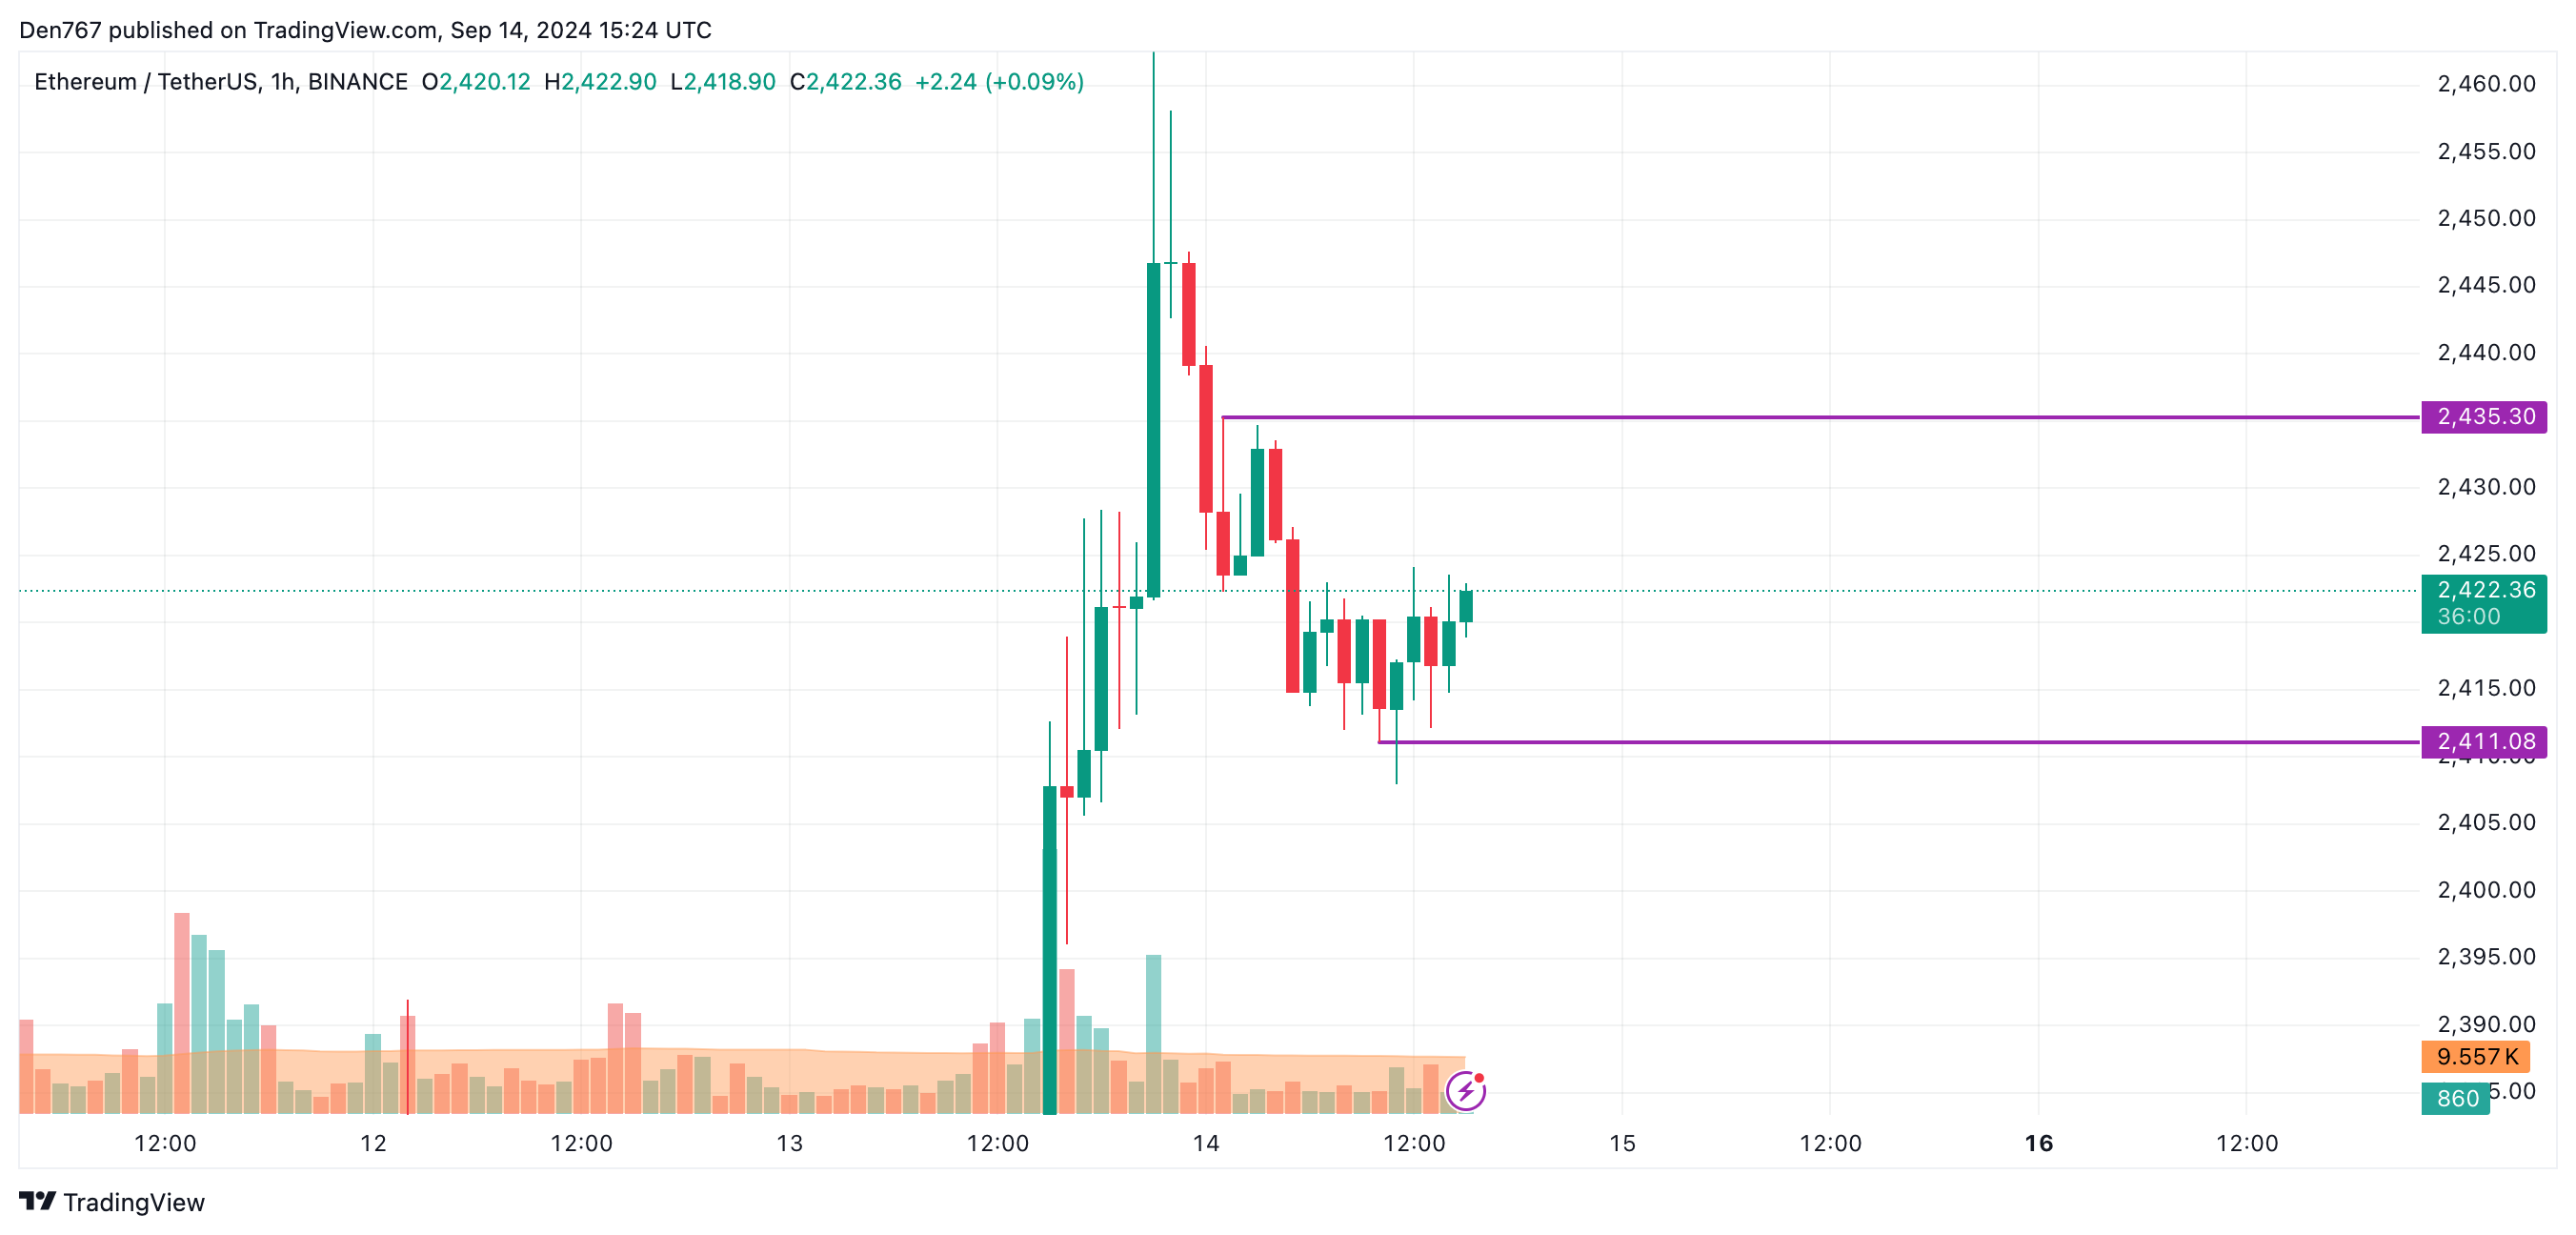
On the hourly chart, the price of ETH is rising after a false breakout of the local support level of $2,411. If the daily bar closes far from it, the growth may continue to the resistance by tomorrow.
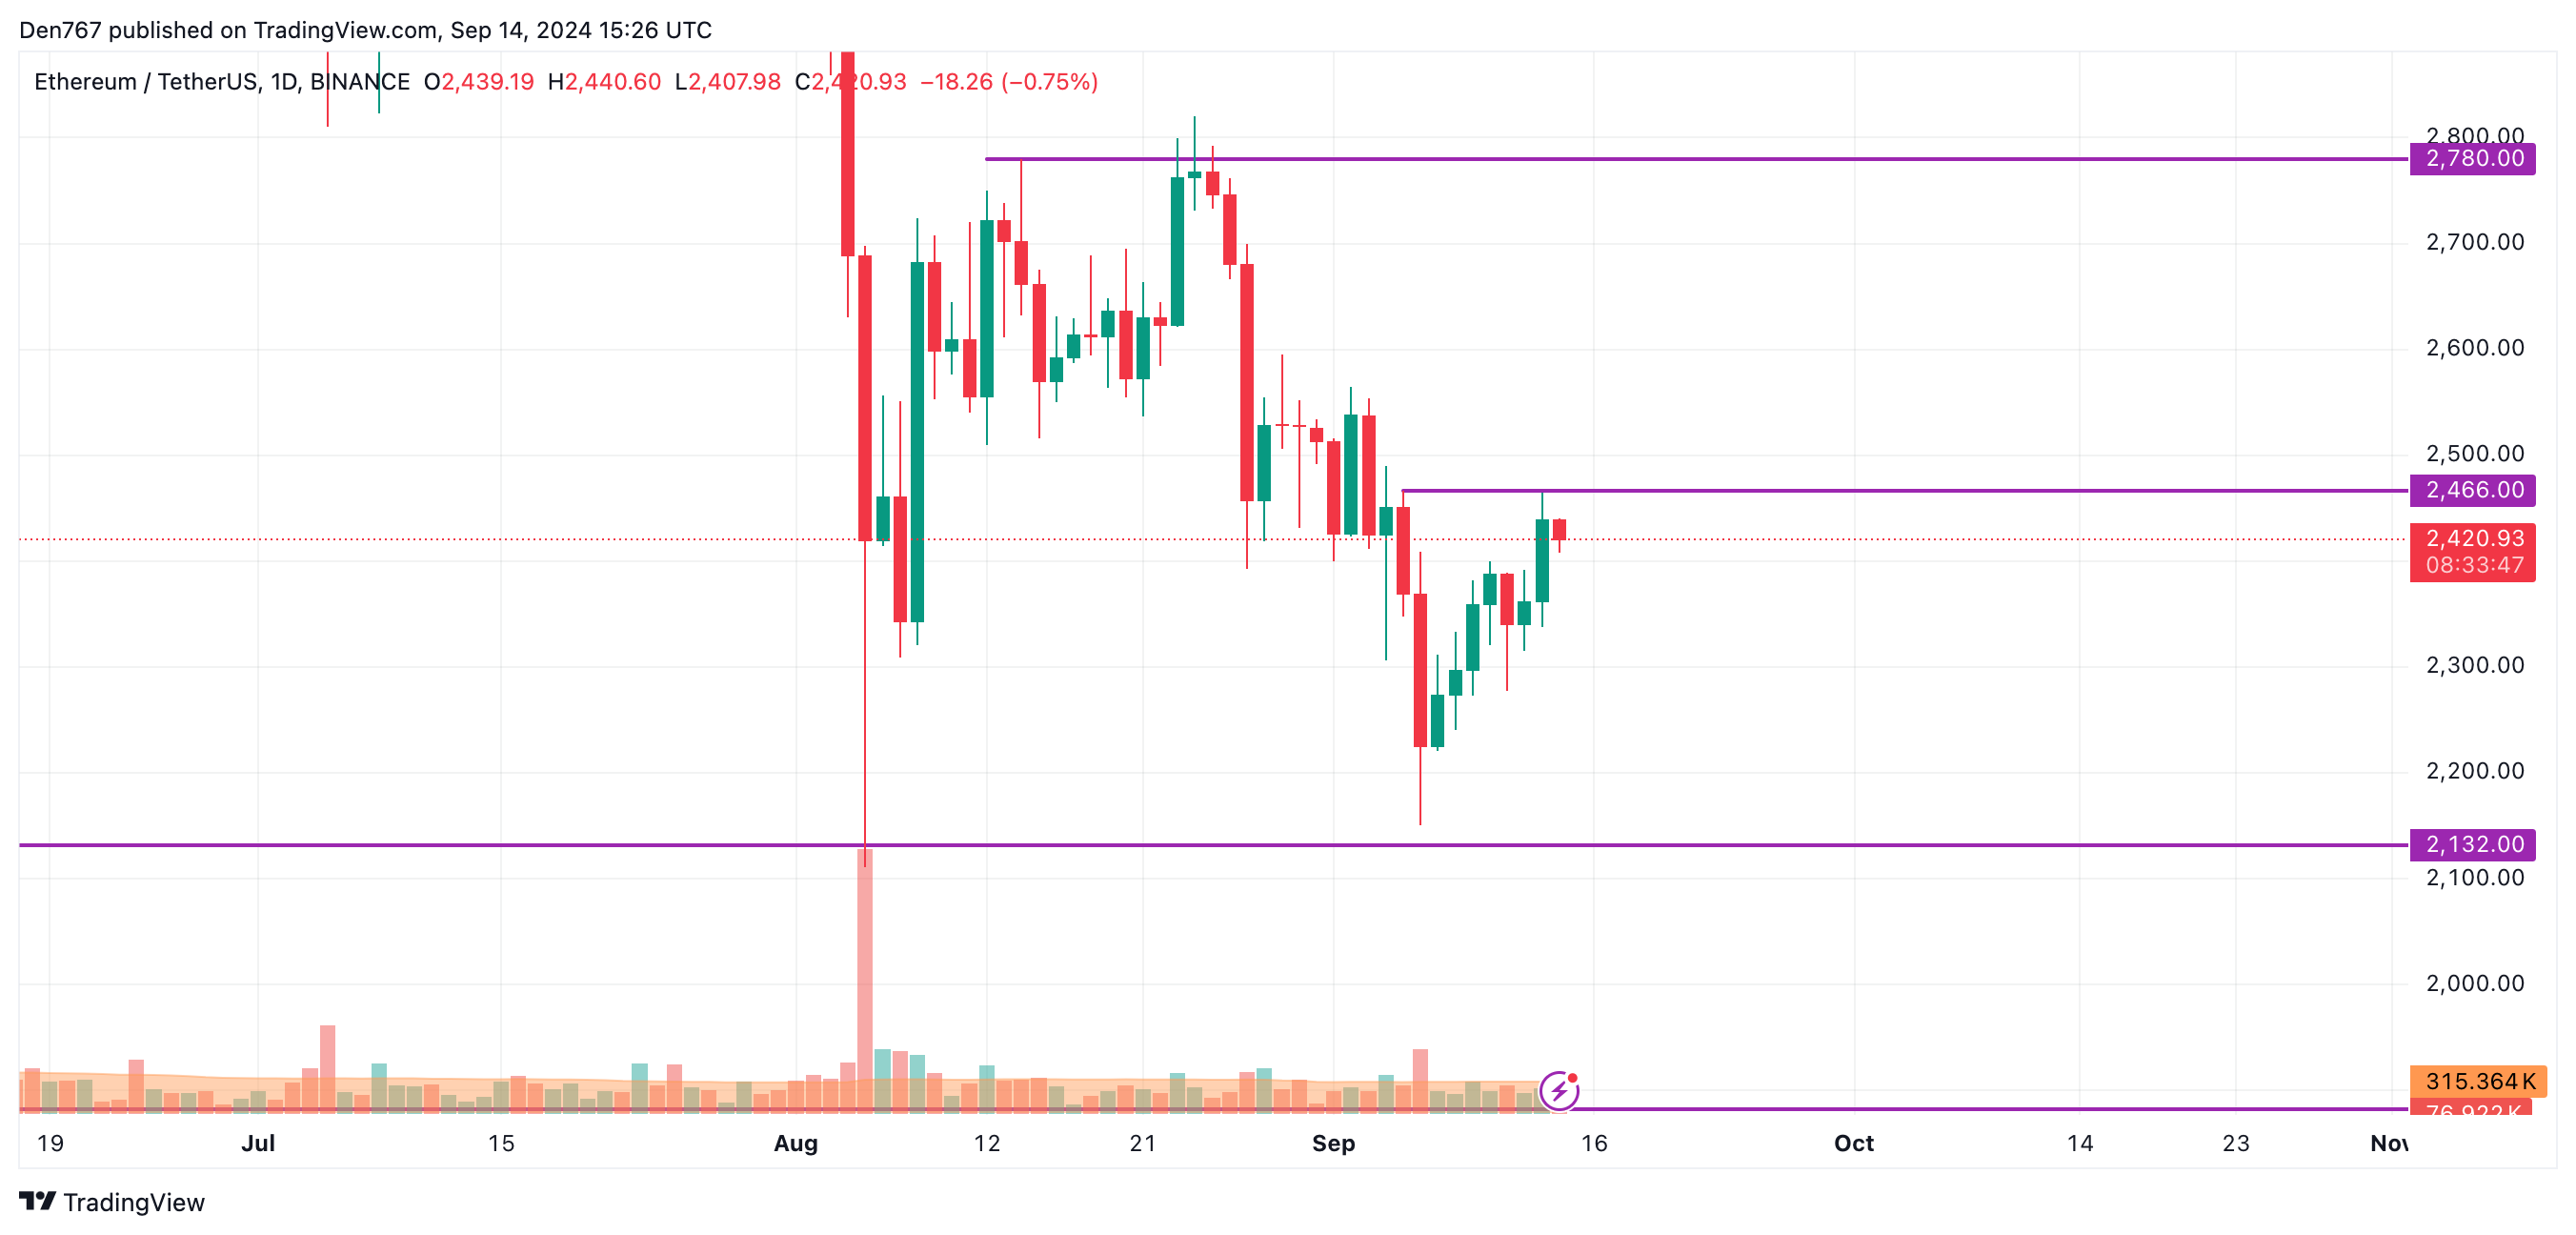
On the bigger time frame, traders should focus on the level of $2,466. If a breakout happens, the accumulated might be enough for a continued upward move to the $2,500-$2,600 range.
Related
Such a scenario is relevant until the end of the upcoming week.
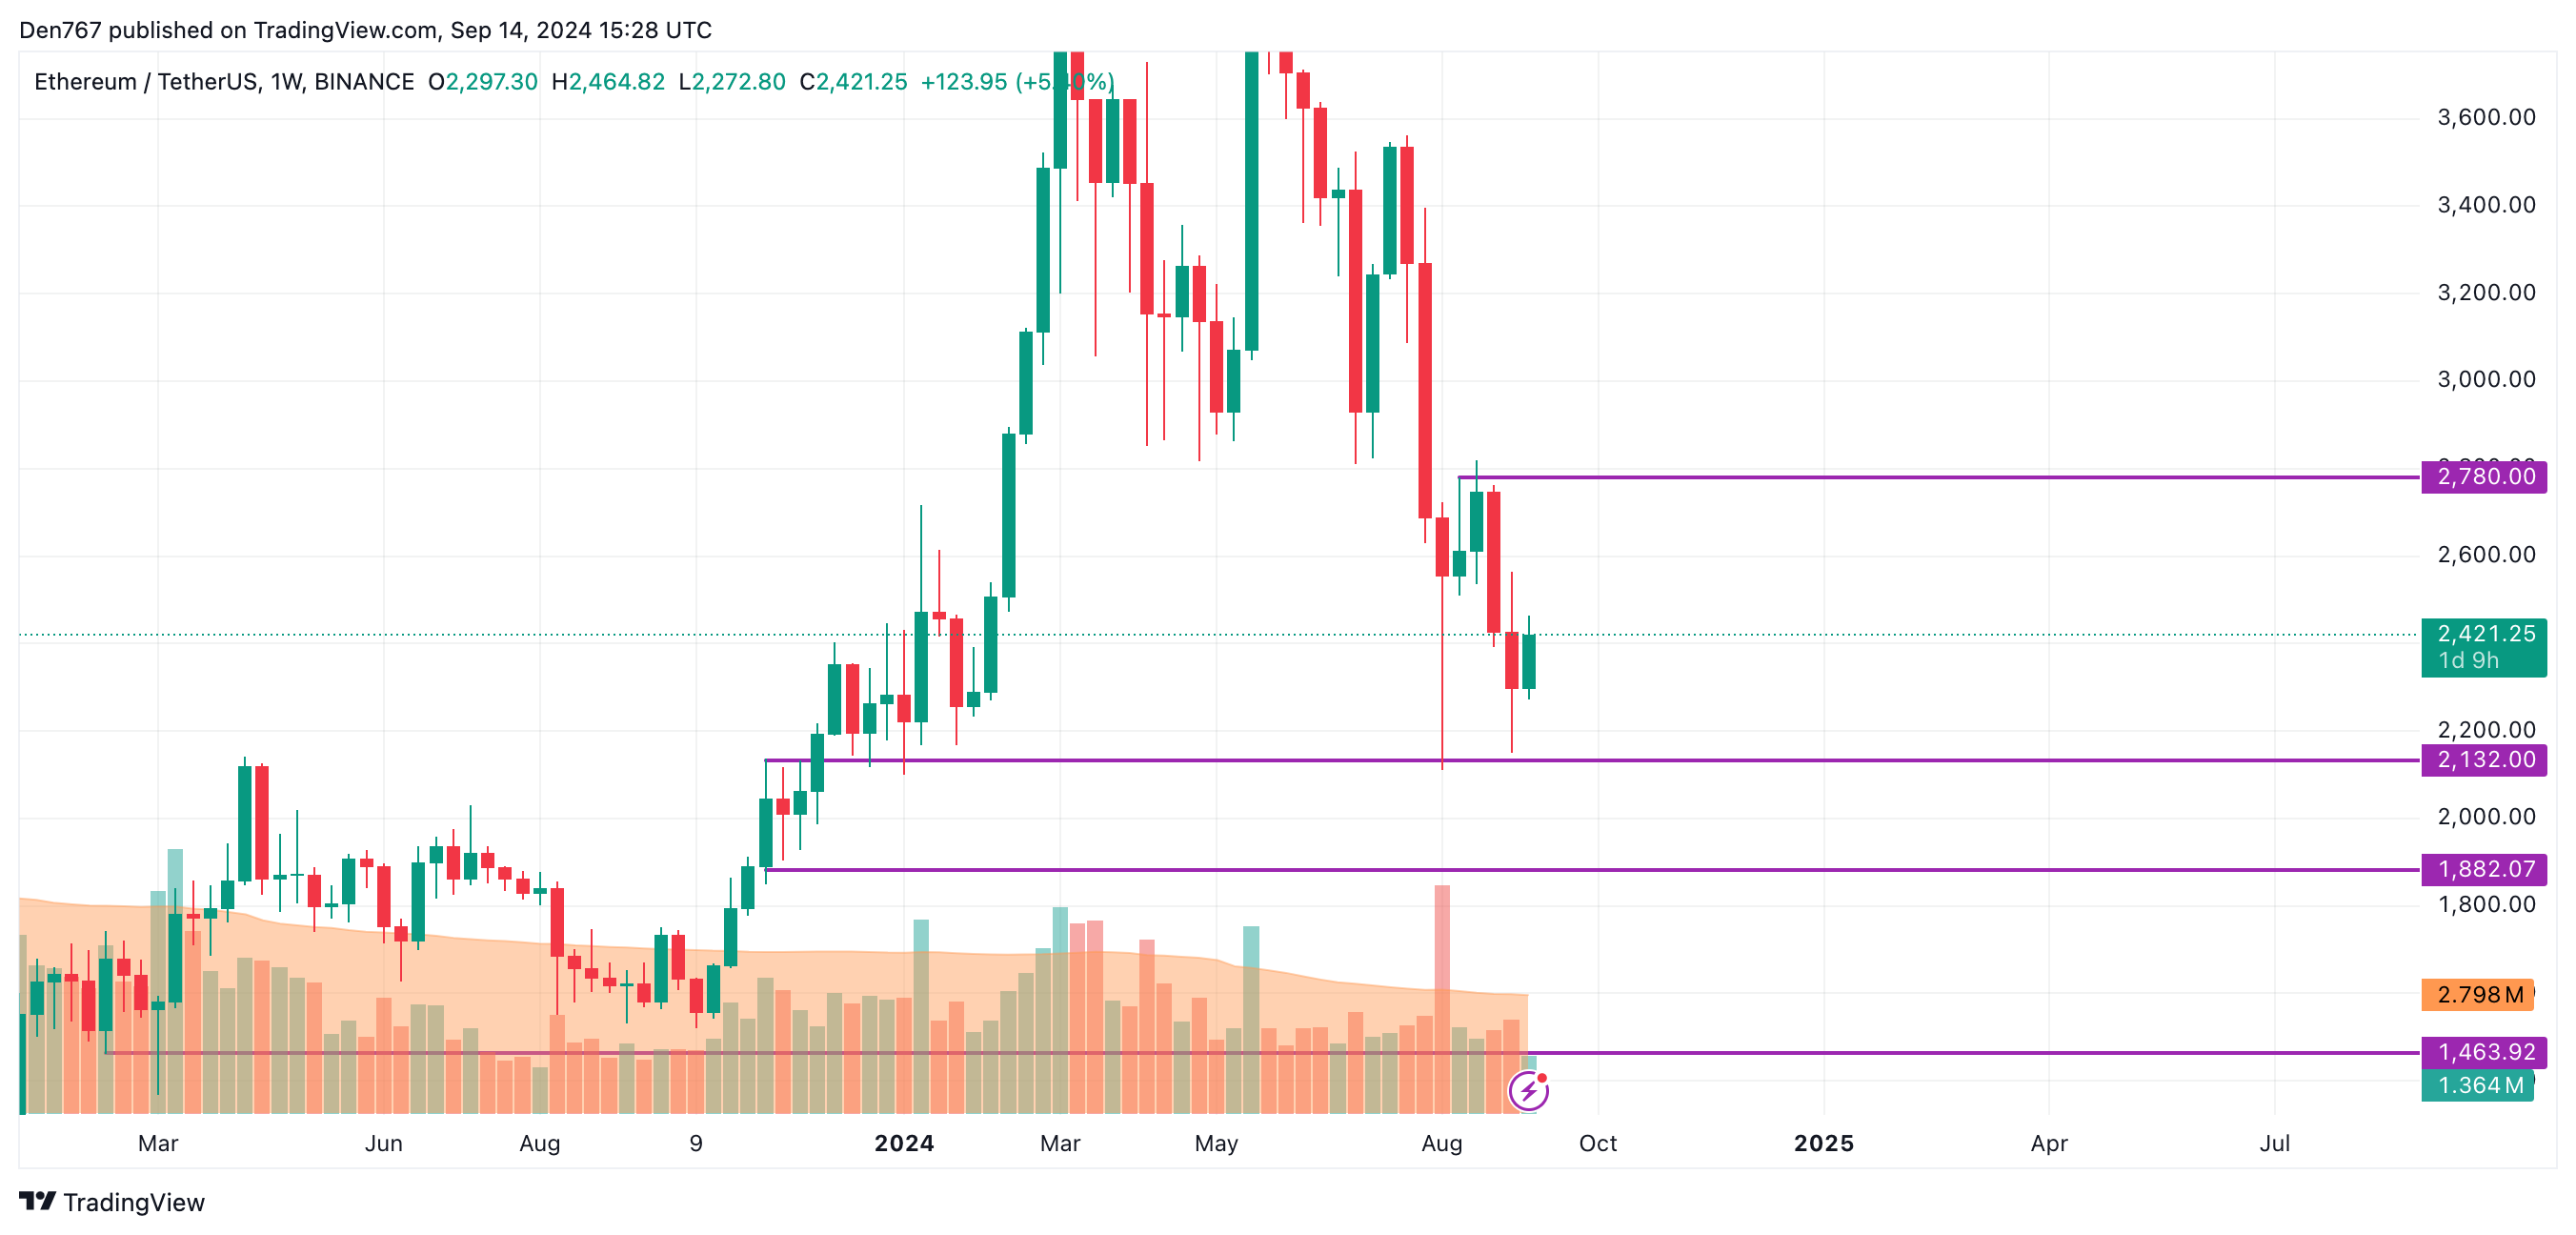
From the midterm point of view, buyers do not have enough strength to keep rising even if the weekly bar closes around the current prices. In this case, a consolidation in the zone of $2,300-$2,600 is the more likely scenario.
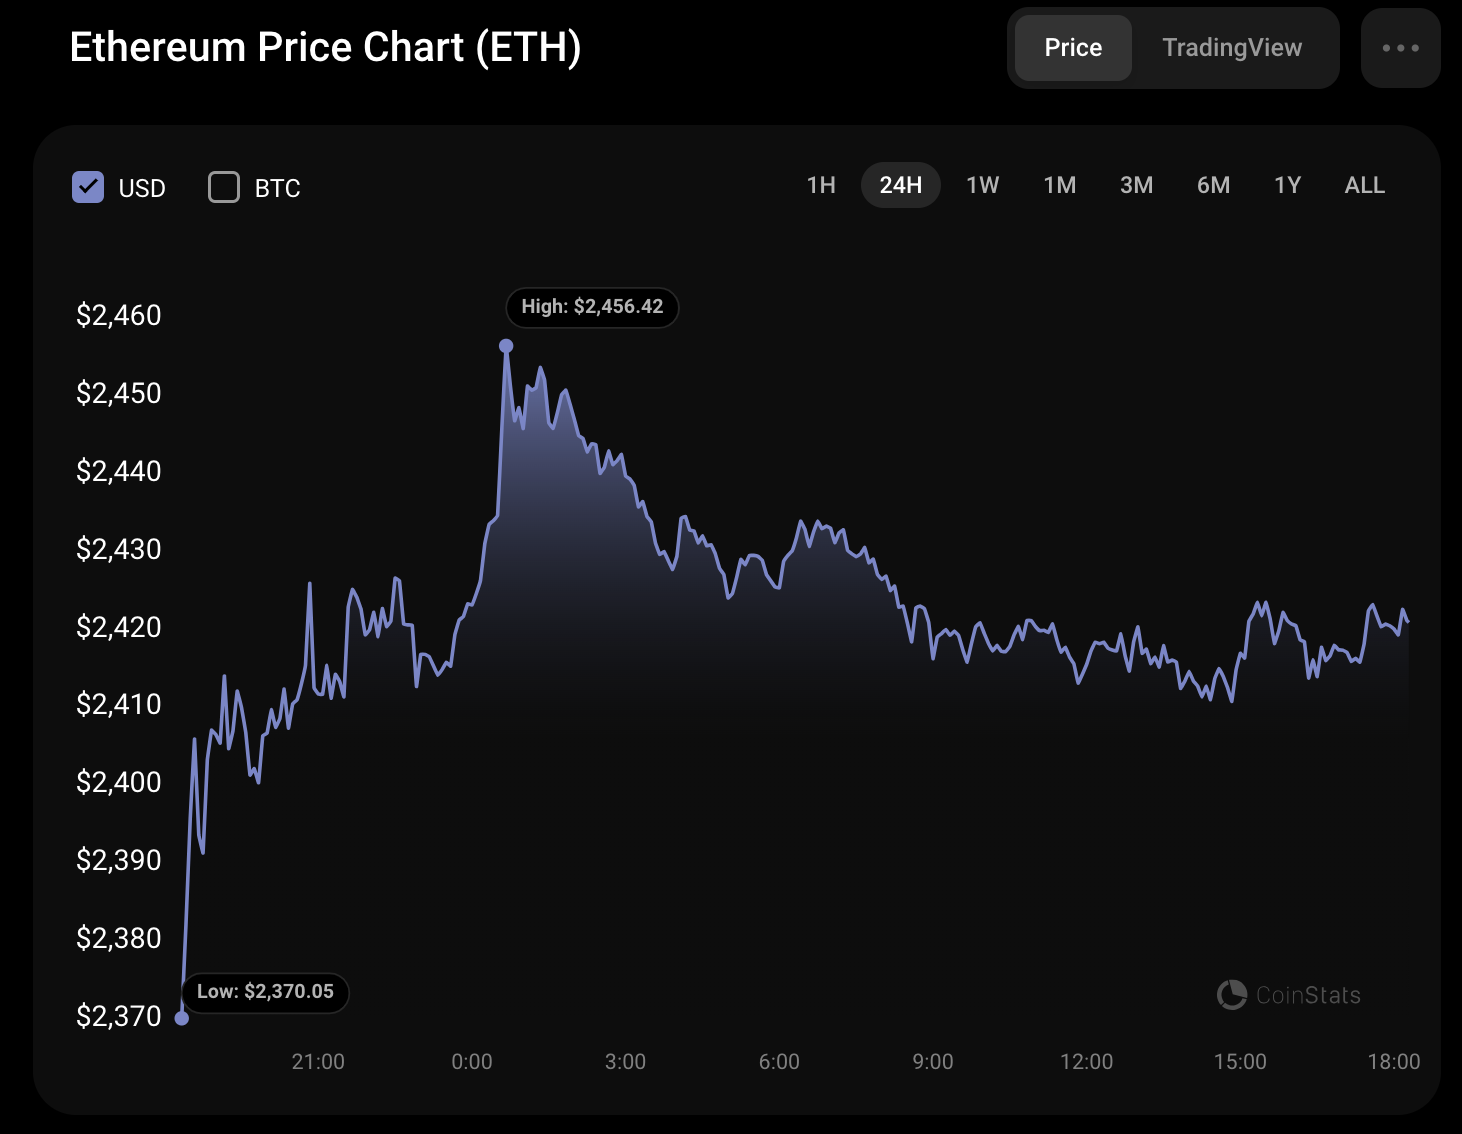
Ethereum is trading at $2,418 at press time.
Solana [SOL] made a bullish structure break on the daily chart. The resurgence of Bitcoin [BTC] over the past week gave Solana bulls hope, but the technical indicators were not on board with this idea.
In the first week of September, SOL dropped by 13.13% from its highest point of $138.13 to $120 on Friday, 6 September. Since then, it has bounced by close to 15%, recovering all the losses made over the previous week.

Source: SOL/USDT on TradingView
The range formation (purple) extended from $122 to $187, with the mid-range level at $154.33. The recent revisit to the range lows was the fourth occurrence since June.
The bullish market structure was accompanied by greater buying volume, as seen on the OBV which broke above the previous week’s highs. The RSI was also on the verge of moving above neutral 50. Together, there were encouraging signs that SOL may be poised for a sizeable rally.
The mid-range level at $154 is the next target, and even this could be ambitious since Bitcoin might falter around the $61k-$62k resistance zone. A BTC rejection would drag the altcoin market down, and SOL with it.
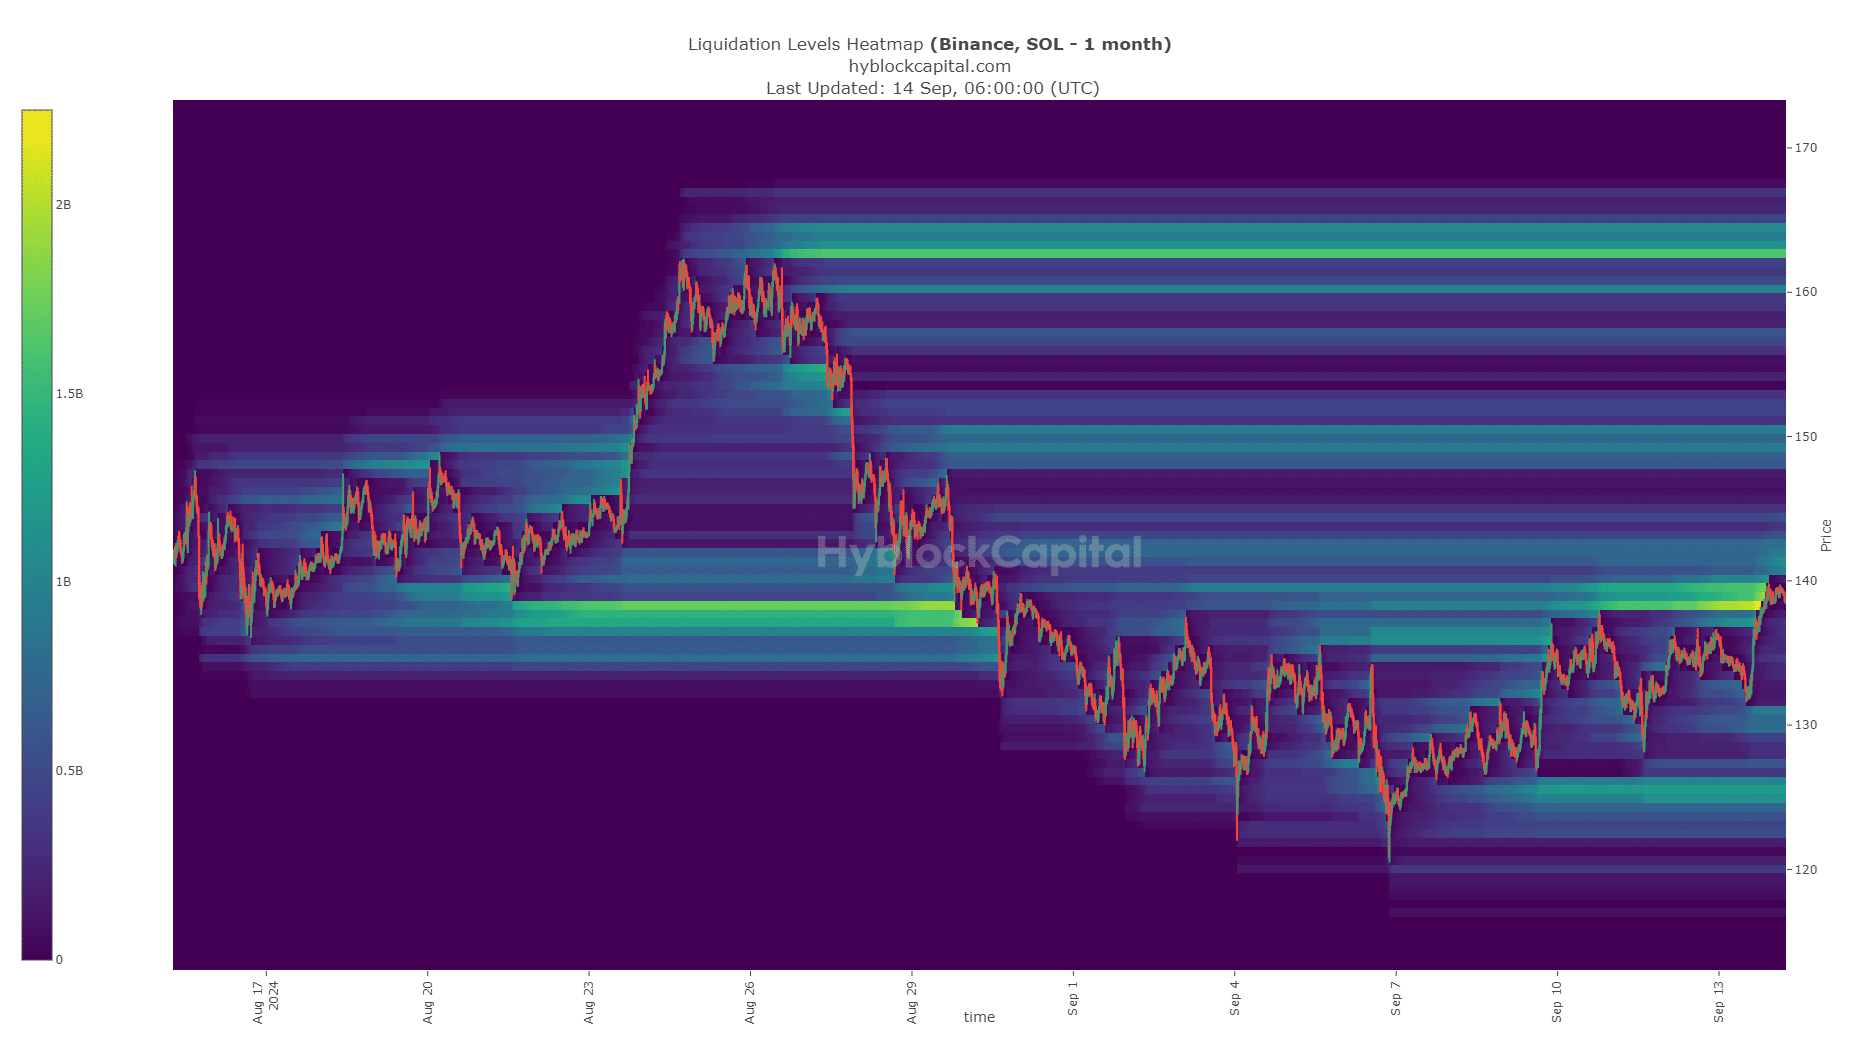
Source: Hyblock
The liquidity pocket at $138-$140 was swept during the most recent price move upwards. The $142 and $150 levels are the next liquidity targets, but Solana might not advance directly to these targets. Instead, a short-term dip appeared likely.
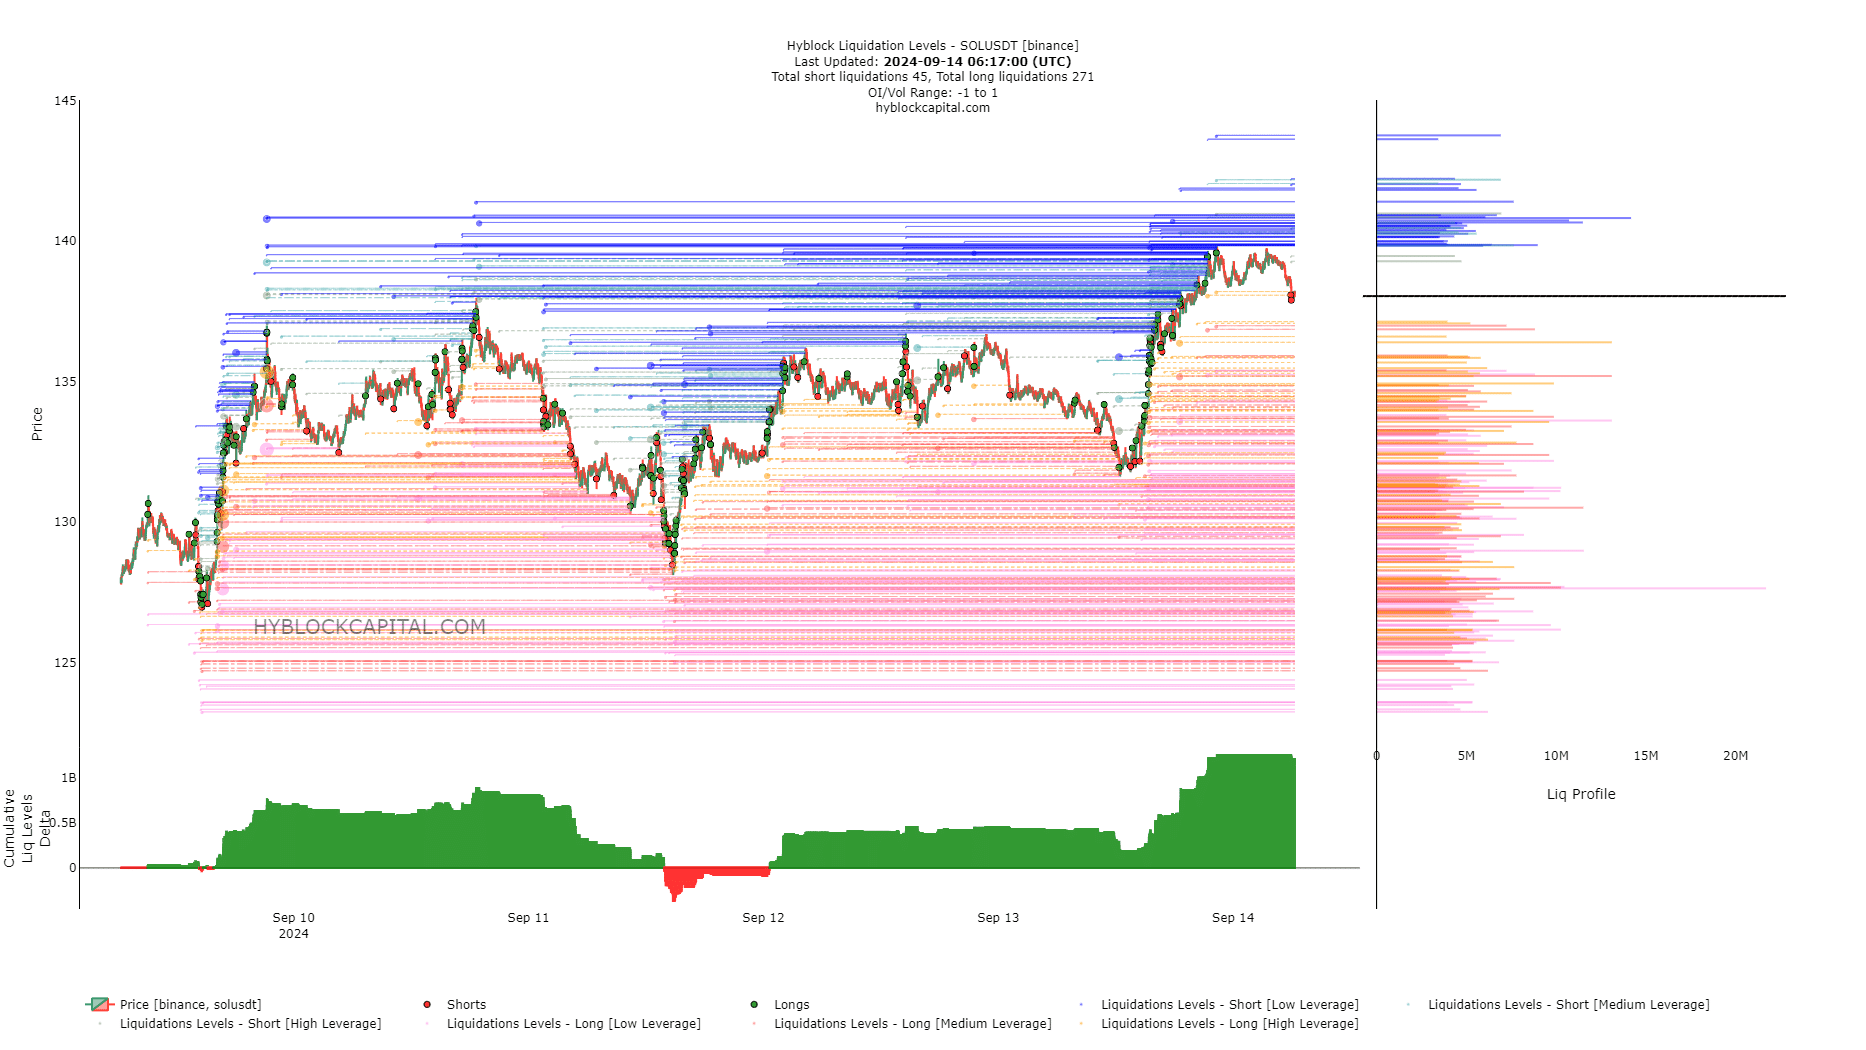
Source: Hyblock
This was because the liquidation levels were skewed bullishly in the short term. At press time, the cumulative liq levels delta was highly positive, showing a large imbalance toward long positions. This usually results in a price squeeze in the opposite direction to collect liquidity.
Read Solana’s [SOL] Price Prediction 2024-25
AMBCrypto also found that the $133 and $135 levels were the short-term targets based on the liquidation levels chart. A retest of this zone could present a buying opportunity, but buyers would have to wait for lower timeframe signs of a bounce.
Disclaimer: The information presented does not constitute financial, investment, trading, or other types of advice and is solely the writer’s opinion
Solana (SOL), the world’s fifth-biggest cryptocurrency by market cap, is poised for a massive price surge in the coming days following its major breakout. After struggling for nearly two weeks near the strong resistance level of $138, SOL has broken through this level today with a strong bullish candle on the daily time frame. Here’s the latest Solana price prediction.
According to the expert technical analysis, SOL appears bullish despite trading below the 200 Exponential Moving Average (EMA) on a daily time frame. In trading or investing, the 200 EMA is a technical indicator that suggests whether an asset is in an uptrend or downtrend.
Based on the historical price momentum, if SOL closes a daily candle above the $138 level, there is a strong possibility that it could soar by 20% to the $163 level and further to the $185 level if the bullish sentiment continues.
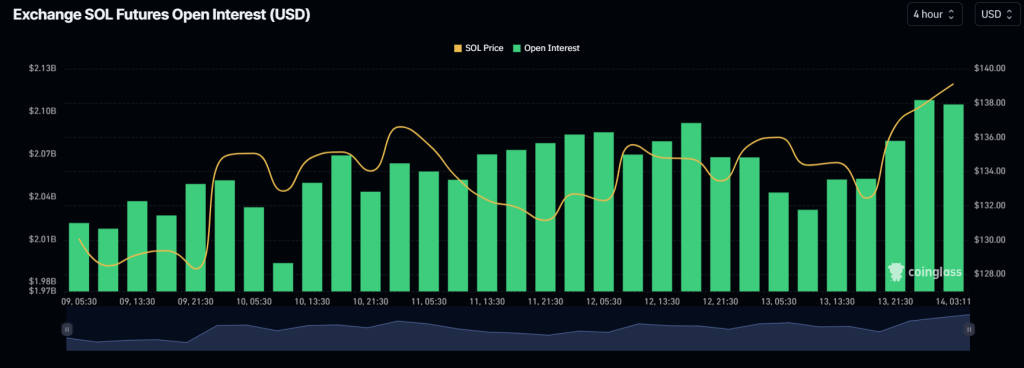
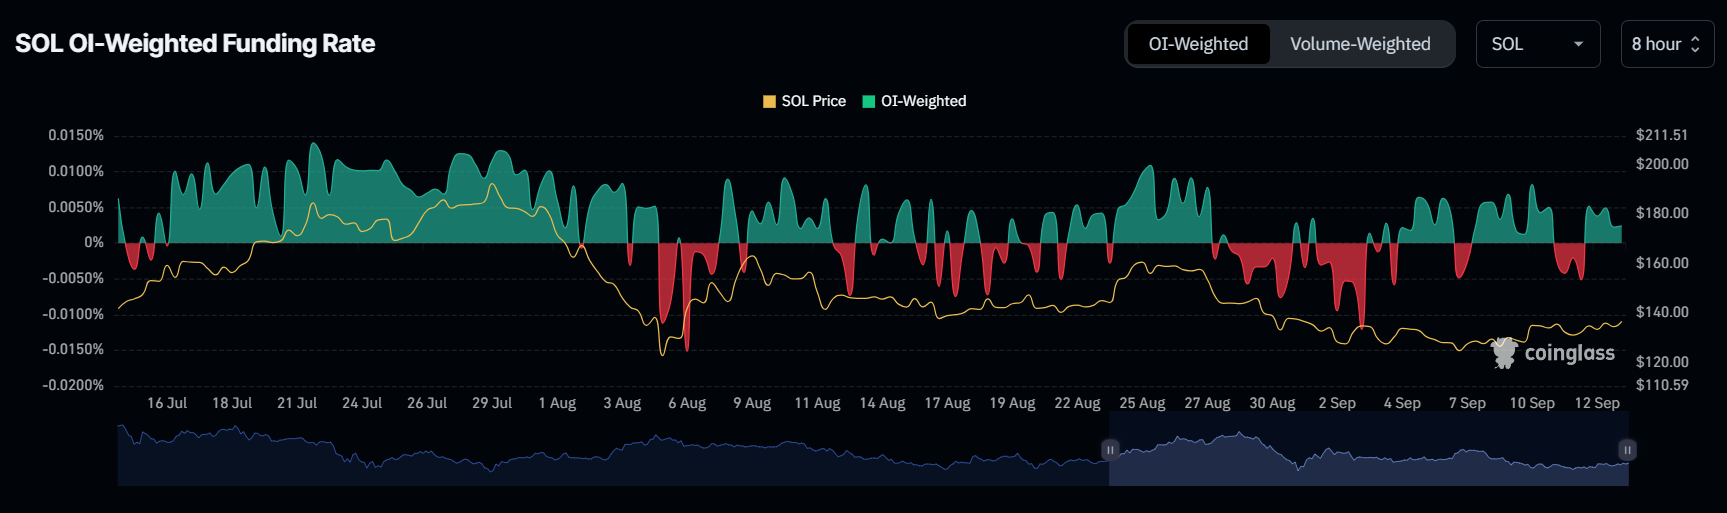
SOL’s bullish outlook is further supported by on-chain metrics such as long/short ratio, future open interest, and OI-weighted funding rate.
Coinglass’s long/short ratio for SOL currently stands at 1.0454, indicating traders’ bullish market sentiment. This on-chain metric helps traders and investors to identify the market sentiment. At press time, 51.11% of top traders hold long positions in SOL, while 48.89% hold short positions.

Meanwhile, SOL’s future open interest has increased by 4.5% in the last 24 hours and has been steadily rising. This indicates that traders are betting more on long positions rather than short positions. Traders and investors often consider rising open interest and a long/short ratio above 1, while building long or short positions.
Additionally, SOL’s OI-weighted funding rate currently stands at +0.0024%, indicating a bullish outlook for Solana.
At press time, SOL is trading near $139 and has experienced and has experienced a price surge of over 2.75% in the last 24 hours. Meanwhile, its trading volume has by 2.5% during the same period. This rising trading volume suggests higher participation from traders and investors following the recent breakout of a crucial resistance level.
This bullish thesis will only hold if SOL closes its daily candle above the resistance level, otherwise, it may fail.
Also Check Out: September 2024 Fed Rate Cut Analysis: Will the Fed Surprise Markets with a Bold Move?
As the crypto market recovers, investors turn their attention to altcoins such as XRP and Stellar (XLM). Analysts are revising their predictions for these digital assets as Bitcoin’s recent price action suggests a potential bull run.
Recently, Bitcoin re-entered the $58,000 price range, after briefly dropping to $52,000 last week. This recovery has had a noticeable, though differing, impact on XRP and XLM. While XLM reached a new weekly high, XRP’s movement was relatively subdued by comparison.
Nonetheless, the overall positive market sentiment has led to more ambitious projections for XRP and XLM. A prominent figure in the crypto community, “King Karan,” founder of AlphaHuskyClub, has offered a fresh set of predictions for various leading cryptocurrencies. He anticipates significant price increases for these assets during the 2024/2025 cycle.
In his analysis, Karan projects Bitcoin reaching $120,000, marking a substantial increase from its current price of approximately $56,728. This forecast would require the digital asset to rise by 111.5% from its current level.
Although the token recently faced fluctuations, many market analysts agree that its upward trend remains intact, supported by institutional interest and the broader adoption of cryptocurrencies.
Ethereum, the second-largest cryptocurrency by market capitalization, is also expected to see considerable gains. Karan’s bullish outlook places Ethereum at $10,000, representing a 327.9% increase from its current price of $2,337.
Ethereum has been a key player in the cryptocurrency space, driven by developments in decentralized finance (DeFi) and the continued growth of the Ethereum network.
In addition to his Bitcoin and Ethereum predictions, Karan has shared particularly optimistic forecasts for XRP and XLM. His outlook for XRP targets a price of $15, representing a potential growth of 2,771% from its current market value of $0.5335. This prediction is seen as ambitious, especially given that the digital asset has not experienced such dramatic price increases in the past six years.
However, recent developments in the XRP ecosystem, particularly the conclusion of its legal battle with the U.S. Securities and Exchange Commission (SEC), have fueled optimism among investors. Many now believe that the token is poised for a significant breakout, unhindered by regulatory concerns that have previously weighed on its performance.
Karan’s forecast for Stellar (XLM) is even more aggressive, projecting a price of $5 for the asset. Given XLM’s current value of $0.09268, this prediction suggests a potential increase of 5,294%. Stellar has shown the ability to experience rapid price appreciation in the past. For example, during the 2021 bull market, XLM surged from $0.036 in March 2020 to over $0.64 in May 2021, reflecting a 17-fold increase in value.
We are on twitter, follow us to connect with us :- @TimesTabloid1
— TimesTabloid (@TimesTabloid1) July 15, 2023
Karan’s predictions reflect the broader bullish sentiment that has returned to the cryptocurrency market. Bitcoin’s recovery has sparked renewed interest in altcoins, with XRP and XLM being the primary beneficiaries. Many investors hope these assets will follow Bitcoin’s lead, potentially delivering substantial returns over the next few years.
Despite the inherent volatility of the cryptocurrency market, Karan’s analysis highlights the potential for significant growth in the space. His optimistic projections are based on the assumption that Bitcoin continues to rise toward the $120,000 mark. Should the token reach this level, the rest of the market, including XRP and XLM, is expected to experience similar upward momentum.
Disclaimer: This content is meant to inform and should not be considered financial advice. The views expressed in this article may include the author’s personal opinions and do not represent Times Tabloid’s opinion. Readers are urged to do in-depth research before making any investment decisions. Any action taken by the reader is strictly at their own risk. Times Tabloid is not responsible for any financial losses.
Follow us on Twitter, Facebook, Telegram, and Google News
Crypto analyst Dan Gambardello has highlighted the Cardano (ADA) roadmap to a new all-time high (ATH). The analyst also suggested that Cardano was halfway to reaching a new high, noting what part of its cycle the coin was currently at.
Gambardello remarked in an X (formerly Twitter) post that Cardano is in stage three of its cycle. He claimed that this part of the cycle for ADA is the “Told you. You should’ve listened” stage. This refers to the point where investors begin to capitulate, thinking that the crypto is unlikely to surge in the bull market given its bearish price action.
Once this stage is done, Cardano is expected to move to the next stage of its cycle, which Gambardello called the “Here we go again, another bull trap” stage. This stage will help shake out the short-term traders who jumped on ADA, believing its price would rise soon enough. Once the non-believers have been shaken out, the analyst predicts that Cardano will move to the last part of its cycle, when it will shatter its ATH and reach new highs.
In his accompanying chart, Gambardello predicted that Cardano would rise to as high as $15 by year-end 2025. The analyst also indicated that ADA will enjoy a price surge beyond 2025, expected to mark the end of this cycle’s bull run. Interestingly, he forecasts that Cardano’s price will double in a year and rise to $31 by year-end 2026.
A rise to $31 means that Cardano will have a market cap of $1 trillion. For context, the crypto market currently has a market cap of $2 trillion, meaning that figure is set to increase exponentially if ADA alone becomes valued at $1 trillion. The analyst didn’t provide any reason for believing the crypto can experience such massive growth in two years.
Crypto analyst InvestingHaven has offered a more conservative price prediction for Cardano. In an X post, the analyst stated that the crypto will reach a “super bullish target of $1.95” in 2025. He also questioned whether ADA was ready for a breakout, claiming that the $0.443 Fibonacci level was the key to unlocking higher prices.

InvestingHaven added that the 2025 outlook for Cardano is full of potential, reaffirming that this is when the crypto will enjoy a parabolic rally. ADA has had a rough 2024 despite bullish developments like the Chang Hard Fork, which ushered in a decentralized governance system for the Cardano network. It is one of the worst-performing crypto assets this year, with a year-to-date (YTD) loss of over 40%.
At the time if writing, Cardano is trading at around $0.35, down almost 2% in the last 24 hours, according to data from CoinMarketCap.

Featured image created with Dall.E, chart from Tradingview.com
According to an analysis by AnalysisParalysis on TradingView, XRP is expected to experience tremendous growth in the near future. The analyst expects that the United States Securities and Exchange Commission (SEC) would appeal the Ripple lawsuit ruling before October 6th, 2024.
This appeal is predicted to act as a big trigger for XRP, leading the cryptocurrency to fall before launching a massive upward surge.
According to AnalysisParalysis suggested timeline, XRP could drop as low as $0.33 in early October 2024 before experiencing a significant price increase that could see it reach $8.80 by the summer of 2025.

As we previously reported, the recent statement from Grayscale on the launch of the first US-based XRP Trust appears to validate this forecast.
While the Grayscale XRP Trust was designed to increase institutional interest in XRP’s unique cross-border payment capabilities, the analyst feels the release may be a last-ditch effort to boost XRP’s price before the expected drop.
The lackluster market reaction to this revelation, despite its positive connotations, is interpreted as further indication that a price drop is imminent.
Grayscale’s XRP Trust seeks to provide institutional investors with exposure to XRP, perhaps bringing XRP into the spotlight for mainstream financial institutions. The trust could also be turned into an exchange-traded fund (ETF), pending SEC clearance.
This conversion would strengthen XRP’s position in the broader financial markets, indicating a possible shift toward mainstream usage. However, this SEC approval is dubious, particularly given the regulator’s complex legal struggle with Ripple.
As of this writing, XRP is trading at around $0.5673, up more than 4% over the last 24 hours. This latest jump has increased its market cap almost to $32 billion, emphasizing the asset’s volatility while also being highly dynamic.
While some traders might view the current upward trend as optimistic, many in the XRP community are closely monitoring the possibility of a crash and a quick rebound. The market looks to be bracing for turmoil, with traders anticipating both short-term losses and possibly long-term gains.
Despite being a pioneering achievement, the Grayscale XRP Trust has not received the overwhelming positive reception that some had hoped for.
The market’s subdued reaction could be attributed to a broader expectation of regulatory uncertainty and an impending SEC appeal. The XRP market appears to be treading a tight line, torn between enthusiasm over institutional use and anxiety about upcoming regulatory events that could influence its future.
No spam, no lies, only insights. You can unsubscribe at any time.

 Price Prediction and Outlook for This Week")

