The main tag of cryptocurrency price today Articles.
You can use the search box below to find what you need.
[wd_asp id=1]
The main tag of cryptocurrency price today Articles.
You can use the search box below to find what you need.
[wd_asp id=1]
Polygon (MATIC) price, an Ethereum scaling solution, has recently witnessed a modest uptick in its MATIC token price. Over the previous week, however, the token predominantly exhibited a downward trend. Despite this, attempts at a price recovery are proving to be challenging.
Polygon price has initiated a major upgrade by introducing the POL token on its mainnet, supplanting the previously used $MATIC. This shift occurred on September 4th, marking a significant step in the Polygon 2.0 strategy. The POL token retains all functionalities of its predecessor, including roles in staking and network fees.
Moreover, POL brings improved features aimed at enhancing security and scalability. These advancements also facilitate staking across multiple chains. This transition underscores Polygon’s commitment to fostering robust growth within its ecosystem.
Polygon price has experienced a fluctuation in the past 24 hours, indicating a volatile market day. The layer 2 blockchain hovers above $0.37, a crucial support level. As of reporting time, the MATIC price is trading at $0.374, slightly increasing by 1.14%. This increase follows a significant spike that saw the price briefly touching $0.3786 before retreating.
The daily technical indicators for MATIC Network present a mixed signal to traders and investors. The Relative Strength Index (RSI) is neutral at 41.85, suggesting that MATIC is neither overbought nor oversold. The Moving Average Convergence Divergence (MACD) indicates a bearish trend. The histogram’s movement is below the zero line, and the MACD line trails below the signal line.

According to data from Santiment, the MVRV (Market Value to Realized Value) Ratio for MATIC has displayed significant fluctuations over the past six months. Notably, there was a sharp spike in early May when the MVRV ratio exceeded 95%. This suggests that most holders would have made a profit if they had sold their MATIC at that time.
Following this peak, the ratio plummeted, reaching a low of around -70.90% as of September 7, indicating that most holders would incur losses if they sold their holdings now. This dramatic change may reflect shifting investor sentiment and market conditions.

Polygon price could experience a notable ascent if it surpasses the resistance at $0.40. This breakthrough may pave the way for a target of $0.50, which could further propel the cryptocurrency to test the $0.55 level. The post-POL Migration phase holds promise. It could significantly bolster Polygon’s value, driving it up by 168% to $1.
The POL token was introduced as part of Polygon’s strategy to improve functionality, including multi-chain staking capabilities and overall network performance.
Existing MATIC holders are expected to transition to the POL token, retaining equivalent functionalities such as staking and paying network fees.
Benefits include improved security, enhanced scalability, and potential increased stability in token value due to these enhancements.
Coingape Staff
CoinGape comprises an experienced team of native content writers and editors working round the clock to cover news globally and present news as a fact rather than an opinion. CoinGape writers and reporters contributed to this article.
Disclaimer: The presented content may include the personal opinion of the author and is subject to market condition. Do your market research before investing in cryptocurrencies. The author or the publication does not hold any responsibility for your personal financial loss.
Dogecoin [DOGE] saw a spike in social sentiment recently, and its social media engagement has been on the rise too. This could help the price action turn bullish. However, at press time, the sellers’ dominance was too high.
The memecoin retested its July low at $0.09136 as support, with technical analysis showing that further losses may be likely.

Source: DOGE/USDT on TradingView
The daily chart showed Dogecoin dipping towards the $0.09136 support level once again over the past two weeks. During this time, the downtrend regained its momentum. The RSI, which briefly raised its head above neutral 50, was forced into bearish territory.
The DMI indicator revealed that the -DI (red) and the ADX were both above 20 – Signaling a strong downtrend in progress. The trading volume was low during the attempted price bounce, underlining a lack of conviction in August.
The weekly and the daily structure were starting to align though. And, the Fibonacci extension level at $0.07162 may be the next target for DOGE if $0.09136 gives way.
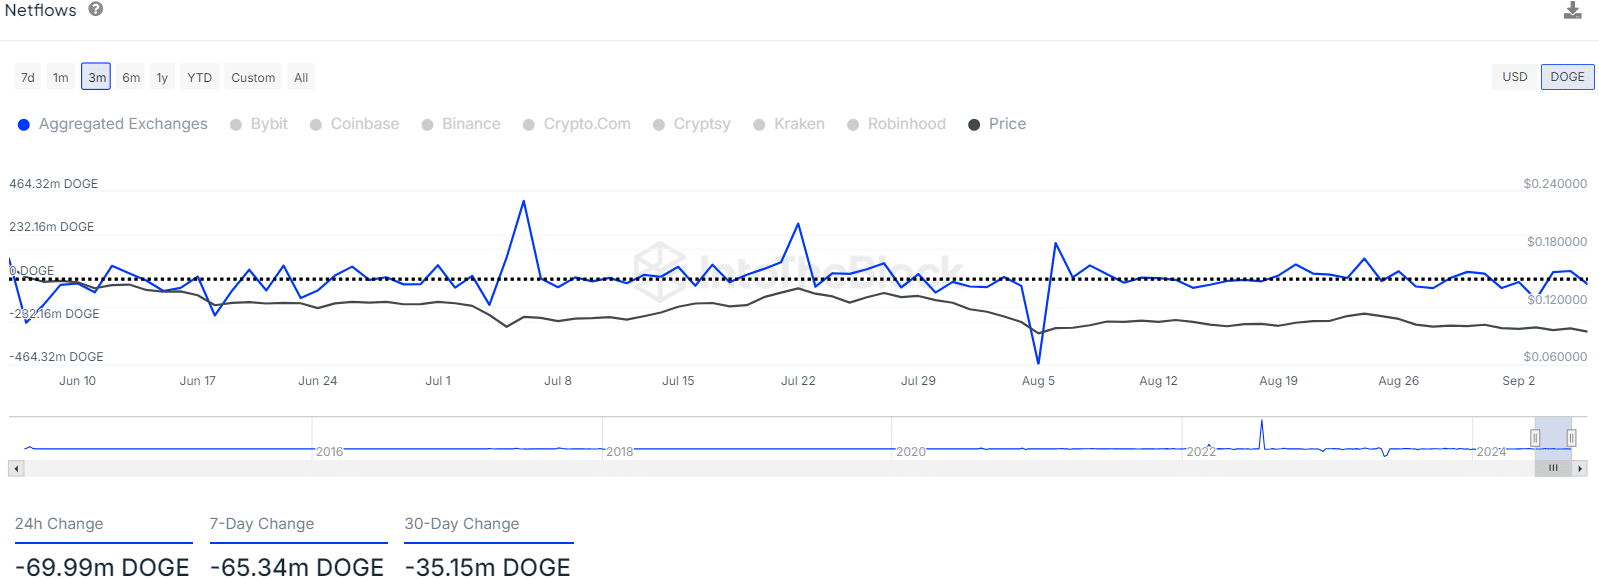
Source: IntoTheBlock
AMBCrypto looked at the exchange netflow data of the past three months too. Overall, the 35.15 million DOGE outflows over the past month were worth $3.211 million of accumulation. In the grand scheme of things, this value isn’t much for a $13.7 billion market cap asset.
And yet, this came at a time of intense selling pressure, and every little bit of accumulation helps the bullish argument.
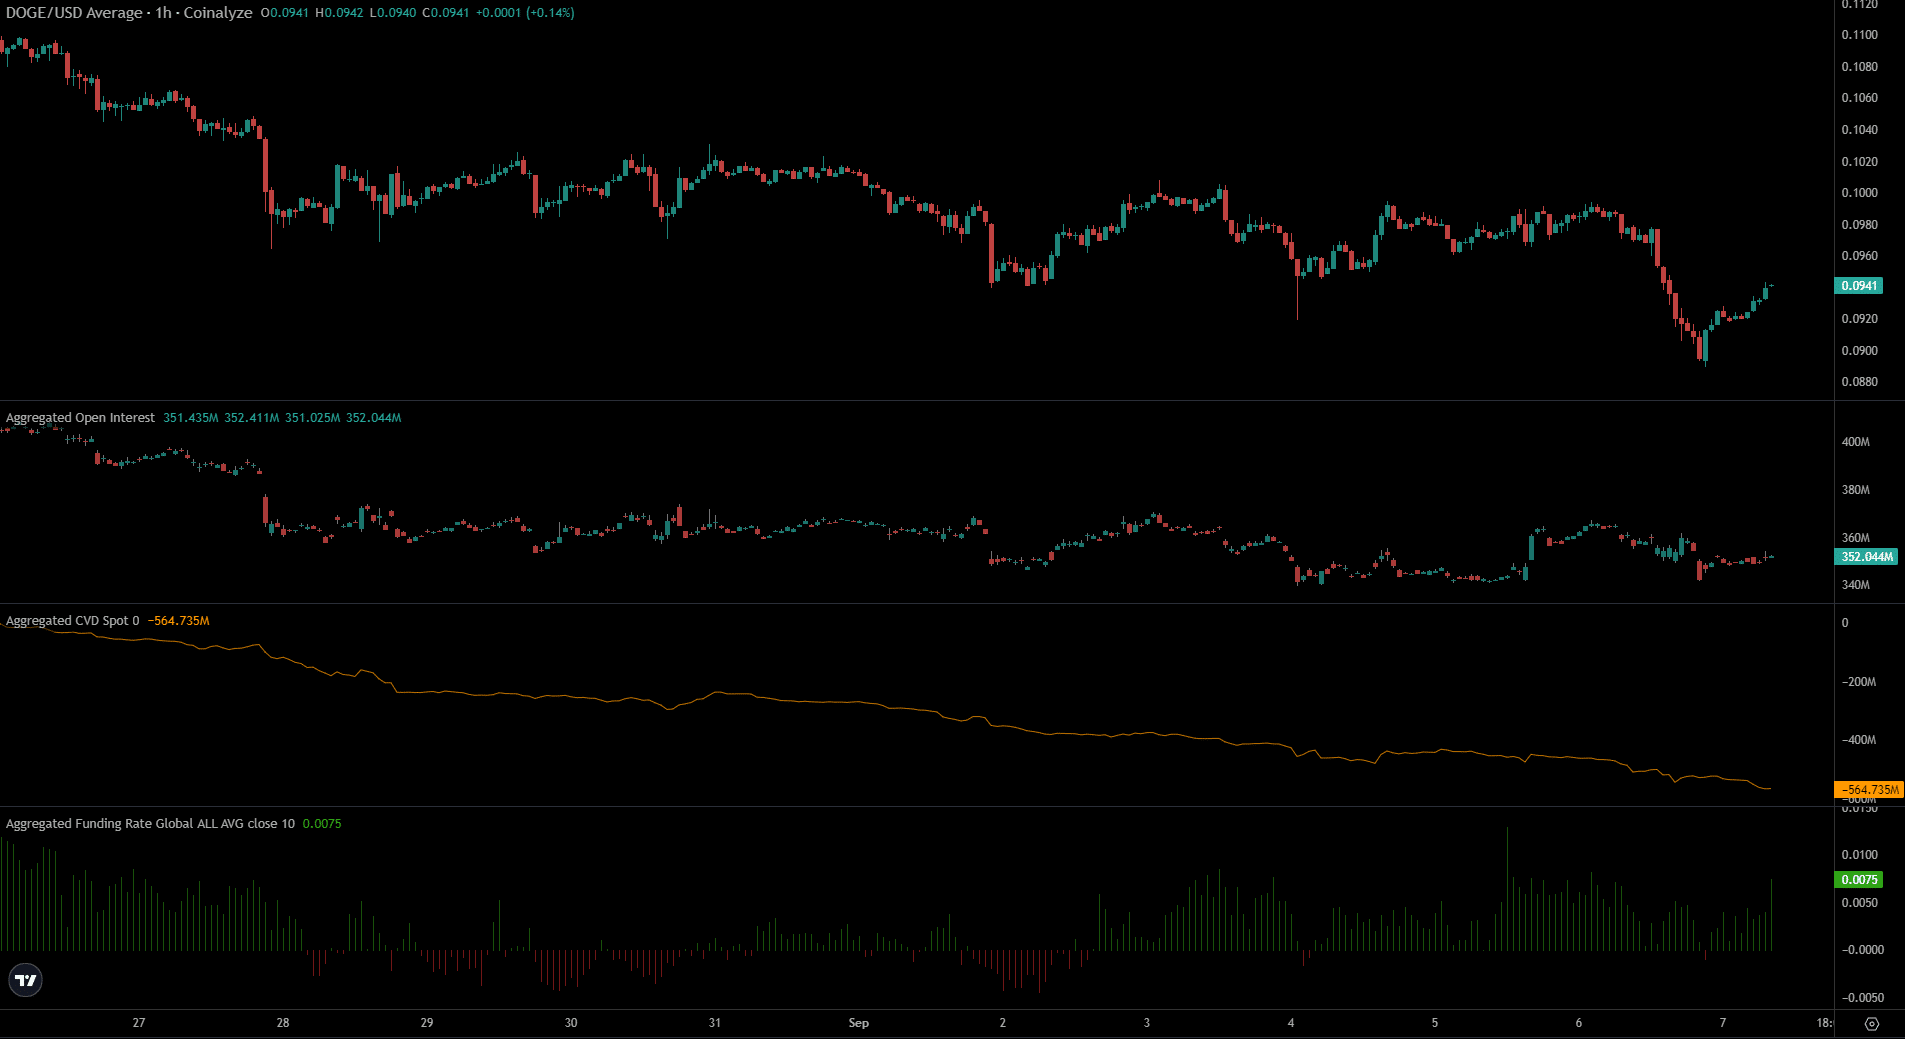
Source: Coinalyze
While some market participants moved their tokens out of exchange wallets, others remained eager to sell. Also, the spot CVD seemed to be in a continual downtrend over the past two weeks as prices steadily slumped.
Is your portfolio green? Check the Dogecoin Profit Calculator
The Open Interest flatlined between the $340 million to $360 million range. The most recent price drop on Friday, 6 August saw the Open Interest rise – A sign of short-selling and bearish sentiment.
Disclaimer: The information presented does not constitute financial, investment, trading, or other types of advice and is solely the writer’s opinion
Disclaimer: The opinions expressed by our writers are their own and do not represent the views of U.Today. The financial and market information provided on U.Today is intended for informational purposes only. U.Today is not liable for any financial losses incurred while trading cryptocurrencies. Conduct your own research by contacting financial experts before making any investment decisions. We believe that all content is accurate as of the date of publication, but certain offers mentioned may no longer be available.
The correction continues on the cryptocurrency market on the weekend, according to CoinMarketCap.
The price of Cardano (ADA) has gone down by 0.09% over the last 24 hours.
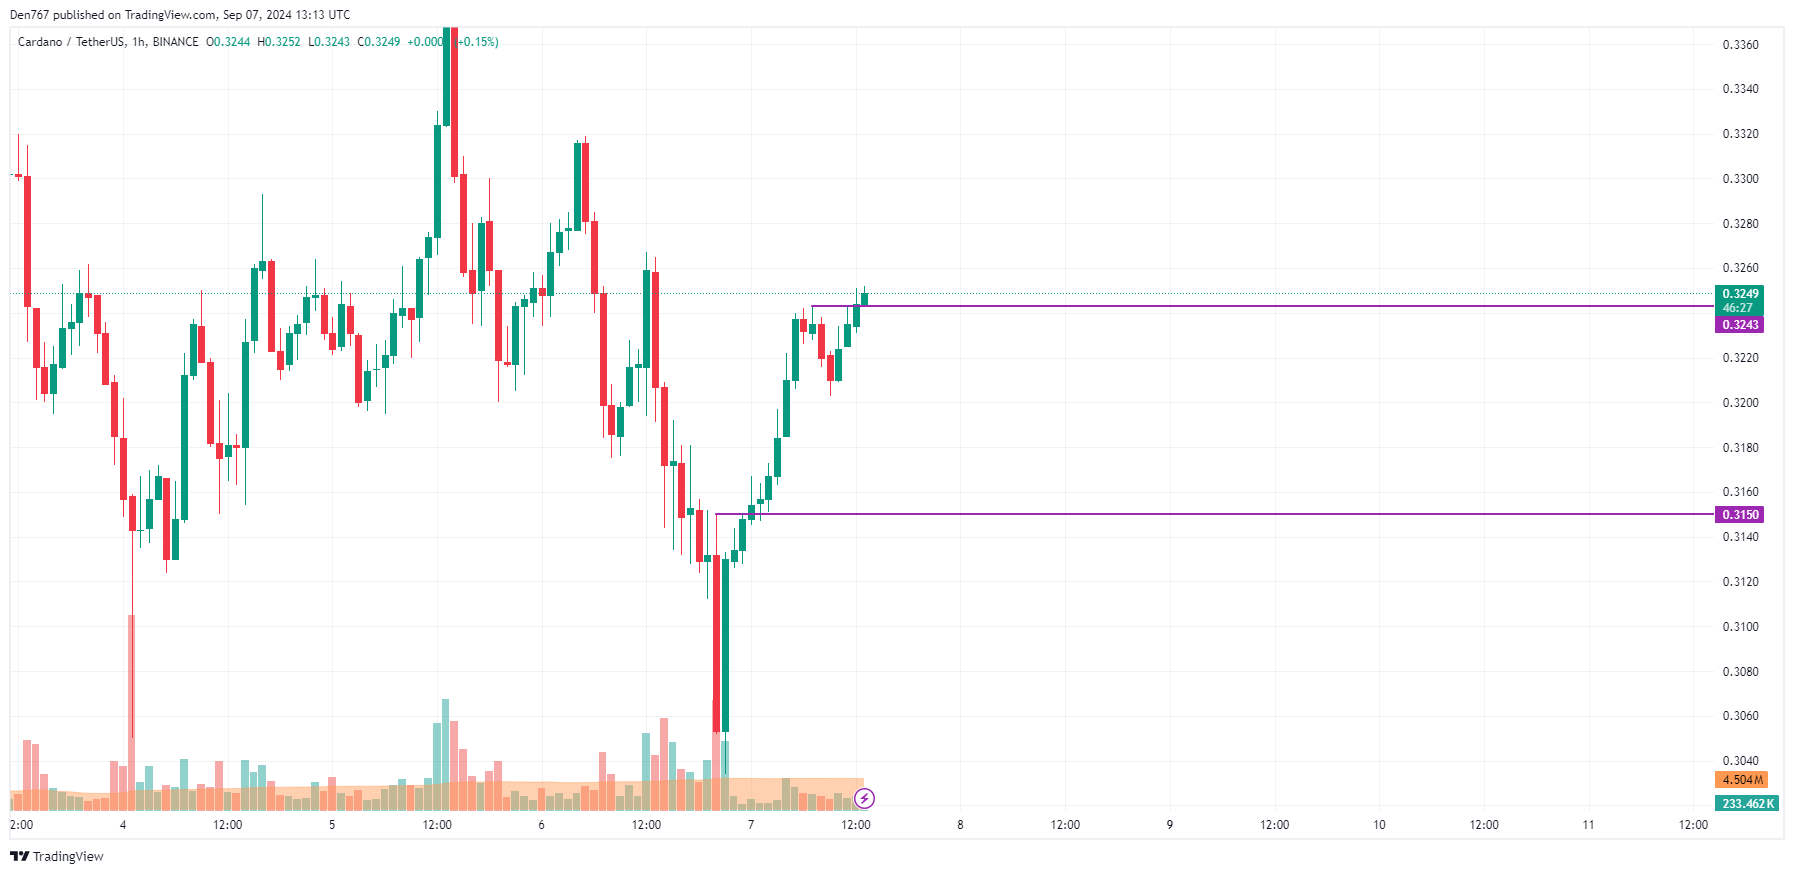
On the hourly chart, the rate of ADA has broken the local resistance of $0.3243.
Related

If the daily bar closes above that mark and with no long wick, the upward move is likely to continue tomorrow to the $0.33 range.
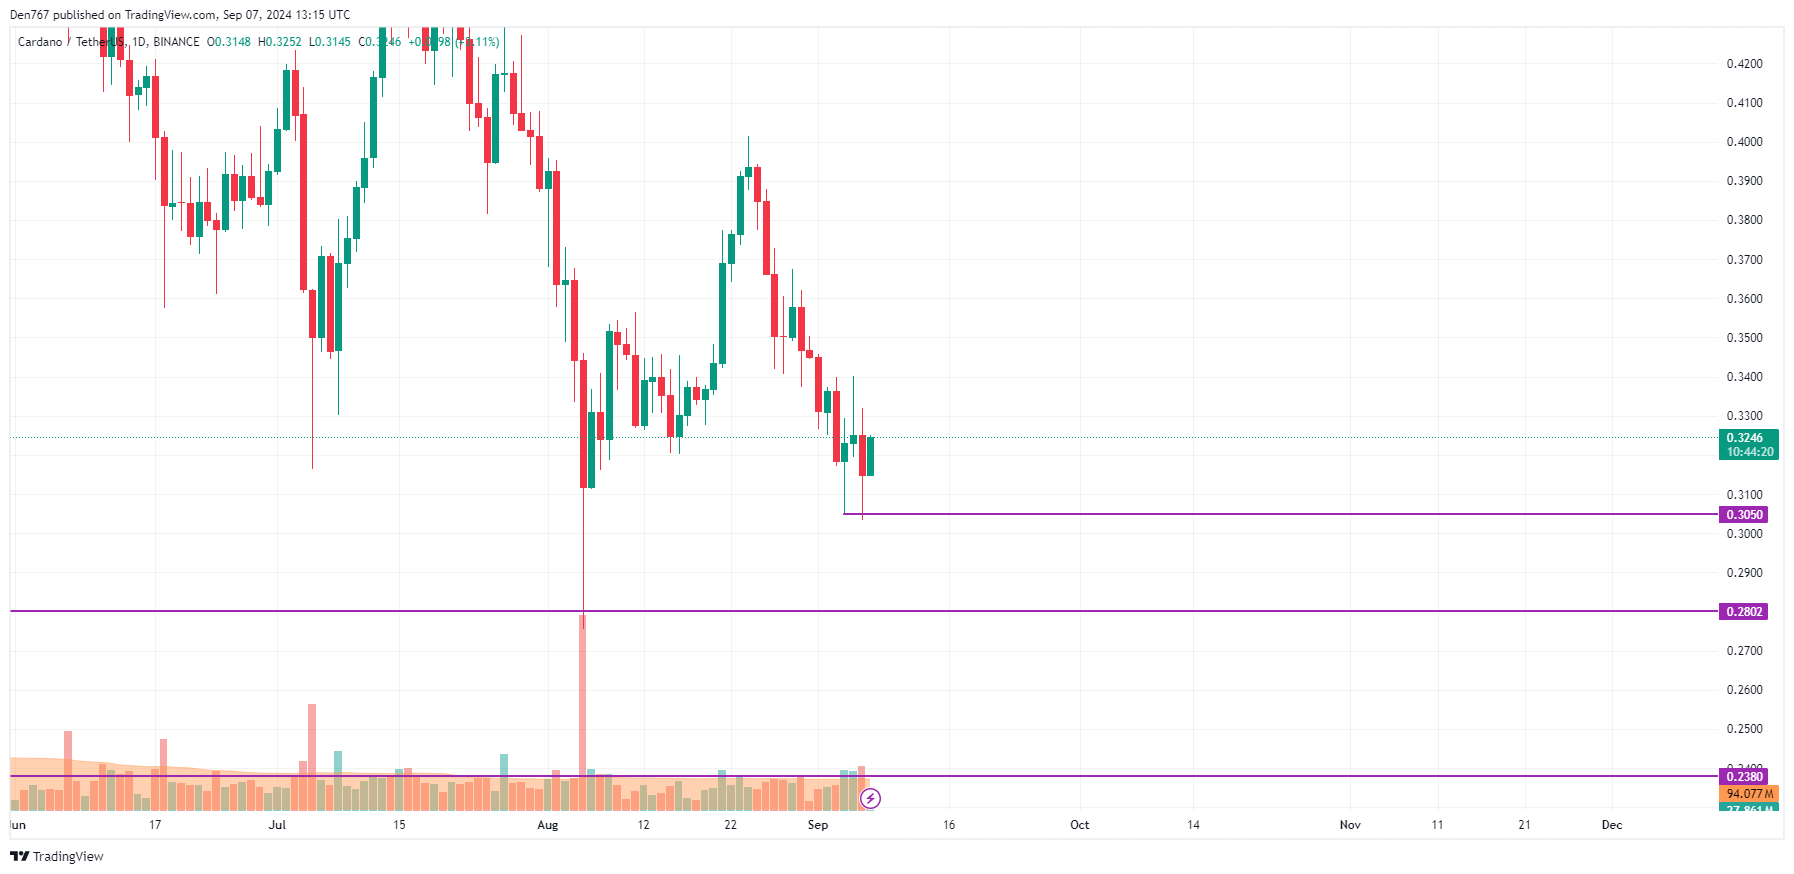
On the bigger time frame, the price of ADA is rising after a false breakout of the support level of $0.3050. If the candle closes near $0.33, the energy might be enough for an ongoing bounce back to the $0.34-$0.35 zone.
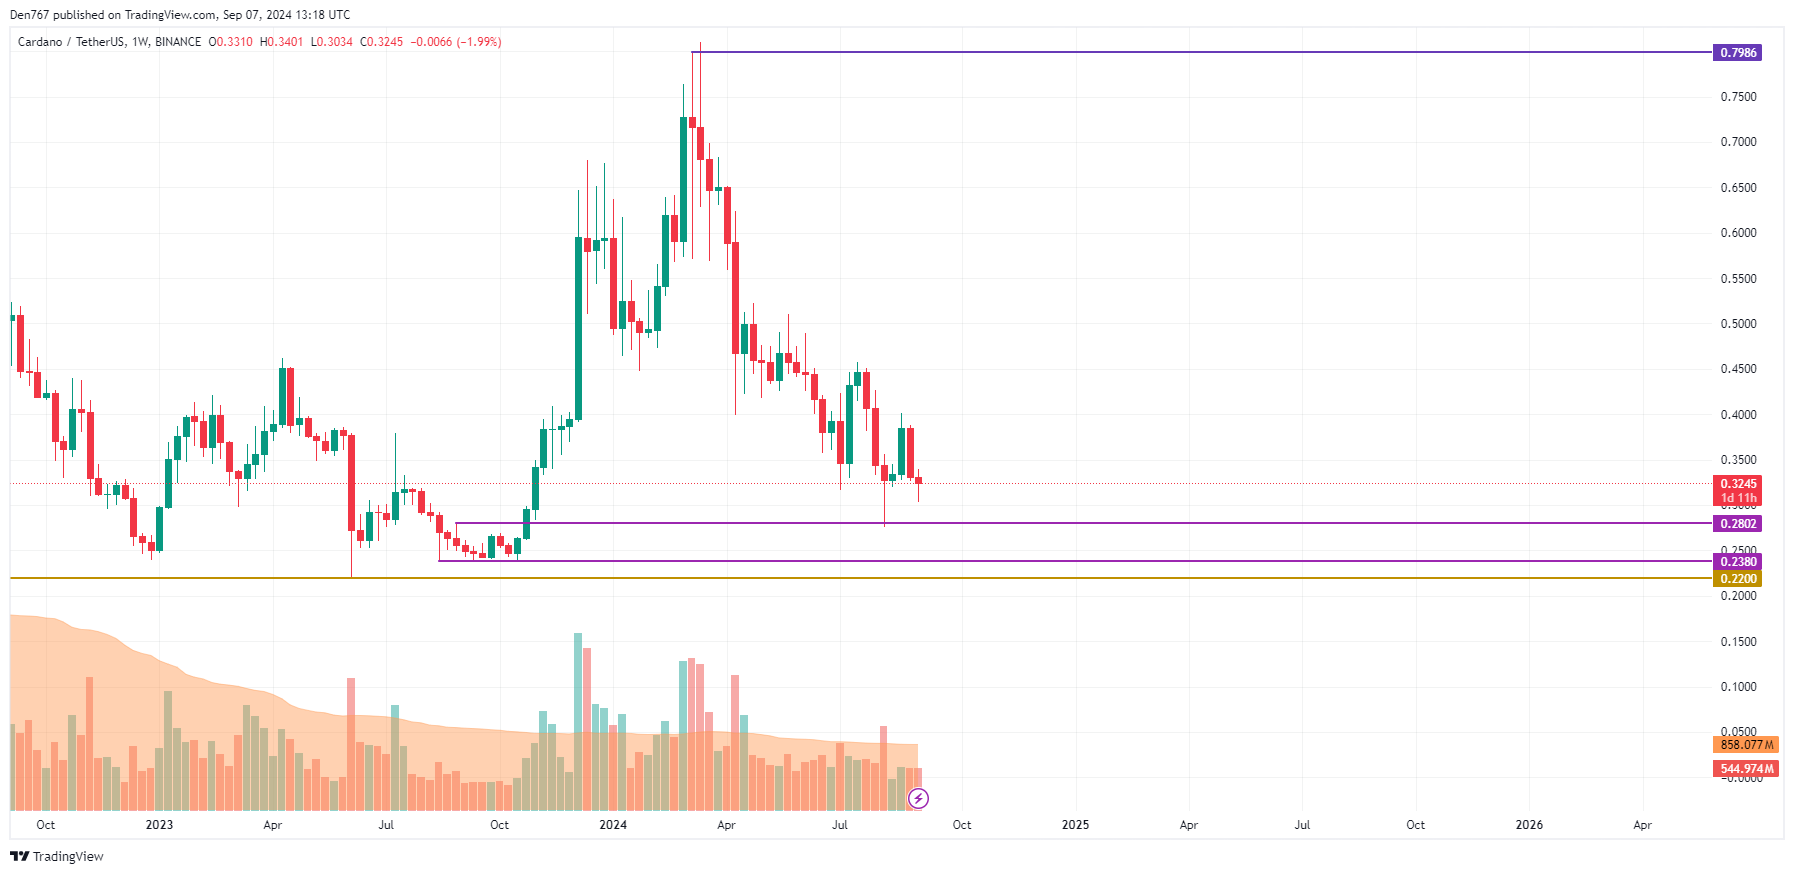
From the midterm point of view, one should pay attention to the weekly bar closure. If it happens around the current prices, there is a chance of a local rise to the $0.35 area.
ADA is trading at $0.3243 at press time.
XRP price could reach unprecedented levels if XRP follows Bitcoin as the market leader guns for a $61 trillion market cap.
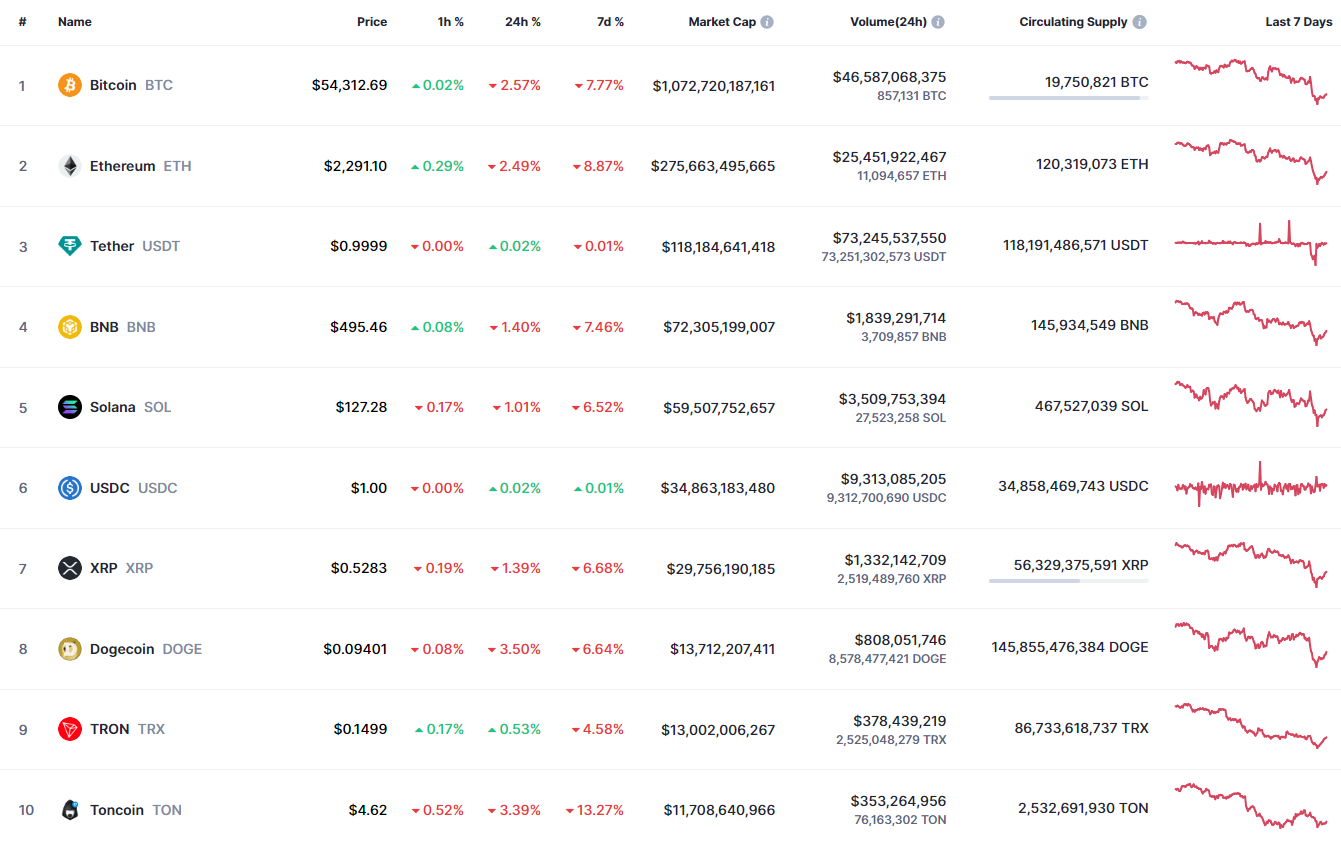
Notably, at press time, Bitcoin (BTC) currently boasts a market cap of $1.072 trillion, firmly holding its spot as the largest cryptocurrency by valuation. BTC alone accounts for over 55% of the global crypto market cap, with the entire altcoin market sharing the remaining 45%.
Being the market leader, Bitcoin often dictates the direction of the broader crypto market. This trend has been observed across multiple market cycles, where a BTC drop leads to a bearish market and an uptrend typically triggers a bull run.
For instance, with Bitcoin now down 2.66% over the past 24 hours, the rest of the market has collapsed. XRP, one of the top 10 largest altcoins, has also trailed Bitcoin’s price action. Data from CoinMarketCap confirms that XRP price has consistently moved alongside Bitcoin over the past month.

Due to this price correlation, any upsurge recorded by Bitcoin could spill to the altcoin market, impacting XRP. As a result, bullish predictions surrounding Bitcoin could indirectly translate to a positive outlook for the entire crypto market, with XRP poised to benefit significantly from such positive movements.
One such bullish prediction came from Bitcoin ETF issuer and asset manager VanEck. In a report earlier this week, The Crypto Basic confirmed that VanEck predicted a possible spike in Bitcoin’s price to $2.9 million by 2050. Remarkably, such a value could push Bitcoin’s market cap to a whopping $61 trillion, the largest for any single asset.
Bitcoin, which trades for $54,219, would need to rally 5,248% to hit the $2.9 million target. If XRP follows in Bitcoin’s footsteps, its price could surge tremendously. For context, XRP price currently hangs around $0.5274, with a market cap of $29.7 billion. A 5,248% increase would push XRP to $28.2, with a market cap of $1.58 trillion.
Meanwhile, AI chatbots ChatGPT and Grok presented a mix of varying targets for XRP if Bitcoin hits the $2.9 million goal. Grok predicted that XRP could rally to $16.897 in a scenario where BTC clinched the VanEck target, considering multiple market assumptions.
However, ChatGPT presented a more bullish outlook. According to the OpenAI-backed LLM chatbot, XRP is capable of reaching $29.85 if it mirrors Bitcoin’s gains on the back of a rally to $2.9 million.
Disclaimer: This content is informational and should not be considered financial advice. The views expressed in this article may include the author’s personal opinions and do not reflect The Crypto Basic’s opinion. Readers are encouraged to do thorough research before making any investment decisions. The Crypto Basic is not responsible for any financial losses.
Solana (SOL) has been navigating a turbulent sea of price fluctuations recently, struggling to break past the $160 resistance. After hitting a significant 20% decline at the end of August, the crypto currency now shows signs of potential recovery. As market sentiment shifts and indicators suggest a possible rebound, experts are beginning to anticipate a reversal rally for Solana.
In late August, Solana’s price faced a substantial drop, falling by 20% and raising concerns among investors. Despite multiple attempts to surpass the $160 resistance level, SOL was unable to secure a position above this threshold, leading to heightened caution in the market. However, recent indicators are starting to paint a more optimistic picture for Solana.
One significant factor in the current analysis is the recent negative turn in the funding rate for Solana. This rate, which tracks the cost of holding positions in the futures market, often reflects shifts in market sentiment. Brian Quinlivan, Lead Analyst at Santiment, highlighted that the negative funding rate could signal an impending rebound.
Quinlivan explained, “SOL has always been very sentiment driven. We’re monitoring its Binance funding rate closely. A pattern of increasing shorts suggests that bearish sentiment might be peaking, which could trigger a price reversal.”
The Chaik in Money Flow (CMF) indicator, another crucial tool in evaluating SOL’s potential, has also shown promising signs. This indicator measures the cumulative flow of money into and out of an asset. Historically, when the CMF dips to -10.0, Solana has demonstrated a tendency to recover within a week to ten days. This pattern suggests that the recent decline might be short-lived, with the potential for a price increase in the near future.
Moreover, the broader economic environment plays a role in shaping Solana’s price movement. Growing institutional interest and market participation could further bolster SOL’s recovery, supporting the case for a positive price forecast.
Currently, Solana’s price stands at $132, showing resilience after bouncing from a support level of $126. For SOL to continue its upward momentum, it must first overcome the local resistance at $137. Successfully breaking through this level could set the stage for a push towards the $160 mark.
Historical data suggests that Solana has often experienced consolidation phases between $126 and $160, indicating that reaching this level again is plausible.
However, there is a caveat. Solana has recently struggled to breach the $137 resistance. If SOL continues to face difficulties in over coming this barrier, it may remain in a side ways movement, which could dampen the bullish outlook and challenge the anticipated recovery.
As Solana navigates through these fluctuating market conditions, the potential for a reversal rally remains strong. Key indicators, such as the negative funding rate and CMF patterns, combined with historical price behavior, suggest that SOL could be on the verge of a significant rebound. Traders and investors will be closely watching to see if Solana can break through the $137 resistance and continue its journey towards $160.
Post Views: 3
The chart above shows that only 818,273 unique addresses conducted transactions on the Bitcoin network over the last 7-days. But zooming out it shows that this is the lowest network usage Bitcoin has recorded since 2021.
For context, Bitcoin network demand reflects a staggering 39% decline from the 1.13 million active addresses recorded on March 13, 2024 when BTC price hit an all time-high.
Typically, a persistent decline in daily active addresses is taken as a tell-tale bearish signal of investor disinterest. The red arrows in the chart further depict how BTC prices has often fallen significantly during periods similar sharp declines in network activity.
Evidently, the 39% Bitcoin network demand downtrend over the last 6 months has been pivotal in BTC retracing 28% from its all-time high of $72,300 on March 13 to hit the $53,334 level at the time of publication on Sept 5.
However Kyle Doops, a prominent analyst and host of the Crypto Banter show, painted an optimistic outlook of this narrative.
In a recent post on the X (formerly Twitter) he stated that:
The sharp reduction in active Bitcoin addresses in 2024 indicates a pause in market activity, differing from past bear markets.
Despite price stagnation, investors are cautiously observing, influenced by external factors such as ETFs and the U.S. election. A rebound in active addresses could signal a future price rise.
– Kyle Doops ( Technical Analyst & CryptoBanter show host. )
According to Kyle the decline in BTC active addresses implies a decrease in transaction volume, could mean investors are choosing to wait and see how Bitcoin will react, given the current uncertain economic landscape.
Bitcoin price fell 5% within the daily timeframe on Sept 6, slipping deeper into bearish territories. The current Bollinger band and RSI technical indicators’ set-up suggest Bitcoin price could be at risk of a rapid crash towards $50,000 in the days ahead.
Bollinger Bands, a popular technical indicator, are used to gauge price volatility and potential breakout points.
As of September 6, Bitcoin’s price of $53,108 has fallen below the lower Bollinger Band at $54,151. This breach of support typically signals further downside ahead, especially if other market conditions remain bearish.
In 2020, Dogecoin experienced a modest increase in price, starting the year around $0.002. The coin gained traction due to its strong community and meme-driven popularity. By the end of the year, DOGE had reached approximately $0.005, reflecting growing interest and engagement.
2021 was a landmark year for Dogecoin, driven by social media buzz and endorsements from high-profile figures. DOGE surged from $0.005 at the beginning of the year to a peak of around $0.73 in May. Despite a subsequent pullback, the price remained elevated, closing the year at around $0.20.
Dogecoin faced significant volatility in 2022 as the broader cryptocurrency market experienced corrections. Prices fluctuated between $0.10 and $0.20. Despite a decline from the previous year’s highs, DOGE maintained a notable presence due to its strong community and meme appeal.
In 2023, Dogecoin’s price stabilized between $0.06 and $0.15. The focus shifted to potential technological improvements and broader use cases. The price steadied as the community continued to support DOGE, with ongoing discussions about integrating DOGE into new platforms and services.
Looking ahead, Dogecoin is well-positioned for potential growth driven by ongoing community support and possible technological upgrades. If it can leverage its strong social media presence and explore new applications, DOGE could test new highs at $1 and solidify its role in the cryptocurrency market.
Finder’s panel of experts has provided a range of forecasts for XRP, reflecting varying opinions on its future performance. As of now, XRP is trading at approximately $0.60. The average prediction from Finder’s panel is that XRP will close 2024 at around $0.66. Looking further ahead, the panel estimates that XRP could rise to $1.05 by the end of 2025 and reach $2.49 by 2030. These projections are largely influenced by XRP’s role in facilitating cross-border payments and its strategic partnerships with major financial institutions.
“Finder’s panel of fintech experts anticipates, on average, XRP will close 2024 at a price of 66 cents,” stated the report. “Looking further ahead, our panel estimates XRP’s value could hit $1.05 by the end of 2025 and $2.49 by 2030.”
The positive outlook is driven by XRP’s ongoing involvement in cross-border transactions and its potential to form strategic alliances with financial giants. However, it is essential to consider that regulatory challenges, particularly those posed by the U.S. Securities and Exchange Commission (SEC), could impact XRP’s future price movements.
The range of predictions for XRP highlights the diversity of opinions among financial experts. Some panel members are highly optimistic about XRP’s future, while others express caution. Here’s a closer look at the differing forecasts:
Several key factors are influencing XRP’s future price projections:
Finder’s updated XRP price predictions provide a range of insights into the digital asset’s potential performance over the coming years. While the panel’s average forecast suggests moderate growth, individual experts present a spectrum of possibilities—from cautious expectations to highly optimistic projections.
Post Views: 3
Disclaimer: The opinions expressed by our writers are their own and do not represent the views of U.Today. The financial and market information provided on U.Today is intended for informational purposes only. U.Today is not liable for any financial losses incurred while trading cryptocurrencies. Conduct your own research by contacting financial experts before making any investment decisions. We believe that all content is accurate as of the date of publication, but certain offers mentioned may no longer be available.
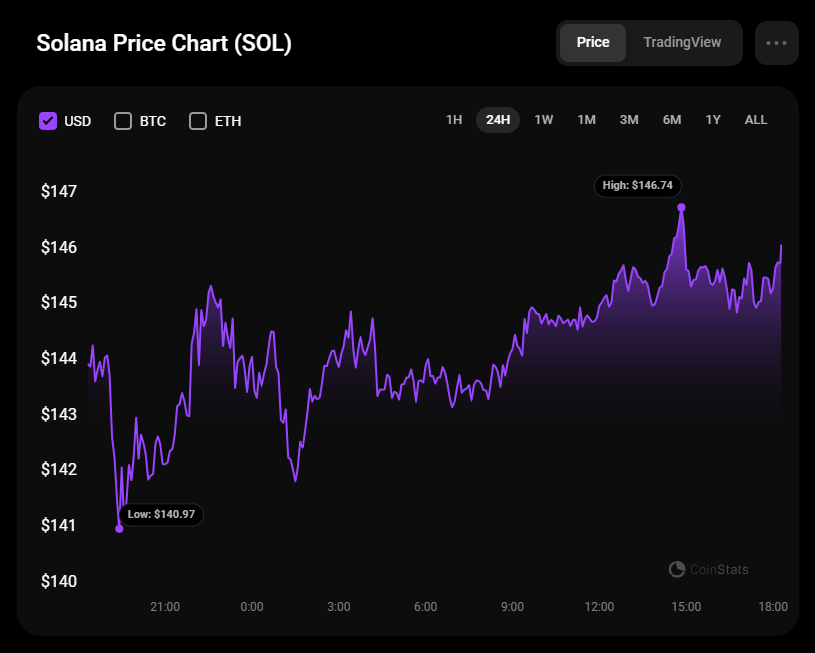
The price of Solana (SOL) has gone up by 1.78% since yesterday.
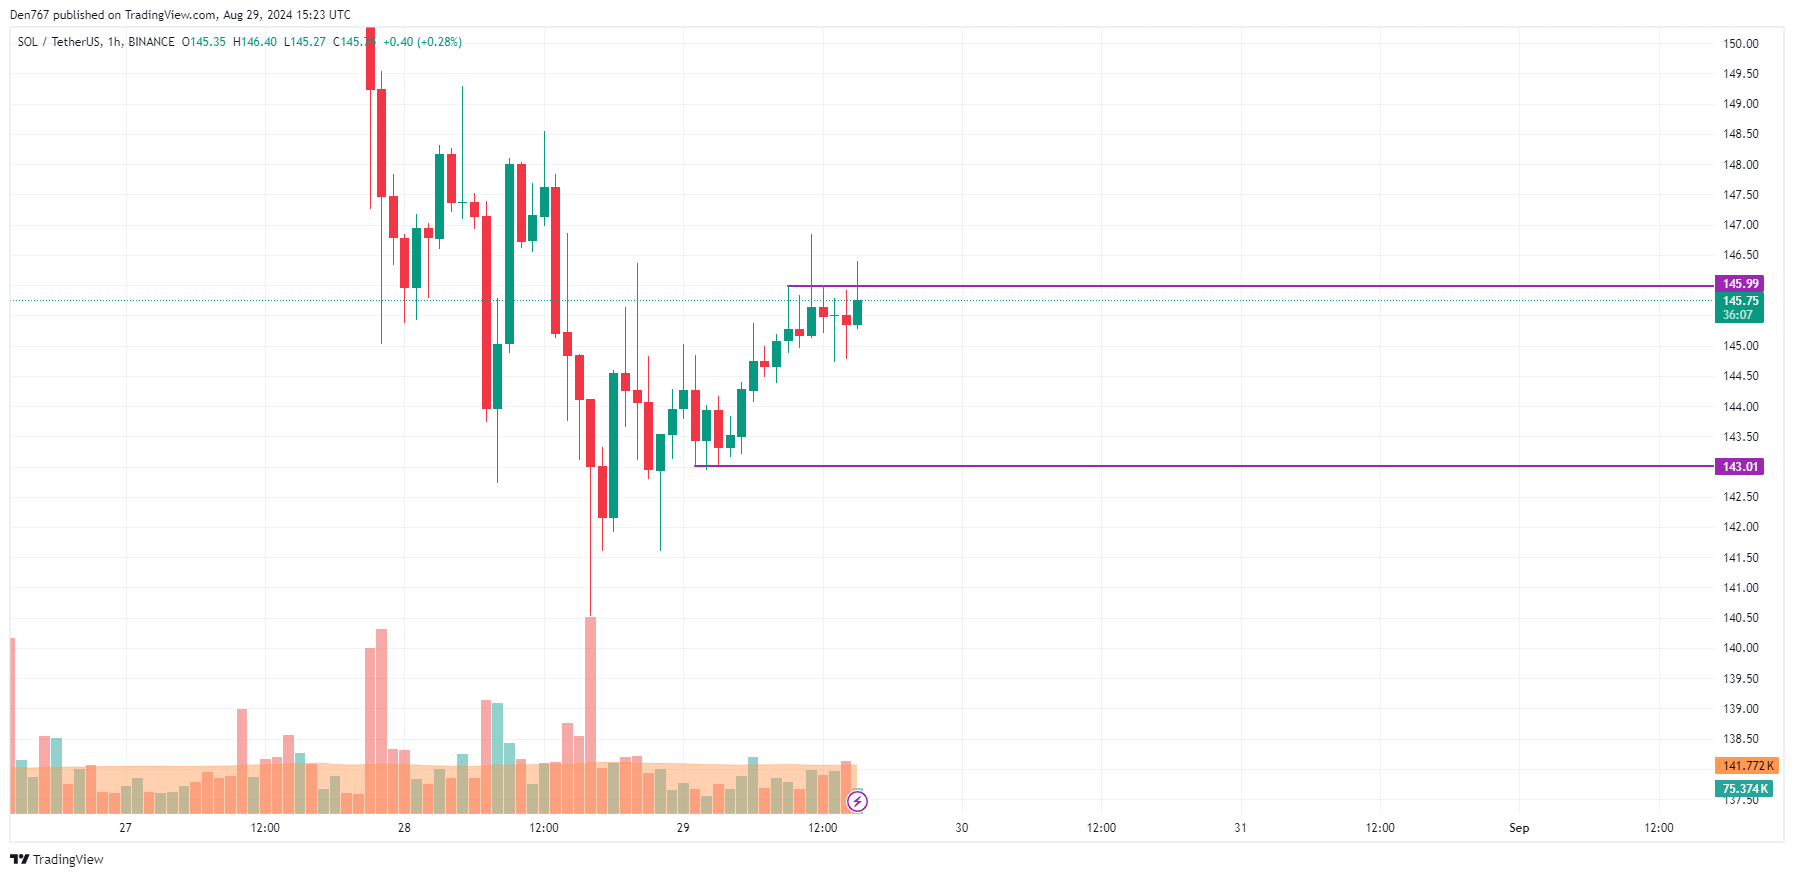
On the hourly chart, the rate of SOL is trading near the resistance of $145.99. If its breakout happens, there is a chance to see a test of the $150 zone shortly.
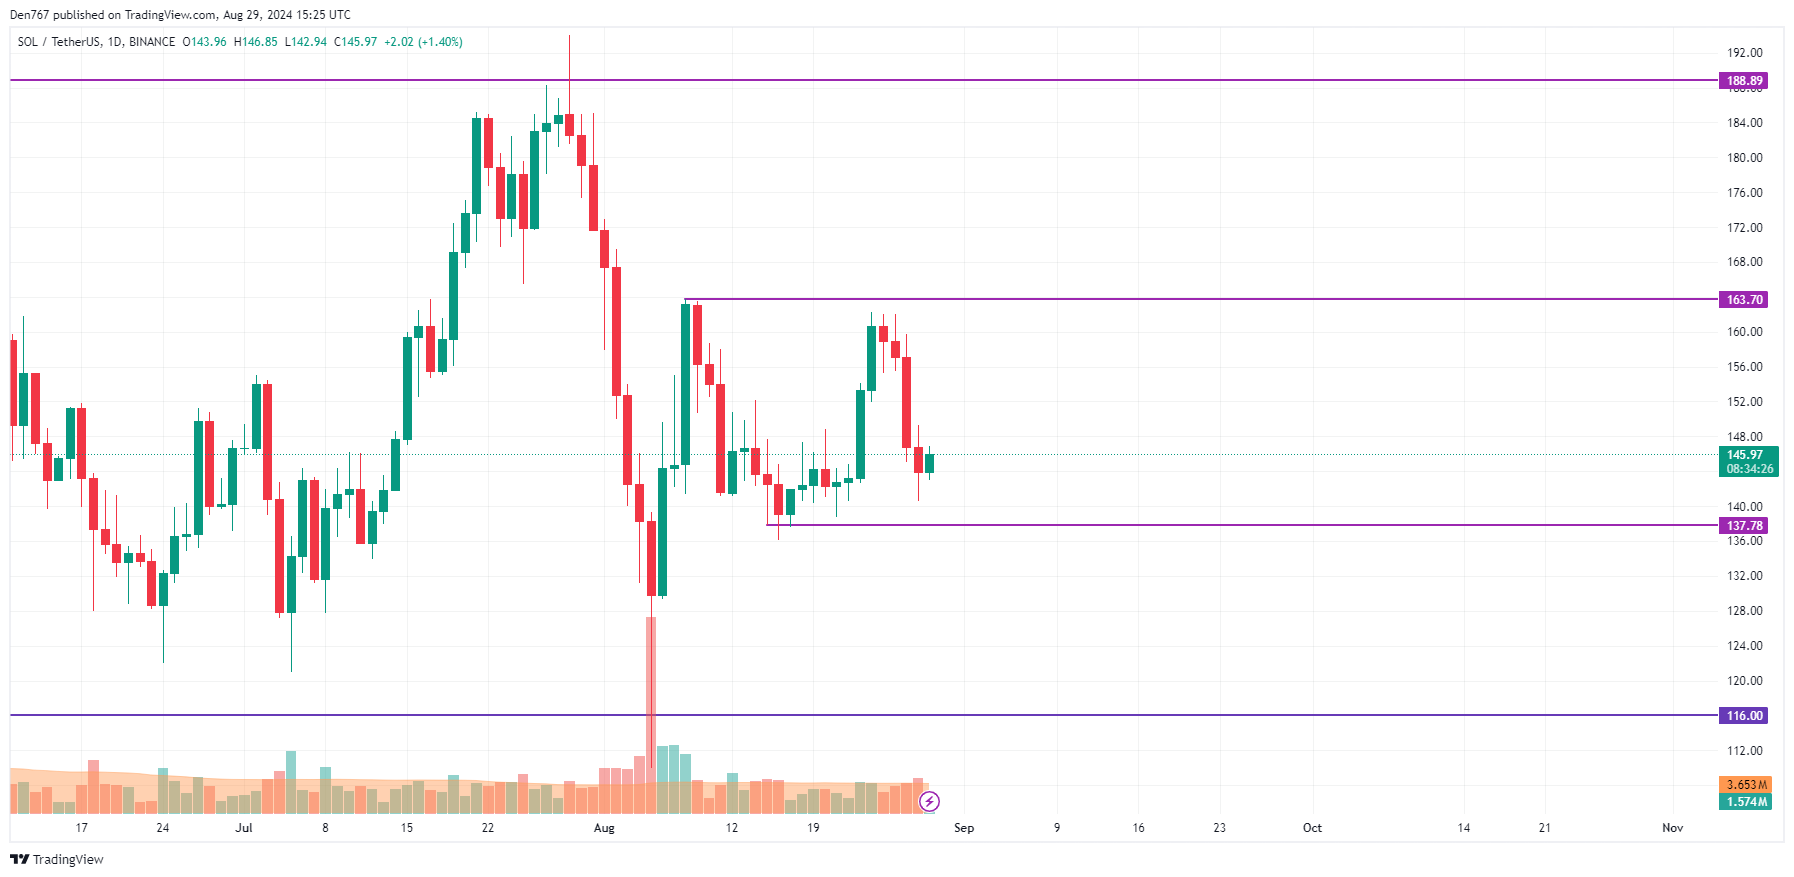
On the daily time frame, the price is trading within yesterday’s bar, which means neither bears nor bulls are dominating. In this case, sideways trading in the narrow range of $145-$150 is the more likely scenario until the end of the week.
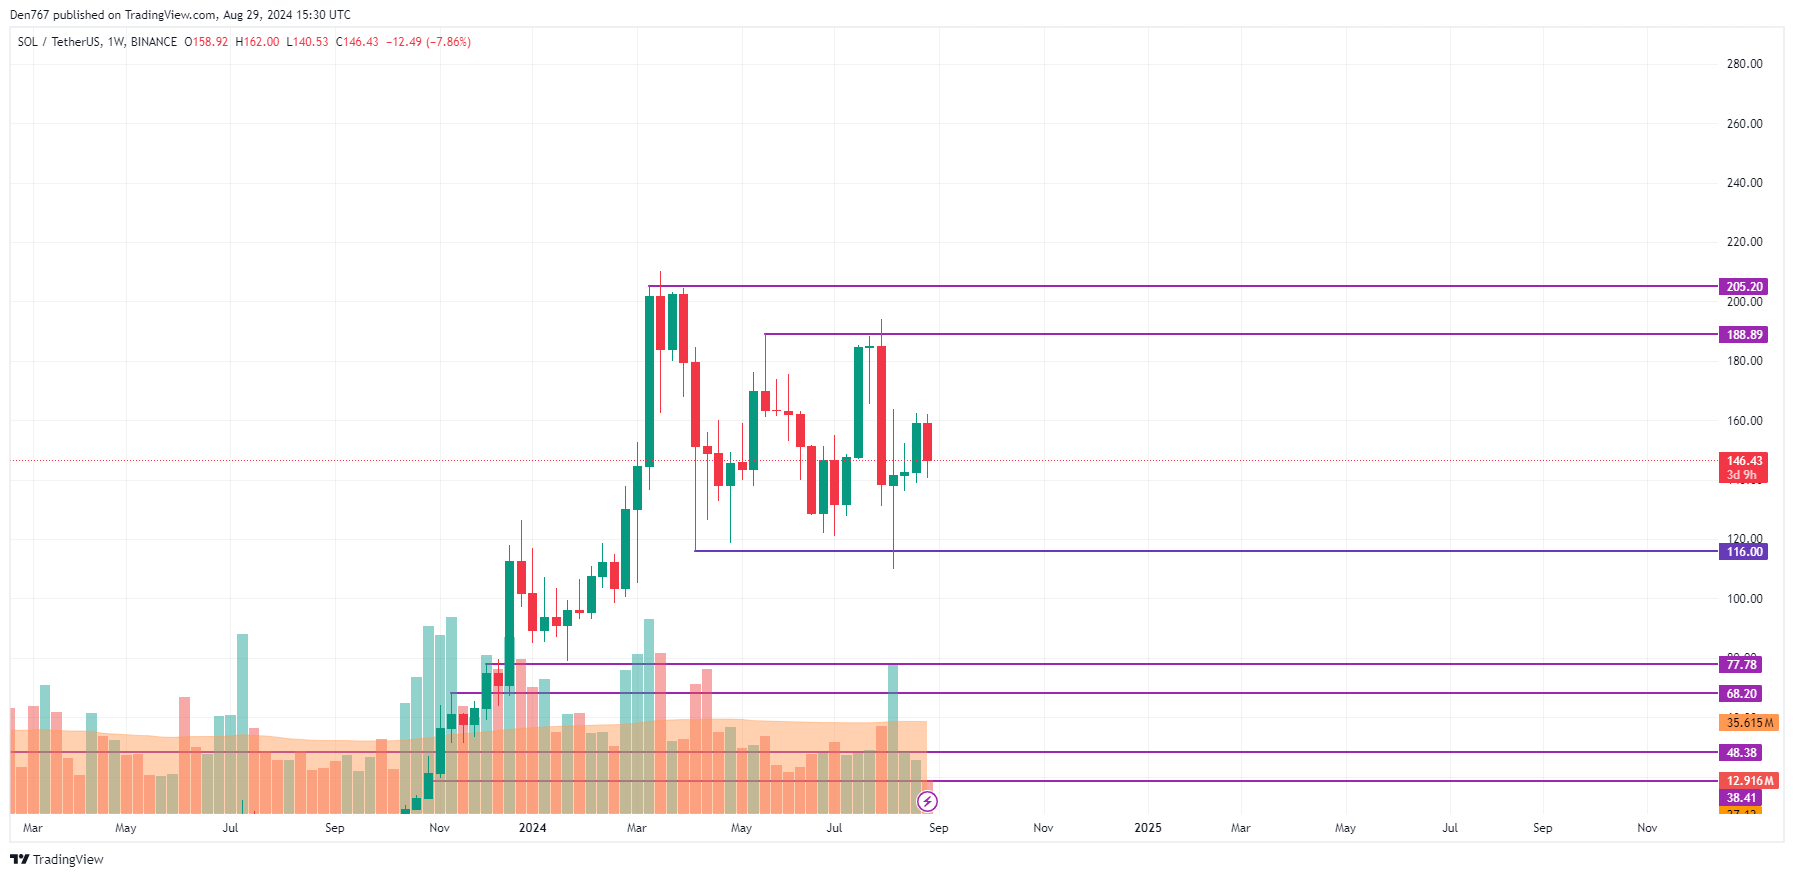
From the midterm point of view, buyers have failed to keep the growth. If the current weekly bar closes below $138, sellers may again seize the initiative, which might lead to a correction to the $130 mark.
SOL is trading at $146.60 at press time.
Polygon (MATIC) has taken a massive hit today, emerging among the top losers, second only to Maker (MKR). In just one day, the price of MATIC dropped over 11%.
This sudden downturn comes amid the ongoing MATIC to POL upgrade, where all MATIC on Polygon POS and those staked on Ethereum will be automatically converted to POL tokens by September 4.
🧵 POL Upgrade | Everything to Know 🧵
Users w/ MATIC on Ethereum can upgrade today via Polygon Portal Interface: https://t.co/Ibs1ONels1
There is no deadline for users to upgrade. All MATIC on Polygon PoS & staked MATIC on Ethereum will upgrade automatically on Sept 4. pic.twitter.com/qKnyYFrlqH
— Polygon | Aggregated (@0xPolygon) August 27, 2024
MATIC is trading around $0.44, down over 11% in the past 24 hours. Over the past month, the asset has declined 13.70%.
The question remains: Will MATIC recover soon, or will the downturn continue? Let’s explore the technical charts and analysts’ opinions for hints about its next possible move.

The MATIC/USDT 4-hour chart is bearish, with MATIC dropping below the 50-day and 200-day Simple Moving Averages (SMAs). This suggests that sellers are in control and might make it harder for MATIC to climb back up soon.
Also, the MACD line is below its signal line and displays red bars, showing the significant downward pressure. In addition, the Bollinger Bands also paint a bearish picture. MATIC’s price is around the lower band, suggesting that sellers are still in charge.
In a few hours, the PVT has dropped from 4.3 million to 3.6 million. This big drop suggests that both volume and price are falling together, another sign that sellers are dominant.

Given all these signals, traders might want to exercise caution, and waiting could be a better approach.
To turn things around, MATIC must find strong support around $0.38 or $0.35 (potential retracement levels). If buyers step in at these levels, we might see the price increase again. However, a drop below these points could signal further downturns
Despite this bearish outlook, some analysts are still optimistic. They think MATIC could surge soon. While the current signs point down, MATIC’s fortunes could turn around if market sentiment shifts.
On August 20, crypto analyst World of Charts said Polygon has broken out of a six-month descending trendline. A descending channel usually signals a downward trend. However, if MATIC breaks out of this channel, it could suggest a potential upward reversal.
$Matic#Matic Testing Crucial Area Breakout Can Lead Massive Recovery In Towards 1$ In Coming Days https://t.co/OBmVBDLeFh pic.twitter.com/bpMsLrIe4t
— World Of Charts (@WorldOfCharts1) August 21, 2024
Based on the chart, the price broke above this trendline on August 20. Therefore, the analyst predicts MATIC could reach $1, a potential 143% increase from its breakout point of $0.44.
This breakout is significant as it shows a shift in market sentiment and could set a new upward path for the coin. Also, if MATIC can hold above its support levels ($0.35 -$0.38), this breakout could fuel its recovery.
It might attract more buyers, potentially pushing the price higher. However, while MATIC’s future remains speculative, a new alternative, Crypto All-Stars, is gaining traction.
Crypto All-Stars is shaking up the memecoin world with its new staking platform, MemeVault. This platform lets you stake various meme coins and earn $STARS tokens as rewards.
This innovative system is attracting considerable attention, and some experts think Crypto All-Stars could grow ten times its current value. Already, the presale has raised over $800,000, and it is only a few inches from hitting the $1 million milestone.
Crypto All-Stars is introducing the one-stop avenue for meme coin staking, unifying investment in popular coins like Dogecoin, Shiba Inu, and Pepe. Users can now earn money from their coins without selling them.
MemeVault uses a novel technology called ERC-1155, which enables it to work with memecoins from any blockchain. To use MemeVault, you need to hold $STARS tokens. The more $STARS you have, the more returns you earn.
Currently, $STARS is in its presale phase and trades at $0.0014078 per token. Early buyers can start staking their tokens immediately.
The current staking rewards are pretty high; early investors can earn up to 1,763% in rewards. But this rate will likely decrease as more people join, so getting in early could be smart. You can buy $STARS tokens using Ethereum (ETH), USDT, or a bank card.
The project has solid tokenomics, allocating 20% for the presale, 25% for staking rewards, 10% for exchange liquidity, and 20% for marketing. The last 25% is saved for future growth.
Crypto All-Stars has attracted the attention of top crypto pundits. Popular YouTuber Umar Khan predicted the project surge 100X when launched.
Crypto All-Stars looks set for big moves in the market. Its unique staking system could be the game changer, making a potential viral memecoin in 2024.
While coins like MATIC face challenges, Crypto All-Stars offers a fresh opportunity. It’s MemeVault that could change how people use meme coins.
Check out the official X page and Telegram channel to learn more. You can also visit their website to join the presale.
Remember, like all crypto investments, Crypto All-Stars might have its own risks. Investors should always conduct due diligence before investing.


 Price Prediction 2024 2025 2026 2030 – 2040")


✓ Share: