The main tag of cryptocurrency price today Articles.
You can use the search box below to find what you need.
[wd_asp id=1]
The main tag of cryptocurrency price today Articles.
You can use the search box below to find what you need.
[wd_asp id=1]
While Dogecoin is an old crypto player, DogWifHat is relatively recent and has quickly amassed a greater fortune and fan following.
Here’s how September will fare for Dogecoin (Doge) and Dogwifhat tokens (WIF).
Also Read: Ripple: 15 Panelists Predict Bullish Peak Of XRP To $2: Here’s When
 and Dogwifhat (WIF)Price Prediction For September 2024")

Dogecoin is one of the OG crypto tokens that has given a new name to the world of meme coins. The token is notably one of the best meme coins to trade in, but it has lately been showing a bearish stance, perplexing its customers to an extent.
Despite DOGE’s massive fan following, the token has not adopted a credible price pace and has lately been trending at lower price levels and thresholds.
According to CoinCodex, DOGE is on the verge of trading further below $0.084 this September. CC predicts that DOGE may shed an additional 13% to trade at a new low threshold of $0.084.
The fear and greed index on the platform also points towards the fear sentiment, outlining the general sentiment of the investors towards DOGE.
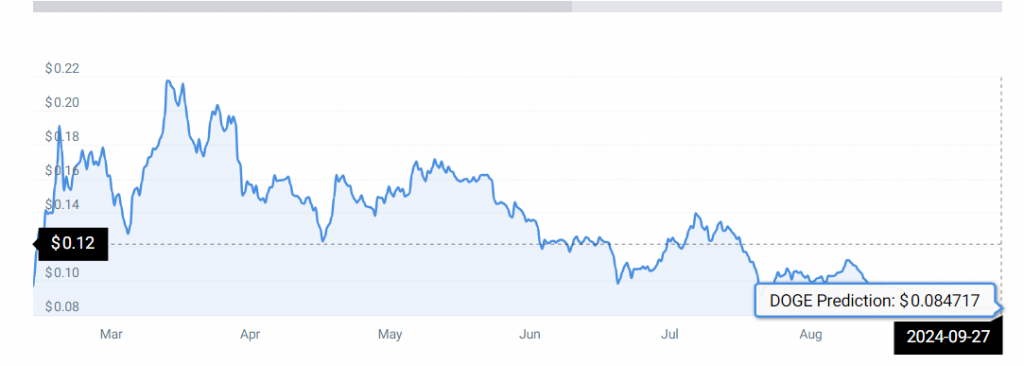
“According to our current Dogecoin price prediction, the price of Dogecoin is predicted to drop by -13.83% and reach $0.084717 by September 27, 2024. Per our technical indicators, the current sentiment is bearish while the Fear & Greed Index is showing 30 (fear). Dogecoin recorded 9/30 (30%) green days with 8.20% price volatility over the last 30 days.”
Also Read: Solana: Will SOL Reach $200 in September?

DogWifHat is currently one of the most trending crypto tokens. WIF has constantly been improving its game by adapting its ecosystem to the latest Web3 trends.
The WIF ecosystem is now ready to explore new avenues, including experimenting with NFTs to secure a new user base. At press time, WIF is $1.56, down 12% in the last 24 hours.
According to CoinCodex, September may usher in a new price high for WIF. The platform adds that the token may surge nearly 200% to peak at a new ATH of $5.
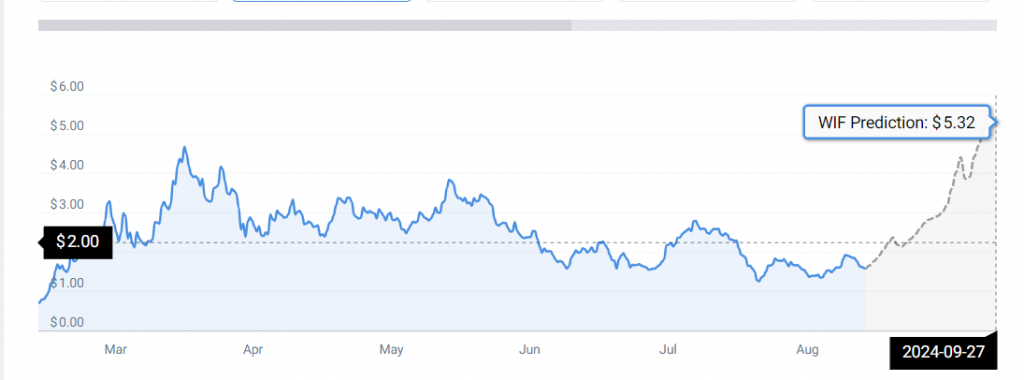
“According to our current Dogwifhat price prediction, the price of Dogwifhat is predicted to rise by 227.00% and reach $5.32 by September 27, 2024. Per our technical indicators, the current sentiment is bearish while the Fear & Greed Index is showing 48 (neutral). Dogwifhat recorded 11/30 (37%) green days with 17.64% price volatility over the last 30 days.”
Also Read: Cryptocurrency: 3 Trending Coins To Buy Under $2 For Bullish Returns
Cardano price slipped below a major resistance zone, and traders immediately began opening Shorts, anticipating lower prices. Meanwhile, the Binance exchange confirmed its readiness for the Chang hard fork, which was pushed forward to allow more exchanges to prepare. ADA price dropped 1.1% over the last 24 hours to trade at $0.3637.
Cardano saw a spike in whale transaction count on August 27. Santiment recorded 89 transactions of over $100,000 each, signaling a significant increase in whale activity. This is the largest spike since August 2, and it happened while the price of Cardano was dropping, signaling that whales might be accumulating ADA.

Additionally, according to data from IntoTheBlock, the Cardano daily active addresses (DAA) increased by 16.91% over the last 24 hours. This increase brought the total number of addresses to 23,523 DAA. Combined with the spike in whale transactions, this could mean new whales are entering the ADA fold, impacting the Cardano price.
On the other hand, Cardano volume continues to dwindle despite an immensely successful demo of the Hydra DOOM at the RareEvo Blockchain event in Las Vegas.
According to Messari Research data, Cardano transaction volume has been dropping since the March mini-bull run high. The ADA volume hit $5.29 billion on August 27, the second lowest recorded volume this year after August 12.

Even though DAA increased over the last day, they have drastically reduced YTD. At the height of the March bull run, Cardano had 71,223 active addresses. However, that number has dropped by over 66%, which corresponds with the dropping transaction volume.
Cardano shows a potential reversal to the downside after failing to sustain the recent bullish momentum. The price dropped below the 50-day exponential moving average (EMA), indicating bearish pressure might be taking over.
The MACD line is above the signal line but appears to be converging. The histogram is losing its positive momentum, indicating a potential bearish crossover. This suggests weakening bullish momentum and the possibility of a further downward move.

Cardano price may find support around $0.30 as this price level has previously acted as a strong support level and is likely to be a key area of interest if the price continues to drop. If bulls take over and stage a rally, ADA price may experience resistance around $0.3747, which now acts as immediate resistance. A sustained break above this level could signal a shift in momentum back to bullish.
Overall, the Cardano price is still bearish despite positive fundamental developments. Futures traders are opening shorts, which may contribute to the drop. However, the increase in whale activity and daily active addresses suggests they are accumulating, signaling the drop may be short-lived.
The Chang hard fork is an upcoming upgrade to the Cardano network. Binance has confirmed its readiness to support the hard fork, which was delayed to allow more exchanges to prepare.
A spike in whale transactions suggests significant buying activity from large holders.
While the price trend is currently bearish, the increase in whale activity and daily active addresses could signal accumulation, suggesting the downward trend might be short-lived.
Related Articles
Evans Karanja
Evans Karanja is a content writer and scriptwriter with a focus on crypto, blockchain, and video gaming. He has worked with various startups in the past, helping them create engaging and high-quality content that captures the essence of their brand. Evans is also an avid crypto trader and investor, and he believes that blockchain will revolutionize many industries in the years to come. When he is not writing, you can find him playing video games or chasing waterfalls.
Disclaimer: The presented content may include the personal opinion of the author and is subject to market condition. Do your market research before investing in cryptocurrencies. The author or the publication does not hold any responsibility for your personal financial loss.
These experts expressed varying perspectives on XRP’s price for 2024 to the end of the decade. On average, they expect XRP to end 2024 below $1. Meanwhile, some have projected a 1,031% increase for XRP in the longer term.
Sathvik Vishwanath, CEO of Unocoin Technologies, stood out as the most optimistic panel member. According to his prediction, XRP is expected to reach $1.50 by year-end. Considering that XRP is worth $0.5705 today, this outlook represents a substantial 162% return on investment.
According to Sathvik Vishwanath, the driving force behind his bullish prediction for XRP is its distinct value proposition in the financial industry, particularly its emphasis on facilitating cross-border payments, and Ripple’s strategic partnerships with prominent financial institutions.
However, Vishwanath also cautioned that XRP’s growth potential is tempered by regulatory uncertainties that could significantly impact its long-term valuation. It is worth noting that the lawsuit surrounding XRP ended this month.
Mitesh Shah, founder of Omnia Markets, also shares an optimistic outlook for XRP in 2024. He believes the cryptocurrency will reach $0.75 by year-end, representing a 31% increase from its current price.
According to Shah, this forecast is based on three primary drivers expected to positively influence XRP’s price trajectory. They include short-term momentum from Ripple’s positive developments, regulatory clarity, and support from the current bull market.
Market researcher Shubham Munde has the most optimistic long-term view on XRP, predicting that the cryptocurrency will soar to $6.45 by 2030.
Munde attributes this bullish forecast to XRP’s relatively low entry point compared to other top cryptocurrencies, making it an attractive option for new investors. Additionally, Munde highlights XRP’s utility in the payment market as a key factor driving its growth potential.
Brighton University senior lecturer Paul Levy echoes Munde’s perspective on XRP’s long-term prospects. He forecasts that the cryptocurrency will reach $6.10 by 2030. Levy’s optimism is fueled by his expectation that XRP’s price will significantly benefit from the Bitcoin halving.
With XRP trading at $0.57 today, a $6.45 target by 2030 amounts to over 1,031% growth.
Disclaimer: This content is informational and should not be considered financial advice. The views expressed in this article may include the author’s personal opinions and do not reflect The Crypto Basic’s opinion. Readers are encouraged to do thorough research before making any investment decisions. The Crypto Basic is not responsible for any financial losses.
Investors weren’t too hopeful about the meme coin, either. Coinglass data reported that there were more longs than shorts, suggesting that investors were more bearish than bullish about DOGE.
Also Read: Shiba Inu: Here’s How To Be A Millionaire When SHIB Hits 5 Cents

It appears that some investors were pleased with this decline. Santiment data showed that whales that possess Dogecoin had boosted their holdings of DOGE. According to the data, the biggest Dogecoin holders made a considerable accumulation after the August 5 downfall.
The proportion of DOGE owned by these big wallets peaked on August 7. Furthermore, this indicates a calculated action to take advantage of the declining prices of the meme coin.
Also Read: Earn $73K in a Day: Replicate This Investor’s Meme Coin Strategy!
Dogecoin will dismiss its bearish notion throughout the coming month. The asset will see a slight increase in the next couple of days. In fact, the meme coin will end the month of August at a high of $0.108930. But following a slight correction, the cryptocurrency will trade around $.0.107004 on September 1, 2024.
Considering this dainty rise, DOGE is still far from its all-time high of $0.7376, which was attained about three years ago in 2021.
Also Read: Top 3 Cryptocurrencies To Watch In September That Are Under $1
To be precise the OG meme cryptocurrency is 85% below this peak. While September seems slightly bullish, Dogecoin has quite some work to do before climbing to the top.
XRP price stands tall among crypto prices during the US trading session on Tuesday. Unlike Bitcoin (BTC) and Ethereum (ETH), which suffered a 2.6% and 4.5% setback amid increasing market uncertainty, Ripple’s XRP is up 1.7% to $0.5973.

XRP price is gearing up for a major inverse head and shoulder (H&S) breakout. This 21.6% bullish thesis follows a minor correction from last week’s move to $0.63. Bulls embraced the 20-day Exponential Moving Average (EMA) support at $0.5863.
The pattern formed when XRP price established three relative troughs, with the middle trough (the head) being lower than the outer two (the shoulders). A neckline (dotted) connects the highs of the shoulders. Note that a breakout above the neckline signals a potential 21.6% bullish reversal to $0.74. Traders can profit by entering long positions after the breakout with stop losses below the same neckline.

The bullish outlook in XRP will cease to exist should the 20-day support fail to hold, resulting in another retracement toward the 20-day and the 200-day EMAs, respectively.
XRP is up due to growing interest in the token among the whales, Santiment data shows.
XRP price awaits a bullish inverse H&S pattern breakout likely to push it to $0.74.
Traders should pay attention to the 50-day and 200-day EMAs support area at $0.567 and $5487.
John Isige
John is a seasoned crypto expert, renowned for his in-depth analysis and accurate price predictions in the digital asset market. As the Price Prediction Editor for Market Content at CoinGape Media, he is dedicated to delivering valuable insights on price trends and market forecasts. With his extensive experience in the crypto sphere, John has honed his skills in understanding on-chain data analytics, Non-Fungible Tokens (NFTs), Decentralized Finance (DeFi), Centralized Finance (CeFi), and the dynamic metaverse landscape. Through his steadfast reporting, John keeps his audience informed and equipped to navigate the ever-changing crypto market.
Disclaimer: The presented content may include the personal opinion of the author and is subject to market condition. Do your market research before investing in cryptocurrencies. The author or the publication does not hold any responsibility for your personal financial loss.
Disclaimer: The opinions expressed by our writers are their own and do not represent the views of U.Today. The financial and market information provided on U.Today is intended for informational purposes only. U.Today is not liable for any financial losses incurred while trading cryptocurrencies. Conduct your own research by contacting financial experts before making any investment decisions. We believe that all content is accurate as of the date of publication, but certain offers mentioned may no longer be available.
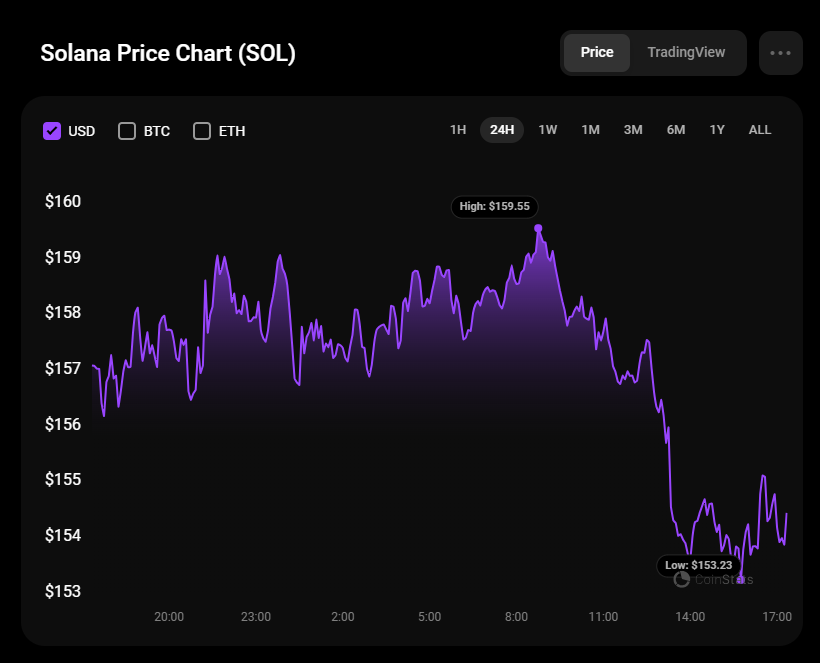
The price of Solana (SOL) has declined by 3.19% since yesterday.
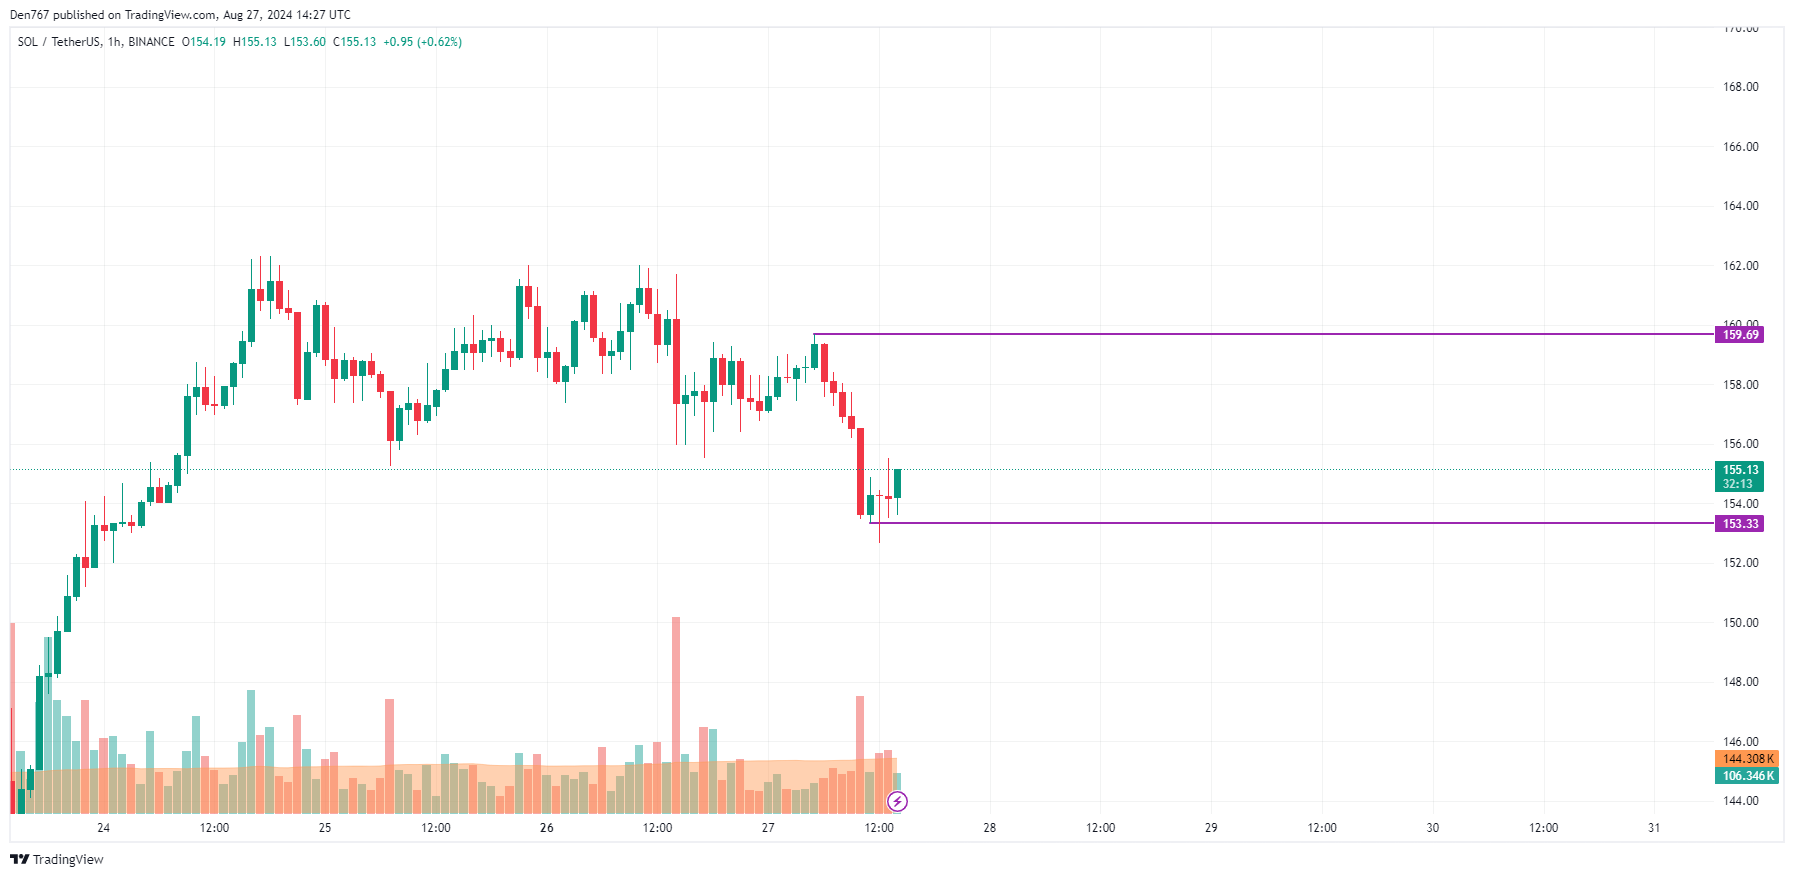
On the hourly chart, the rate of SOL might have found a local support level of $153.33. If the daily candle closes far from it, there is a chance to see a bounce back to the $158-$160 zone by tomorrow.
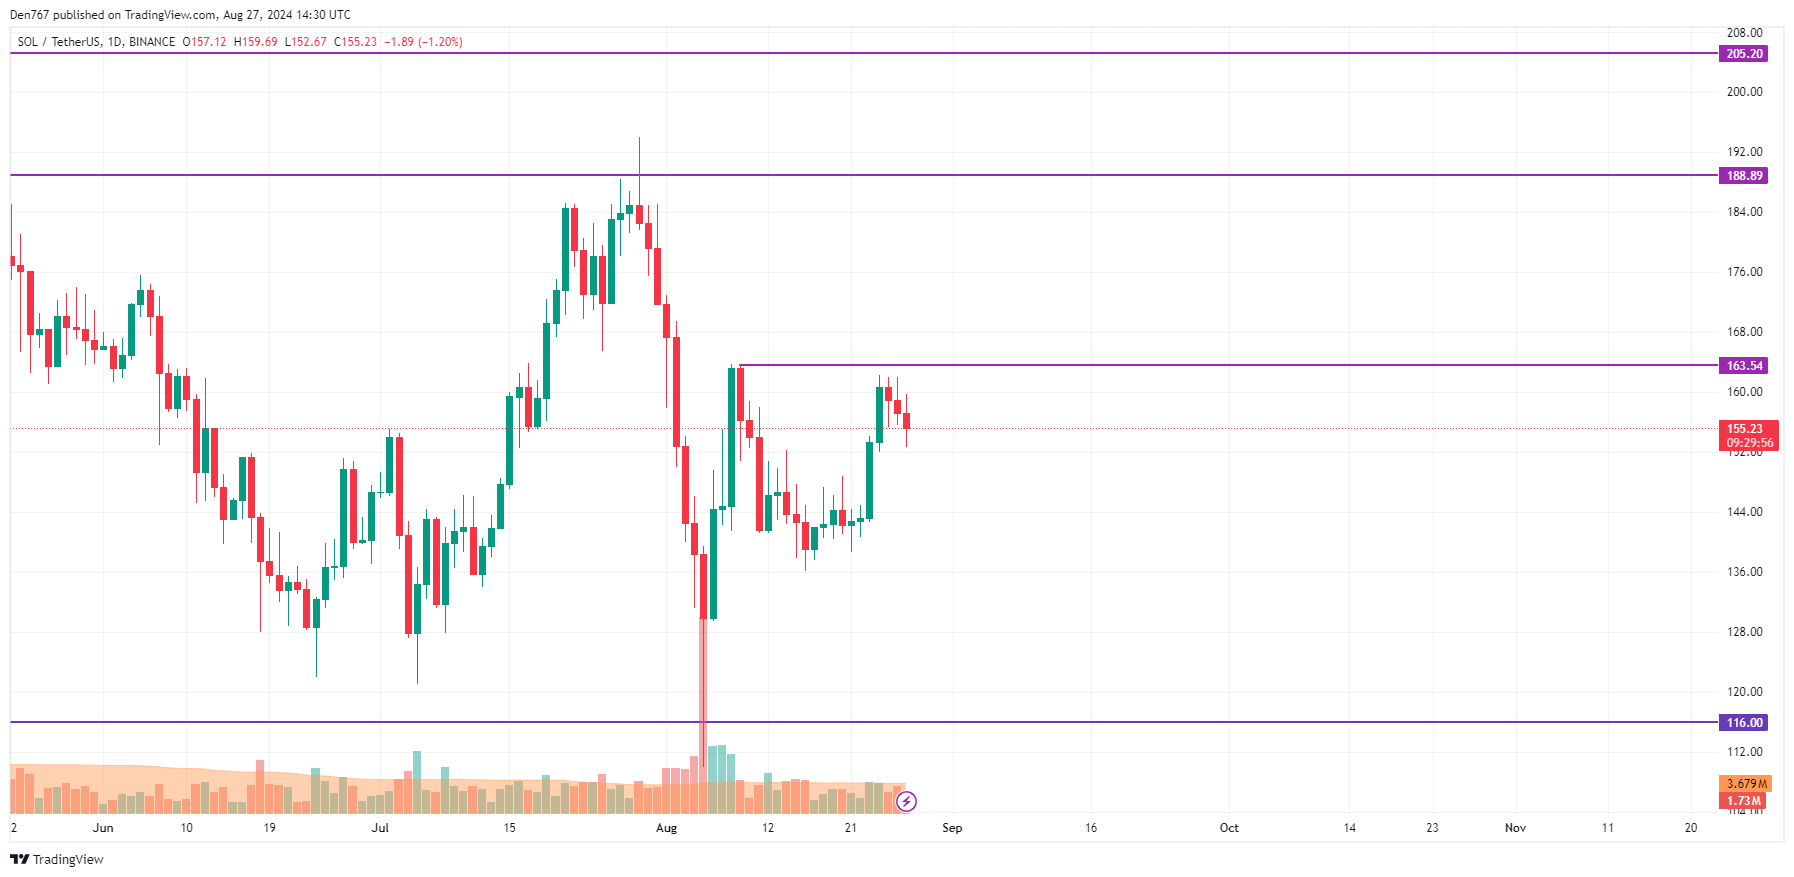
On the bigger time frame, the picture is less clear. If the daily bar closes far from its low, a further drop can be posponed. In this case, sideways trading in the range around $160 is the more likely scenario.
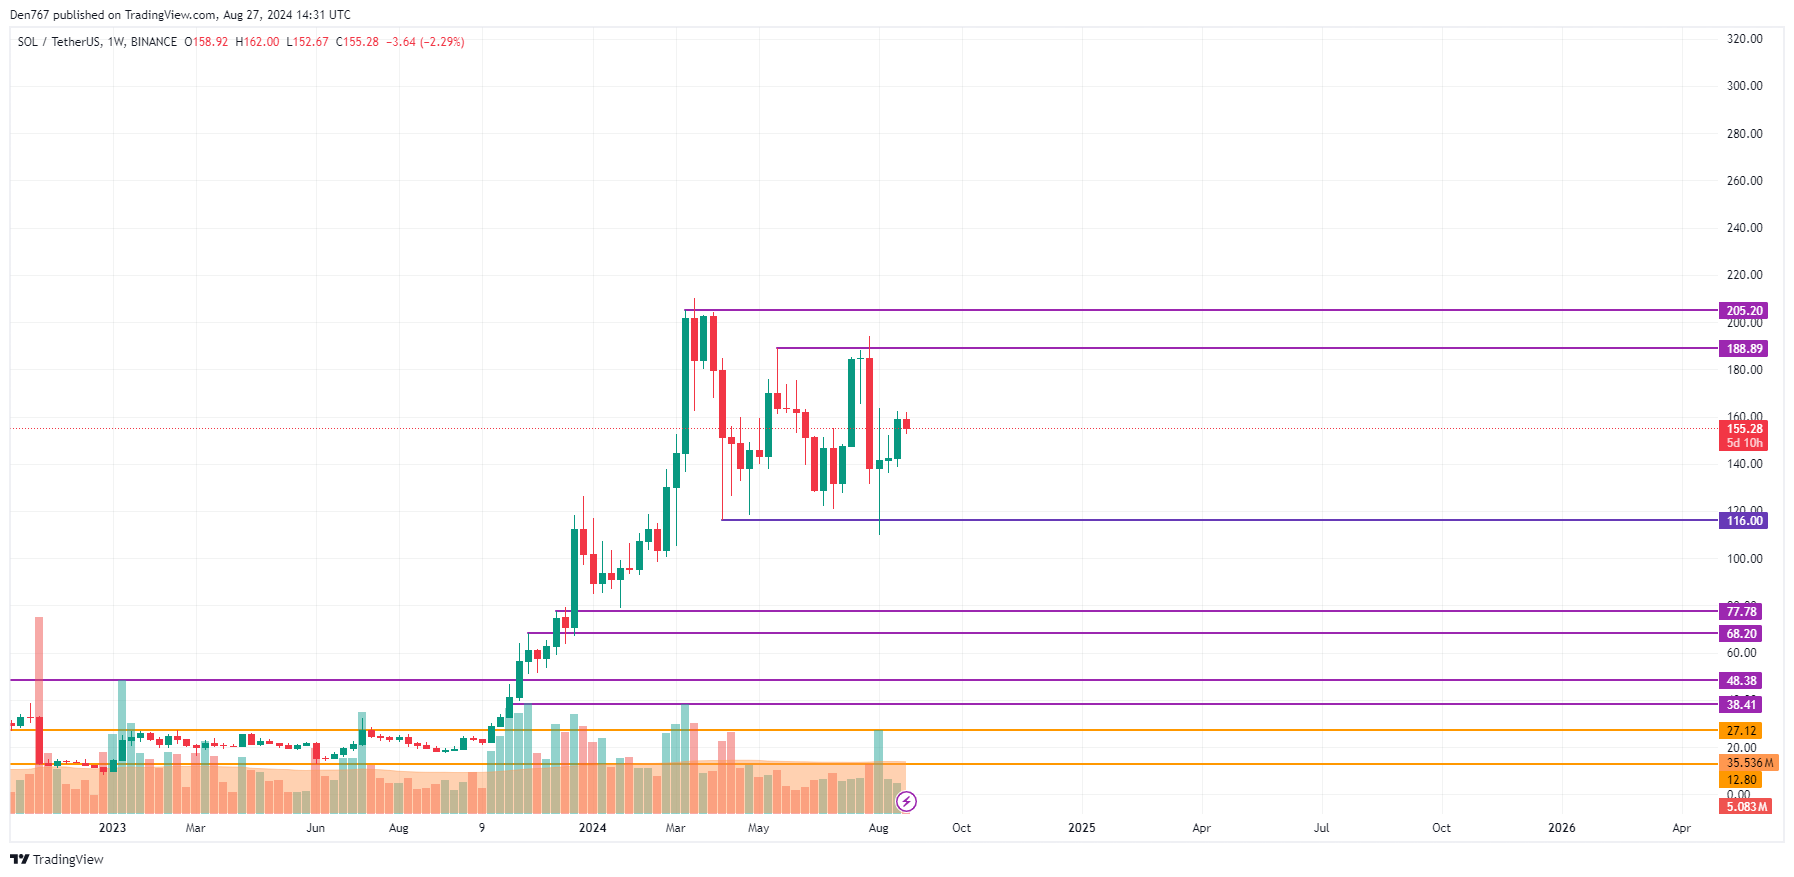
From the midterm point of view, the price of SOL is in the middle of a wide channel, between the support of $116 and the resistance of $188.89.
Related

As none of the sides is dominating, one can expect ongoing consolidation in the area of $140-$160.
SOL is trading at $155.79 at press time.
August began with Bitcoin’s price plummeting to a three-month low of $49,111 on August 5, triggering over $500 million in liquidations across crypto markets. However, as the month progressed, the market sentiment shifted. By the second half of August, major cryptocurrencies like Bitcoin, Ethereum, and XRP recorded double-digit gains.
 | TradingView - The Crypto Basic")
The Bitcoin Price Analysis chart highlights how bullish traders gained control of BTC markets in late August. Bitcoin’s price surged by 15.8% within ten days, from $56,150 on August 15 to nearly $65,000 on August 25. Although bears managed to stall the rally, preventing a breakout above $65,000, Bitcoin retraced to $62,000 on August 27, marking a 5% decline from its recent peak.
Yet, beyond this short-term price movement, on-chain data trends indicate that Bitcoin might be poised for continued growth, making the recent correction appear temporary.
In the past 30 days, Bitcoin traders have increasingly opted to move their assets into long-term storage. This shift likely anticipates long-term gains, especially with the U.S. Fed’s potential rate cut in September 2024.
The Bitcoin Exchange Reserves metric, which measures the total BTC held on exchanges, has dropped from 2,759,823 BTC on July 25 to 2,677,614 BTC by August 25.

This represents a transfer of 82,209 BTC—valued at approximately $5 billion at current prices—into cold storage.
This significant decline in exchange reserves suggests that a large number of investors are withdrawing Bitcoin from short-term market circulation, potentially reducing selling pressure. Historically, such declines in exchange reserves have preceded bullish trends in Bitcoin’s price as investors prepare for long-term gains.
This trend could indicate that rather than liquidating their holdings, investors are preparing for a potential surge in BTC price, particularly if the Fed moves forward with the anticipated rate cut.
Given the current technical indicators, Bitcoin’s price could soon test the $70,000 mark. The BTCUSD Price Analysis chart below shows the price nearing the upper band of the Keltner Channel, a bullish signal that typically suggests further upward movement.
The recent price activity suggests that $66,000 serves as the next critical resistance level.

Should Bitcoin break through this level, $70,000 could quickly become the new target. On the downside, the $61,000 level is crucial support and, if breached, could lead to a retest of the $56,000 range.
With on-chain data supporting a bullish narrative and technical indicators pointing toward continued upward momentum, Bitcoin appears well-positioned to break new ground as we move into September. Investors should keep a close eye on the $66,000 resistance level, as its breach could signal the start of a new bullish phase, potentially pushing Bitcoin toward the coveted $70,000 mark.
Disclaimer: This content is informational and should not be considered financial advice. The views expressed in this article may include the author’s personal opinions and do not reflect The Crypto Basic’s opinion. Readers are encouraged to do thorough research before making any investment decisions. The Crypto Basic is not responsible for any financial losses.
Disclaimer: The opinions expressed by our writers are their own and do not represent the views of U.Today. The financial and market information provided on U.Today is intended for informational purposes only. U.Today is not liable for any financial losses incurred while trading cryptocurrencies. Conduct your own research by contacting financial experts before making any investment decisions. We believe that all content is accurate as of the date of publication, but certain offers mentioned may no longer be available.
The rate of DOGE has dropped by 3.11% over the past day.
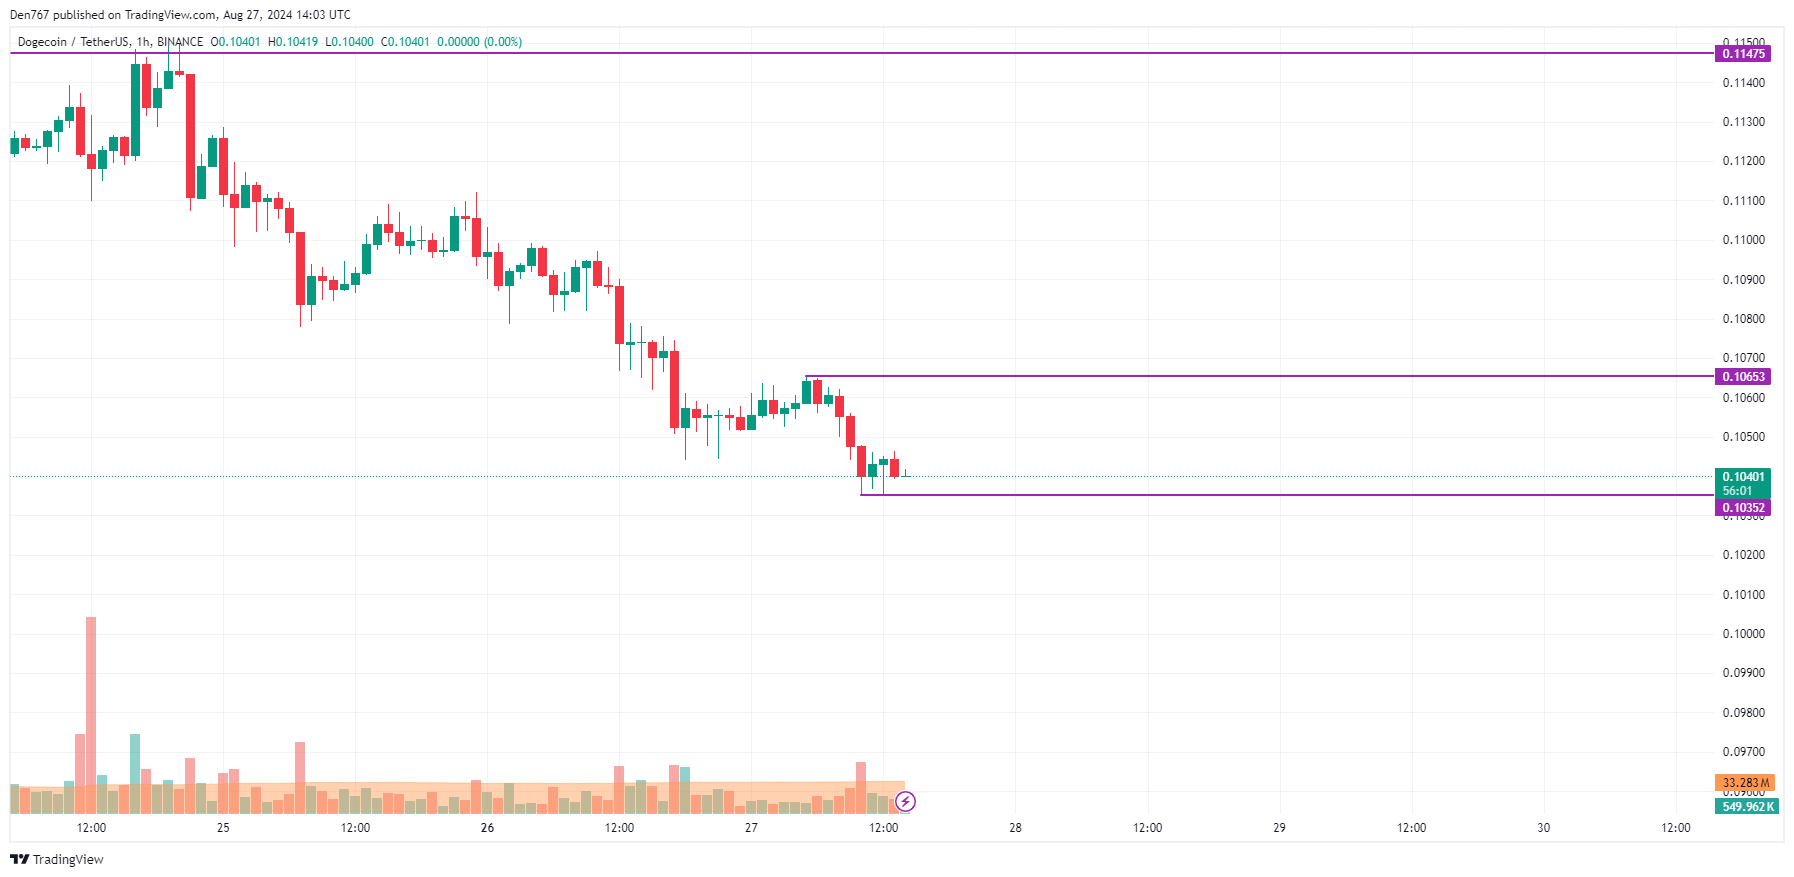
Despite today’s fall, there are no reversal signals yet. The price of DOGE is coming back to the local support level of $0.1035.
If it breaks out, the correction may continue to the $0.1010-$0.1020 zone soon.
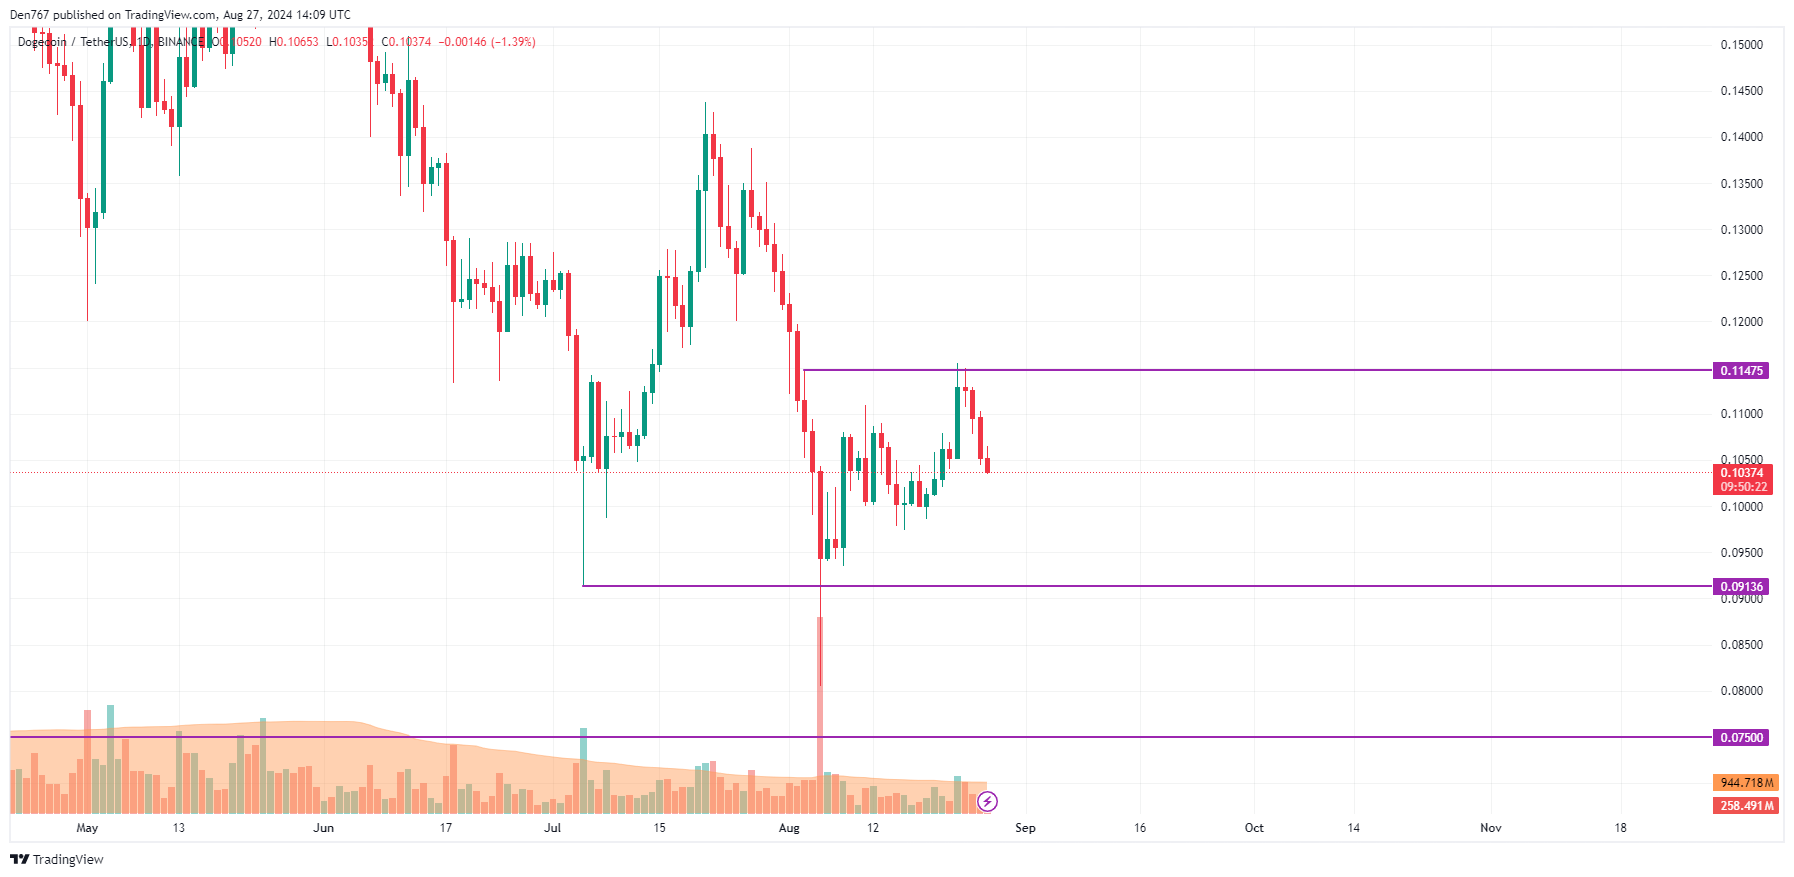
A bearish picture can also be seen on the daily time frame. If the candle closes around the current prices or below, there is a chance to see a test of the vital area of $0.10 within the next few days.
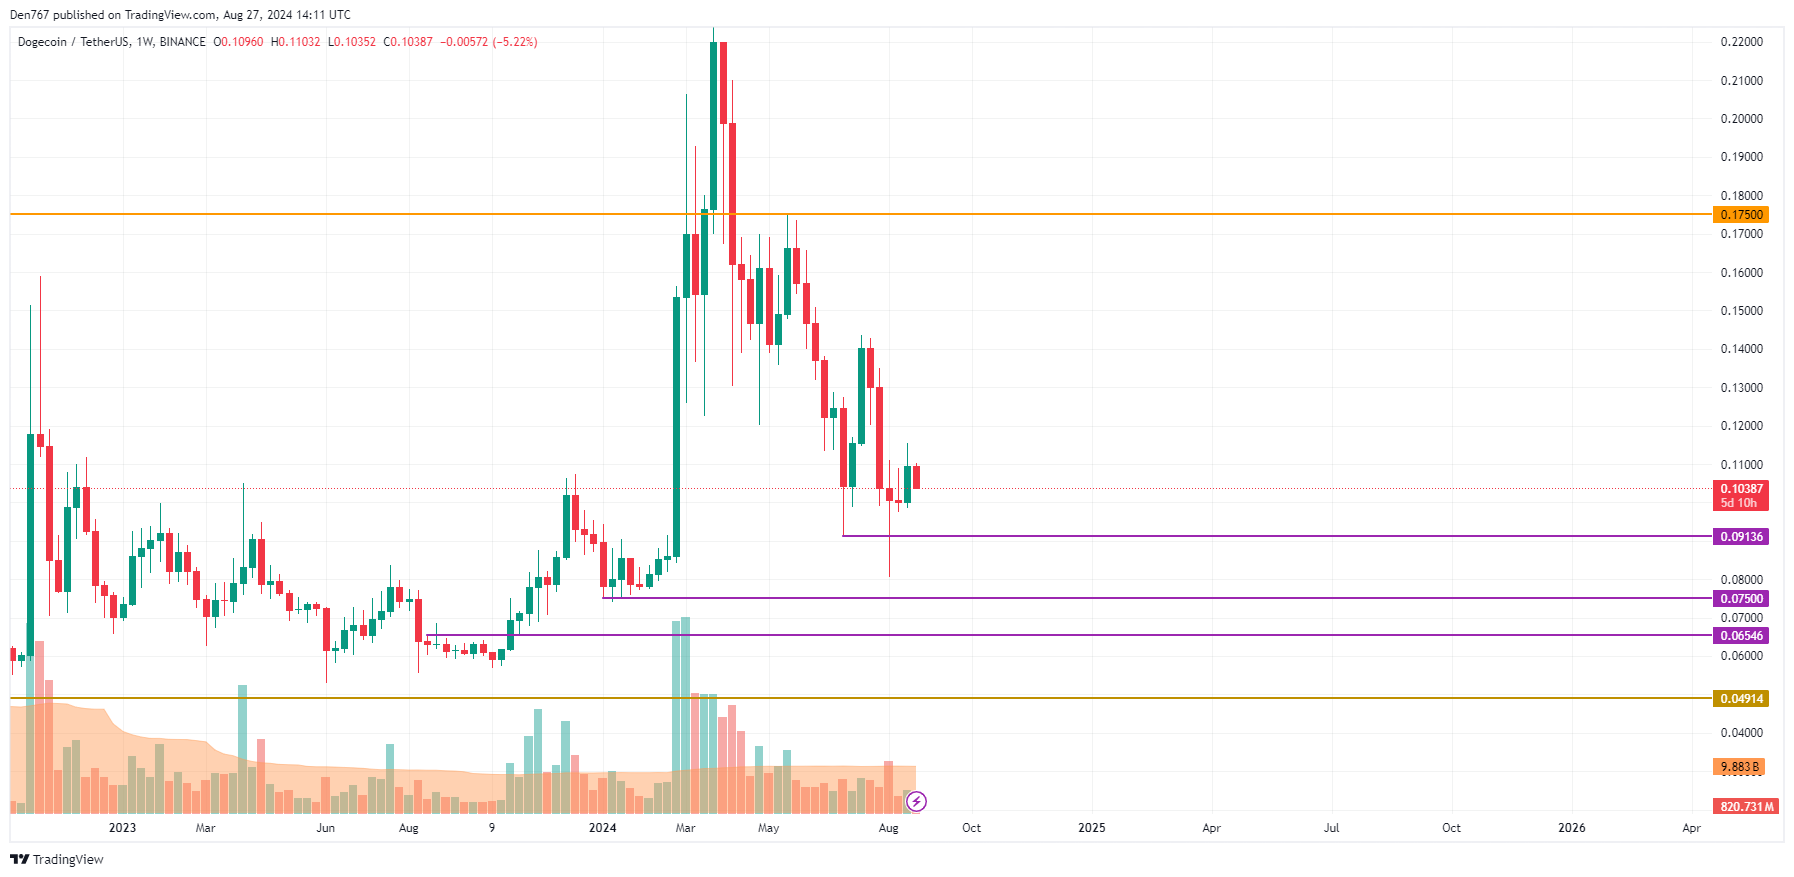
Bulls have failed to keep the growth going after the previous bullish bar closure. If the decline continues until the end of the week, traders may witness a test of the $0.09 mark.
DOGE is trading at $0.1033 at press time.
In a recent post on X, the crypto analyst highlighted his outlook for various crypto assets, including XRP. He noted his expectation for the targets to click by precisely this time next year in the ongoing bull season.
For the marker leaders Bitcoin and Ethereum, the analyst anticipates prices of $175,000 and $8,400 respectively. This projection is consistent with popular expectations among industry observers regarding the peak values for BTC and ETH this cycle.
The House of Crypto suggested that Solana could reach $920 next year, representing a substantial 482% increase from SOL’s current value of $158.
Meanwhile, the analyst proposed a $6.20 price target for XRP. Currently, XRP is trading around $0.5915, having lost 3.4% of its value over the past week. At this level, XRP is approximately 85% below its all-time high of $3.84.
This indicates that achieving a price of $6.20 would be a historic milestone for XRP, which has not reached a new all-time high in nearly seven years.
Several XRP proponents in the crypto community consider $6 a realistic target, as it would require a 948% increase from XRP’s current price. When considering XRP’s 942% surge following the Bitcoin halving in the 2021 bull cycle, this level of growth seems plausible.
However, some analysts in the XRP community believe that XRP is more likely to replicate its 2017 performance than the 2021 trajectory.
This view is based on the prolonged consolidation phase XRP has experienced since its last peak. They argue that a longer consolidation phase could lead to a more violent and extended uptrend once a breakout occurs.
As a result, some analysts have argued for up to $300 for XRP in this cycle. This audacious projection has been met with resistance amid sustained pessimism.
Critics argue that 2017’s history is no longer relevant and that the resulting market cap from bold forecasts like $300 makes the outlook mere wishful thinking.
Additionally, The House of Crypto founder is bullish on other notable altcoins, such as Chainlink (LINK) with a target of $110, Tron (TRX) aiming for $2, and ICP reaching $150.
Disclaimer: This content is informational and should not be considered financial advice. The views expressed in this article may include the author’s personal opinions and do not reflect The Crypto Basic’s opinion. Readers are encouraged to do thorough research before making any investment decisions. The Crypto Basic is not responsible for any financial losses.
Leading cryptocurrencies like Bitcoin and Ethereum have surged only 142% and 63%, respectively, since last year. SOL took the cake by steadily rising from $20 to its current price of $160 in a year.
Also Read: BRICS: Russia To Officially Use Cryptocurrency For Trade Settlements

The one-year chart shows Solana sustainably scaling up in the indices with minute dips in the middle. It quickly recovered from every fall, only to rise harder. A leading cryptocurrency analyst explained that the bullish sentiments for Solana are yet to end.
The analyst predicted that the altcoin could have more upside swings and climb above the $200 mark next. The optimistic price prediction comes when the cryptocurrency market faces macroeconomic pressures from an economy where murmurs of a recession are growing.
Also Read: Top 2 Cryptocurrencies To Watch in September 2024
Analyst Ali Martinez took to X and forecasted that Solana could be gearing up for another rally, explaining that its technical patterns are bullish.
He revealed that SOL is potentially printing an Adam and Eve pattern in the charts, which could drive its price up. According to the analyst, the next target is $220.
Also Read: Shiba Inu: How High Can SHIB Surge in September 2024?
“Solana might be shaping up for an Adam and Eve pattern, suggesting a potential rise to $164. If SOL clears that resistance, we could see a 33% surge toward $220!” he wrote.
Also Read: Cardano: Is There Still Hope for ADA to Reach $1 in 2024?
That’s an uptick and a return on investment (ROI) of approximately 38%. If the forecast turns out to be accurate, an investment of $1,000 could turn into $1,380.
Nonetheless, the cryptocurrency market moves in tandem with the stock markets, and if leading US stocks fall, Solana could also dip.
There is no guarantee that SOL could spike 38% and hit $220 in the coming weeks. It is advised to do thorough research before investing in SOL.

