The main tag of cryptocurrency price today Articles.
You can use the search box below to find what you need.
[wd_asp id=1]
The main tag of cryptocurrency price today Articles.
You can use the search box below to find what you need.
[wd_asp id=1]
XRP’s price trend has been slow for much of the past ten days, but the $0.585 mid-range resistance has been overcome. What this means is that the highs of the range that XRP has traded within for more than a year would be the next target.
A recent report highlighted how the token presented an attractive buying opportunity. Should traders aim for lofty heights, or exit their trade and secure profits near the range extreme?

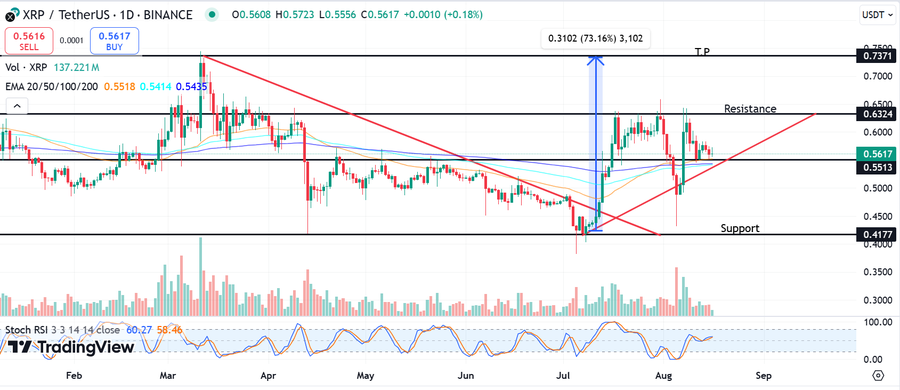
Source: XRP/USDT on TradingView
Now that the $0.585 mid-range level has been breached, the $0.7 range high is the next clear target. XRP has gained by 9.9% since last Friday, and the daily RSI seemed to be above 50 to denote bullish momentum as a result.
However, the $0.63-zone has served as resistance since early July. Additionally, Bitcoin [BTC] also has a resistance zone at $64k-$66k and was trading at $64.1k at press time.
The OBV was steadily rising to indicate strong demand, but the bulls might find it hard to push prices above $0.63 if the market-wide sentiment turns bearish in the coming days.
In case of rejection from the resistance level, bulls would do well to maintain prices above the $0.585 support. This would encourage swing traders of a buying opportunity targeting the range highs.
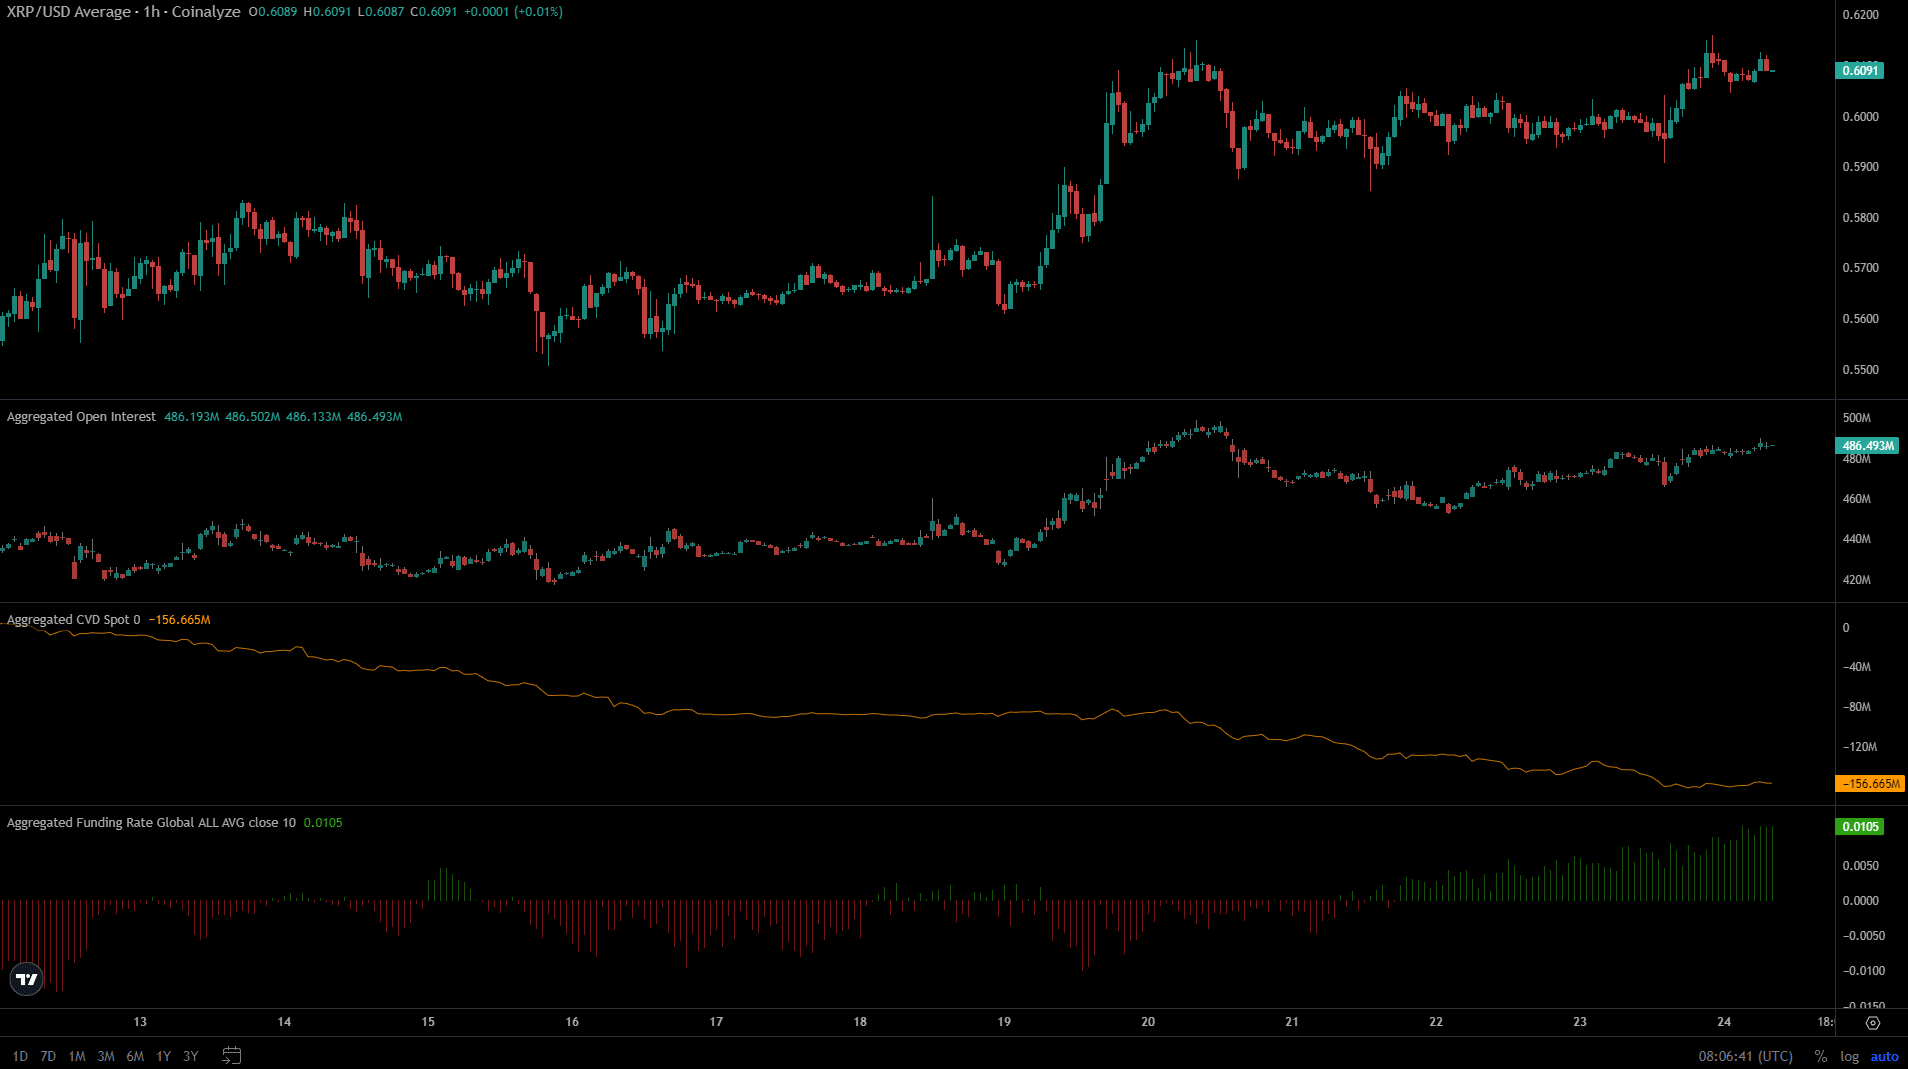
Source: Coinalyze
XRP’s price gains were accompanied by a steady uptick in the Open Interest. Together, they signaled Futures traders willing to go long and outlined bullish sentiment. The funding rate has also been growing more positive.
Read Ripple’s [XRP] Price Prediction 2024-25
Finally, the spot CVD stabilized its downtrend, without moving higher yet. Together, there was evidence for some more gains for XRP, but it is unclear if there is enough strength to propel the price to $0.7.
Disclaimer: The information presented does not constitute financial, investment, trading, or other types of advice and is solely the writer’s opinion
Now, a popular analyst has come up with a rather bullish price prediction, but some other metrics are also worth watching.
According to DustyBC, a well-known analyst with over 150,000 followers on X and across other channels, the XRP price could go “crazy.”
His chart, although rather simple, shows XRP trading towards the upper boundary of a flag pattern, which, if broken to the upside, could propel a move toward $2. This would mark an increase upwards of 3X from the current level.
As CryptoPotato reported yesterday, XRP’s gains topped 9% on a weekly basis, and the bias is leaning toward bullish. The momentum might be better, but if the cryptocurrency is indeed to break the pattern to the upside, this could result in increased volume and subsequent gains.
A notable decline in some on-chain metrics can be noticed.
For example, the number of payments from one account to another has declined by 26% over the past week.

The number of active accounts (unique senders) is also down by more than 50% in the past day.
The number of transactions executed on the XRPL dropped as well today and it’s interesting to monitor if this is because of the lower activity during the weekend or if some sort of a more worrying trend is forming.
Farina shared this insight in a video posted on X on Friday. He first addressed the ongoing speculation around XRP’s price potential. He dismissed XRP price predictions based on technical analysis (TA), arguing such analyses are baseless.
Farina emphasized that XRP’s price movements would be more influenced by its utility and adoption than arbitrary lines on a chart. According to him, XRP reaching a new all-time high, potentially surpassing its previous peak of $3.84, is not out of reach if utility and institutional adoption increase.
Farina provided a detailed analysis of what holding 20,000 XRP could mean for investors. Using a conservative estimate of $5 per XRP, he explained that this would equate to a total investment of $100,000.
Farina highlighted that even this modest price target would put investors in the top tier of wealth, outperforming most of the global population, particularly given the current economic climate where many people do not have significant savings or investments.
Notably, with XRP trading at $0.599 today, it costs approximately $11,980 to acquire a portfolio of 20K XRP.
Also, Farina noted that XRP’s potential to make a new all-time high relies heavily on its use case as a bridge currency for cross-border payments.
He explained that the real value of XRP lies in its ability to settle transactions quickly—within three seconds. This makes it highly attractive for financial institutions looking to streamline operations and reduce reliance on nostro and vostro accounts.
However, Farina also pointed out a potential drawback: because transactions are settled so quickly, institutions may not need to hold large amounts of XRP for extended periods, which could limit long-term price appreciation.
“But there’s less XRP circulating, which could push prices higher if demand increases,” he explained.
Overall, Farina expressed that for XRP to reach a new all-time high, several factors must align. They include broader adoption by financial institutions and central banks. Also, Ripple’s strategy to position XRP as a replacement for traditional nostro and vostro accounts could drive substantial demand.
Farina suggested that even capturing a small percentage of SWIFT transactions could propel XRP’s price significantly higher, potentially beyond $100.
While Edo Farina acknowledges that predicting exact price movements is challenging, he remains confident in XRP’s potential. He advised investors to focus on XRP’s fundamentals and use case rather than speculative TA, which Farina describes as largely “clickbait.”
Disclaimer: This content is informational and should not be considered financial advice. The views expressed in this article may include the author’s personal opinions and do not reflect The Crypto Basic’s opinion. Readers are encouraged to do thorough research before making any investment decisions. The Crypto Basic is not responsible for any financial losses.
However, due to the potential interest rate cut announcement by Jerome Powell, it experienced a significant breakout.
With this breakout, DOGE’s outlook has turned bullish despite trading below the 200 Exponential Moving Average (EMA) on a daily time frame. According to expert technical analysis, there is a high possibility that DOGE could soar by over 15% to the $0.13 level in the coming days or even higher.

However, another crypto expert made a post on X (previously Twitter) stating that the DOGE meme coin is moving into the 3rd phase of the bullish cycle and experiencing a consolidation along the trendline. This is very similar to phases one and two. Additionally, whenever this consolidation occurs on the trendline, the DOGE price tends to skyrocket significantly, and this time DOGE could rise to the $2 or $4.5 level.
At press time, DOGE is trading near $0.113 and has experienced a price surge of over 8% in the last 24 hours. Meanwhile, its trading volume has increased by 70% during the same period, indicating higher participation from traders due to the recent breakout and Powell’s fed rate cute announcement.
Whereas, DOGE’s open interest has also increased by 9% in the last 24 hours and continues to rise, according to the on-chain analytic firm CoinGlass. This increase in open interest suggests growing interest from traders and investors.
Apart from DOGE, the overall cryptocurrency landscape is up by 4.6% in the last 24 hours. However, top assets including Bitcoin (BTC), Ethereum (ETH), Solana (SOL), and Cardano (ADA) have experienced a notable price surge of over 5.6%, 5.3%, 5%, and 5%, respectively, in the last 24 hours.
In his latest market update, Gambardello highlighted several key indicators and upcoming developments that could drive ADA’s price higher in the coming days.
Notably, this month, Cardano revisited a ten-month low of $0.2799, which represented over 60% loss for investors who bought ADA in March.
However, the asset has notably rebounded from this bottom, trading at $0.381 at press time. Yet, ADA is 9% below the value it traded four weeks ago.
While pessimism toward ADA has heightened based on this recent price action, bullish analysts like Gambardello continue to emphasize that the asset’s trajectories are consistent with historical trends.
In his latest analysis for holders, Gambardello noted that Cardano is showing signs of bullish momentum on its technical charts.
He noted a bullish divergence on the weekly chart, where the relative strength index (RSI) is forming a higher low while ADA’s price is making lower lows. This divergence often indicates that the downward trend is losing strength, and a reversal could be imminent. Notably, ADA has increased by 5% in the last 24 hours.
Furthermore, the analyst also pointed out that ADA is currently testing the 50-day moving average, a key resistance level. If Cardano breaks above this level, it could trigger a rally toward the $0.43 range, the analyst noted.
Gambardello emphasized the significance of ADA attaining this threshold, suggesting it could mark a significant breakout from the symmetrical triangle pattern, potentially opening the door to higher levels.
Furthermore, Gambardello highlighted that the upcoming Chang hard fork, scheduled for August 27, could serve as a catalyst for ADA’s breakout. The upgrade introduces a new governance system, giving the Cardano community a greater role in decision-making and management of the network’s treasury.
The analyst believes this shift towards greater decentralization could enhance market sentiment around Cardano, as it positions itself as one of the most decentralized blockchains in the crypto arena.
With the combination of bullish technical indicators and the upcoming network upgrade, Gambardello is optimistic about ADA’s short-term prospects. His target of $0.43 suggests a potential uptrend that drives ADA higher by approximately 13%. Meanwhile, he stressed that the short-term outlook is uncertain.
Disclaimer: This content is informational and should not be considered financial advice. The views expressed in this article may include the author’s personal opinions and do not reflect The Crypto Basic’s opinion. Readers are encouraged to do thorough research before making any investment decisions. The Crypto Basic is not responsible for any financial losses.
 August 31, 2024 Price Prediction")
The asset was battling with Binance Coin (BNB) for the fourth spot on the cryptocurrency ladder. Currently, SOL’s market cap is $66.94 billion, making it the fifth largest cryptocurrency. BNB’s market value is $84 billion.
Also Read: XRP: Ready to Rocket as Tether Bubble Bursts!
Many were surprised by Solana’s price rut, considering the positive developments in the network. The Brazilian government has been embracing assets like Solana by approving spot exchange-traded funds (ETFs).
While the United States is lagging behind, Brazil was seen rolling out multiple Solana-based ETFs. While the asset has not witnessed a major rise post this news, the community is hoping for a bullish end to this challenging month.
Also Read: Solana-Based Popcat Rallies 30% After Binance Listing

It seems like Solana will have a slow end to the turbulent month of August. According to data from Changelly, SOL will trade around the same level in the coming week. The altcoin will trade at $142.81, a slight fall from its current price zone.
While SOL seems to be on the sidelines, a meme coin called Popcat has made quite some noise in the market.
With the focus on this meme cryptocurrency, the community is waiting to witness a potential rise in the Solana market.
Also Read: Tron Weeknd Price Prediction: Is TRX Vying For A New ATH?
The U.S. government’s ETF efforts around SOL could boost the altcoin price.
If bears are unable to push the price decisively below $0.10, this scenario could entice new entrants to ape in on the rally, potentially driving prices towards $0.15 in the days ahead.
The Coinglass Liquidation Map shows the concentration of leverage positions, with a significant number of long positions around the $0.11 mark, reinforcing the potential for a bear trap.
Based on current technical indicators and market conditions, the next Dogecoin rally could potentially trigger a breakout past $0.11, with $0.15 being the next major target.
Although the broader crypto market sentiment remains cautious, DOGE bulls are showing notable resilience. This persistence could help Dogecoin maintain relatively high support levels and potentially spark a significant breakout towards $0.15.
The upper Bollinger bands indicator shows that Dogecoin currently faces a major resistance at the $0.11 level.
An analyst points to a strategy that could yield considerable returns for traders following the recent XRP price trend.
Holding XRP in light of the current uncertainty in the market can be frustrating. However, according to X analyst Bitcoin Ape, following the trend and trading the XRP range will be more rewarding.
The professional market analyst provided a classic trade setup that traders could profit from despite XRP’s price range. The analyst noted that the XRPL native token has been swinging between $0.43 support and $0.72 major resistance for almost a year.
To make the most of the XRP’s underwhelming price movement, Bitcoin Ape has suggested trading the range until the token breaks out. His trading strategy involves opening a long position at the $0.43 support zone and taking a profit when XRP nears the resistance at the $0.72 upper range.
The strategy has Bitcoin Ape’s open position up 40% at the time of his X tweet. XRP traded at $0.5665 when the analyst tweeted the strategy and was trading at $0.5671 at press time, signaling further gains on the position.
This short-term strategy of profiting from XRP’s range would be invalidated when the token breaks above or below the resistance or support areas, respectively.
The global crypto market has failed to impress recently, with Bitcoin struggling to break above $60,000. A reduced inflow from the asset’s US spot exchange-traded funds (ETFs) and other unfavorable macroeconomics have seen the asset and the broader cryptocurrency market struggle.
However, the XRPL network has seen a significant boost in recent times. The ecosystem has just emerged from a notable win against the US Securities and Exchange Commission (SEC) after an August 7 ruling concluded that XRP was not a security.
Since then, Ripple announced a strategic partnership with the SBI Digital Community to promote XRPL, and buzz around stablecoin RLUSD has gained momentum.
Recent whale activity on the XRPL network also shows notable asset accumulation, as a new address accumulated over 104 million XRP. All these indicators point to a possible price breakout soon enough.
Disclaimer: This content is informational and should not be considered financial advice. The views expressed in this article may include the author’s personal opinions and do not reflect The Crypto Basic’s opinion. Readers are encouraged to do thorough research before making any investment decisions. The Crypto Basic is not responsible for any financial losses.
Dogecoin price is at a crucial point in the daily chart as it approaches a zone of strong resistance. Meanwhile, whales are booking profits, perhaps acting out of uncertainty of whether DOGE can break through the resistance. Conversely, traders remain optimistic that Dogecoin will conquer $0.1 and move higher. The price of DOGE hovered around $0.1067 during the New York trading session, a 0.8% increase in the last 24 hours.
Data from Santiment shows whale transaction count increased gradually from Aug. 21, peaking on August 22, before slightly correcting. All this while, DOGE price was on an uptrend. This indicates that whales might have been booking profits as the price increased.
IntoTheBlock data shows that large-holder netflows dropped by 194% over the last seven days. Coincidentally, Dogecoin Exchange reserves increased by $179M during the same period. This might indicate that whales have been cautiously offloading their DOGE bags throughout the week.

Additionally, the total DOGE supply in profit has hit its highest month-to-date (MTF). This may also explain why whales thought booking profits at these Dogecoin price levels was a good idea.
According to Coinglass data, spot traders played a greater role than Futures traders in the current DOGE uptrend. The Dogecoin funding rate dropped from 0.01% on Aug. 21 to 0.0057% on Aug. 23, while the price increased in the same duration. This signifies that, although futures traders are long on DOGE, Spot traders contribute more to the current uptrend.

Dogecoin price prediction shows a high chance that the asset may exceed the $0.1 barrier. Over 50% of holders are in profit, with no incentive to sell at a loss if there’s a chance they might recover their investment.
Dogecoin price has broken out of a falling wedge pattern and is now trading above it, signaling a potential shift towards an upward trend.
If the price continues to rise, it will likely encounter resistance around $0.1095. A successful break above this level could mark the beginning of a more significant upward move, with the next major target at $0.1274.
The positive Chaikin Money Flow (CMF) indicates strong buying pressure in the market, supporting a bullish outlook. DOGE price is currently attempting to break above the 200-day EMA, a move that would confirm a shift from a bearish to a bullish trend. Trading consistently above this moving average is typically viewed as a strong bullish signal.
If Dogecoin maintains its position above the 200-day EMA with increased trading volume, it could confirm a longer-term bullish trend with targets above $0.1274.

However, if the DOGE price fails to break above the 200-day EMA, it may fall back below the falling wedge pattern to $0.1000 or even lower to $0.095, which would invalidate the bullish scenario.
Whales appear to be booking profits due to uncertainty about whether DOGE can break through a strong resistance zone.
Whale transaction counts have been increasing gradually since August 21, peaking on August 22. This trend suggests that whales may have been taking profits as the Dogecoin price increased.
The $0.1 price level is a critical resistance point for Dogecoin. Breaking above this barrier could lead to a 17% breakout, with potential targets around $0.1274.
Related Articles
Evans Karanja
Evans Karanja is a content writer and scriptwriter with a focus on crypto, blockchain, and video gaming. He has worked with various startups in the past, helping them create engaging and high-quality content that captures the essence of their brand. Evans is also an avid crypto trader and investor, and he believes that blockchain will revolutionize many industries in the years to come. When he is not writing, you can find him playing video games or chasing waterfalls.
Disclaimer: The presented content may include the personal opinion of the author and is subject to market condition. Do your market research before investing in cryptocurrencies. The author or the publication does not hold any responsibility for your personal financial loss.
Bitcoin (BTC) price impending rally continued to thaw during Asian trading hours ahead of the Federal Reserve Chair Jerome Powell’s speech at the Jackson Hole Symposium at 10:00 AM EST. Altcoin majors such as Ethereum (ETH) price and XRP price faced mixed signals amid calls for liquidity to uphold upward momentum. At the same time, Avalanche (AVAX), Near Protocol (NEAR), and Bittensor (TAO) beamed with modest gains of 11%, 7%, and 9.5%, respectively.
Bitcoin price hovered at $60,840 as attention turned to Powell’s speech at the Jackson Hole meeting in Wyoming. Investors anticipate the speech will touch on the expected rate cuts and the economic policy in general, especially after the downward revision of nonfarm payrolls, which signaled a weakening labor market. Rate cuts will buoy risk markets by allowing the return of liquidity. Hence, BTC price could gain momentum, beating the $62,000 resistance to prop a major run toward $70,000.
Technically, Bitcoin price appears ready for the move courtesy of the formation of an ascending triangle pattern. If validated by breaching the x-axis resistance at $61,664, a 13% leg up may follow to $69,700. A move like this would ignite FOMO, and with the anticipated liquidity, Bitcoin may soon reach a new all-time high.

According to this Bitcoin price forecast, bulls must affirm their grip by keeping Bitcoin above the 20-day, 50-day, and 200-day EMAs. Due to unmet expectations, trading below these key levels may attract a fresh round of sell orders. Below the ascending trend line, declines may accelerate to $56,000 and even $54,000.
Ethereum continued with sideways price action between the demand area as illustrated—above $2,500 and the supply area below $2,800. Its short-term support, around $2,600, reinforced by the 20-day and 50-day EMAs, points to a potential bullish outcome.
The Moving Average Convergence Divergence (MACD) indicator leans on the bullish side, flaunting a buy signal and adding credibility to the uptrend. A breach of the upper range limit is required to break ETH price out of the consolidation phase and advance to $3,000.

As per Ethereum price prediction, a breakout could occur on either side of the demand and supply areas. The downtrend may continue if ETH ETFs continue to experience outflows.

SoSoValue recorded $874.61k net withdrawals on Thursday, culminating in a total net outflow of $458.95 million. Although the margin of outflows has narrowed, their persistence affects general sentiment.
XRP price is a step away from a new bullish phase. It sits above the 20-day EMA support at $0.5961 as bulls push against $0.6 resistance. The Money Flow Index (MFI) reversal at 37 suggests that traders are closing their short positions and gradually shifting to long positions. Increased upside action will occur as the MFI flips the 50 midline level, advancing to the overbought region.
The cross-border token’s bullish thesis will face the ultimate litmus test between $0.6 and $0.62. In a recent attempt, XRP price topped out at $0.62, dropping to $0.55 afterward. Bulls could find leeway to push to $0.7 and significantly close the gap to $1 if successful.

Traders should keenly follow XRP movement around $0.6 resistance and the immediate support at the 20-day EMA. The MFI will uphold another correction if it dips into the oversold region. Other key levels include $0.58, $0.55, and $0.52.
The Fed Chair is expected to speak on interest rate cuts and the economic policy.
Markets tend to rally after the symposium; hence, it is normal to expect BTC to rally toward $70,000.
Ethereum continues to hover between the $2,500 and $2,500 range, held down by the lack of liquidity and momentum to rally.
John Isige
John is a seasoned crypto expert, renowned for his in-depth analysis and accurate price predictions in the digital asset market. As the Price Prediction Editor for Market Content at CoinGape Media, he is dedicated to delivering valuable insights on price trends and market forecasts. With his extensive experience in the crypto sphere, John has honed his skills in understanding on-chain data analytics, Non-Fungible Tokens (NFTs), Decentralized Finance (DeFi), Centralized Finance (CeFi), and the dynamic metaverse landscape. Through his steadfast reporting, John keeps his audience informed and equipped to navigate the ever-changing crypto market.
Disclaimer: The presented content may include the personal opinion of the author and is subject to market condition. Do your market research before investing in cryptocurrencies. The author or the publication does not hold any responsibility for your personal financial loss.
 Price Prediction, But Some Worrying Signs Appear")


