The main tag of cryptocurrency price today Articles.
You can use the search box below to find what you need.
[wd_asp id=1]
The main tag of cryptocurrency price today Articles.
You can use the search box below to find what you need.
[wd_asp id=1]
Cardano’s (ADA) price might just be at a crossroads, with the altcoin testing key support levels on the charts. At the time of writing, Cardano was trading at $0.33 – A price level that has historically acted as both support and resistance.
Now, although the market appeared to be recovering, Cardano’s price action has remained sluggish. In fact, the altcoin has been stuck in its press time range for a while now, with bulls being unable to muster enough buying pressure either.
This sluggish performance is also evident in the asset’s profitability metrics. According to the IntoTheBlock data, only 15.85% of Cardano addresses own “In The Money.” This implies that there are few strong hands holding the asset, possibly limiting any upward price momentum.
Similarly, the same data revealed that almost 79.88% of addresses were out of money, meaning they purchased ADA at a loss. As prices went up, this high percentage of underwater positions might result in a sell-off, as holders would want to get out at their break even points.
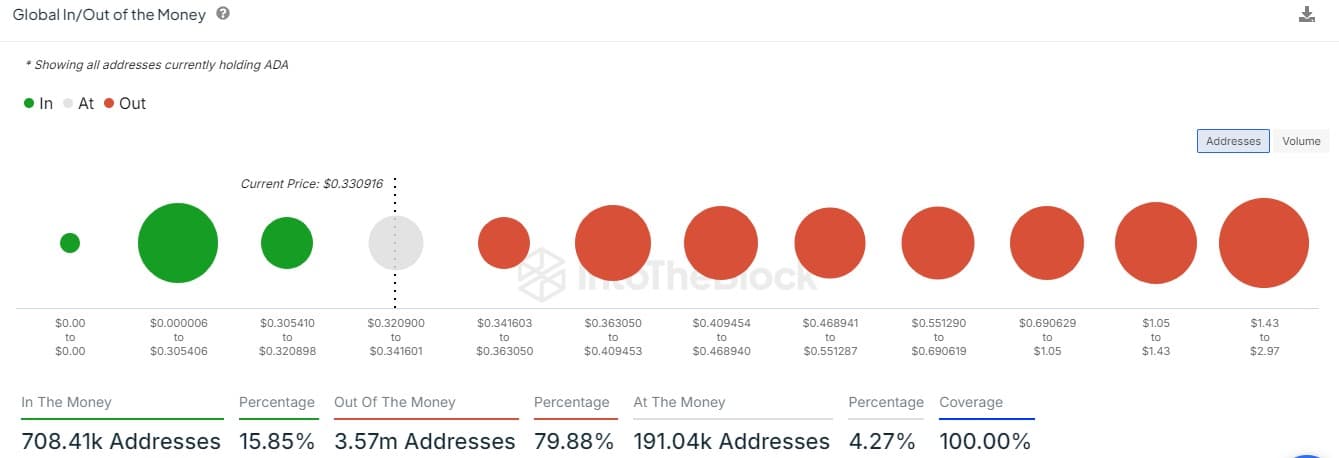
Source: IntoTheBlock
Looking at Cardano liquidation data, it indicated prospective volatility on the cards, even though the market appeared dull. It also revealed several liquidation levels concentrated around the $0.35-level on the charts.
If this level can be decisively conquered, then it would lead to cascades of liquidations, thereby helping fuel a bigger upward move in prices. However, such an occurrence may face hurdles from sellers seeking to recoup their losses. Especially given the low profitable address percentage.
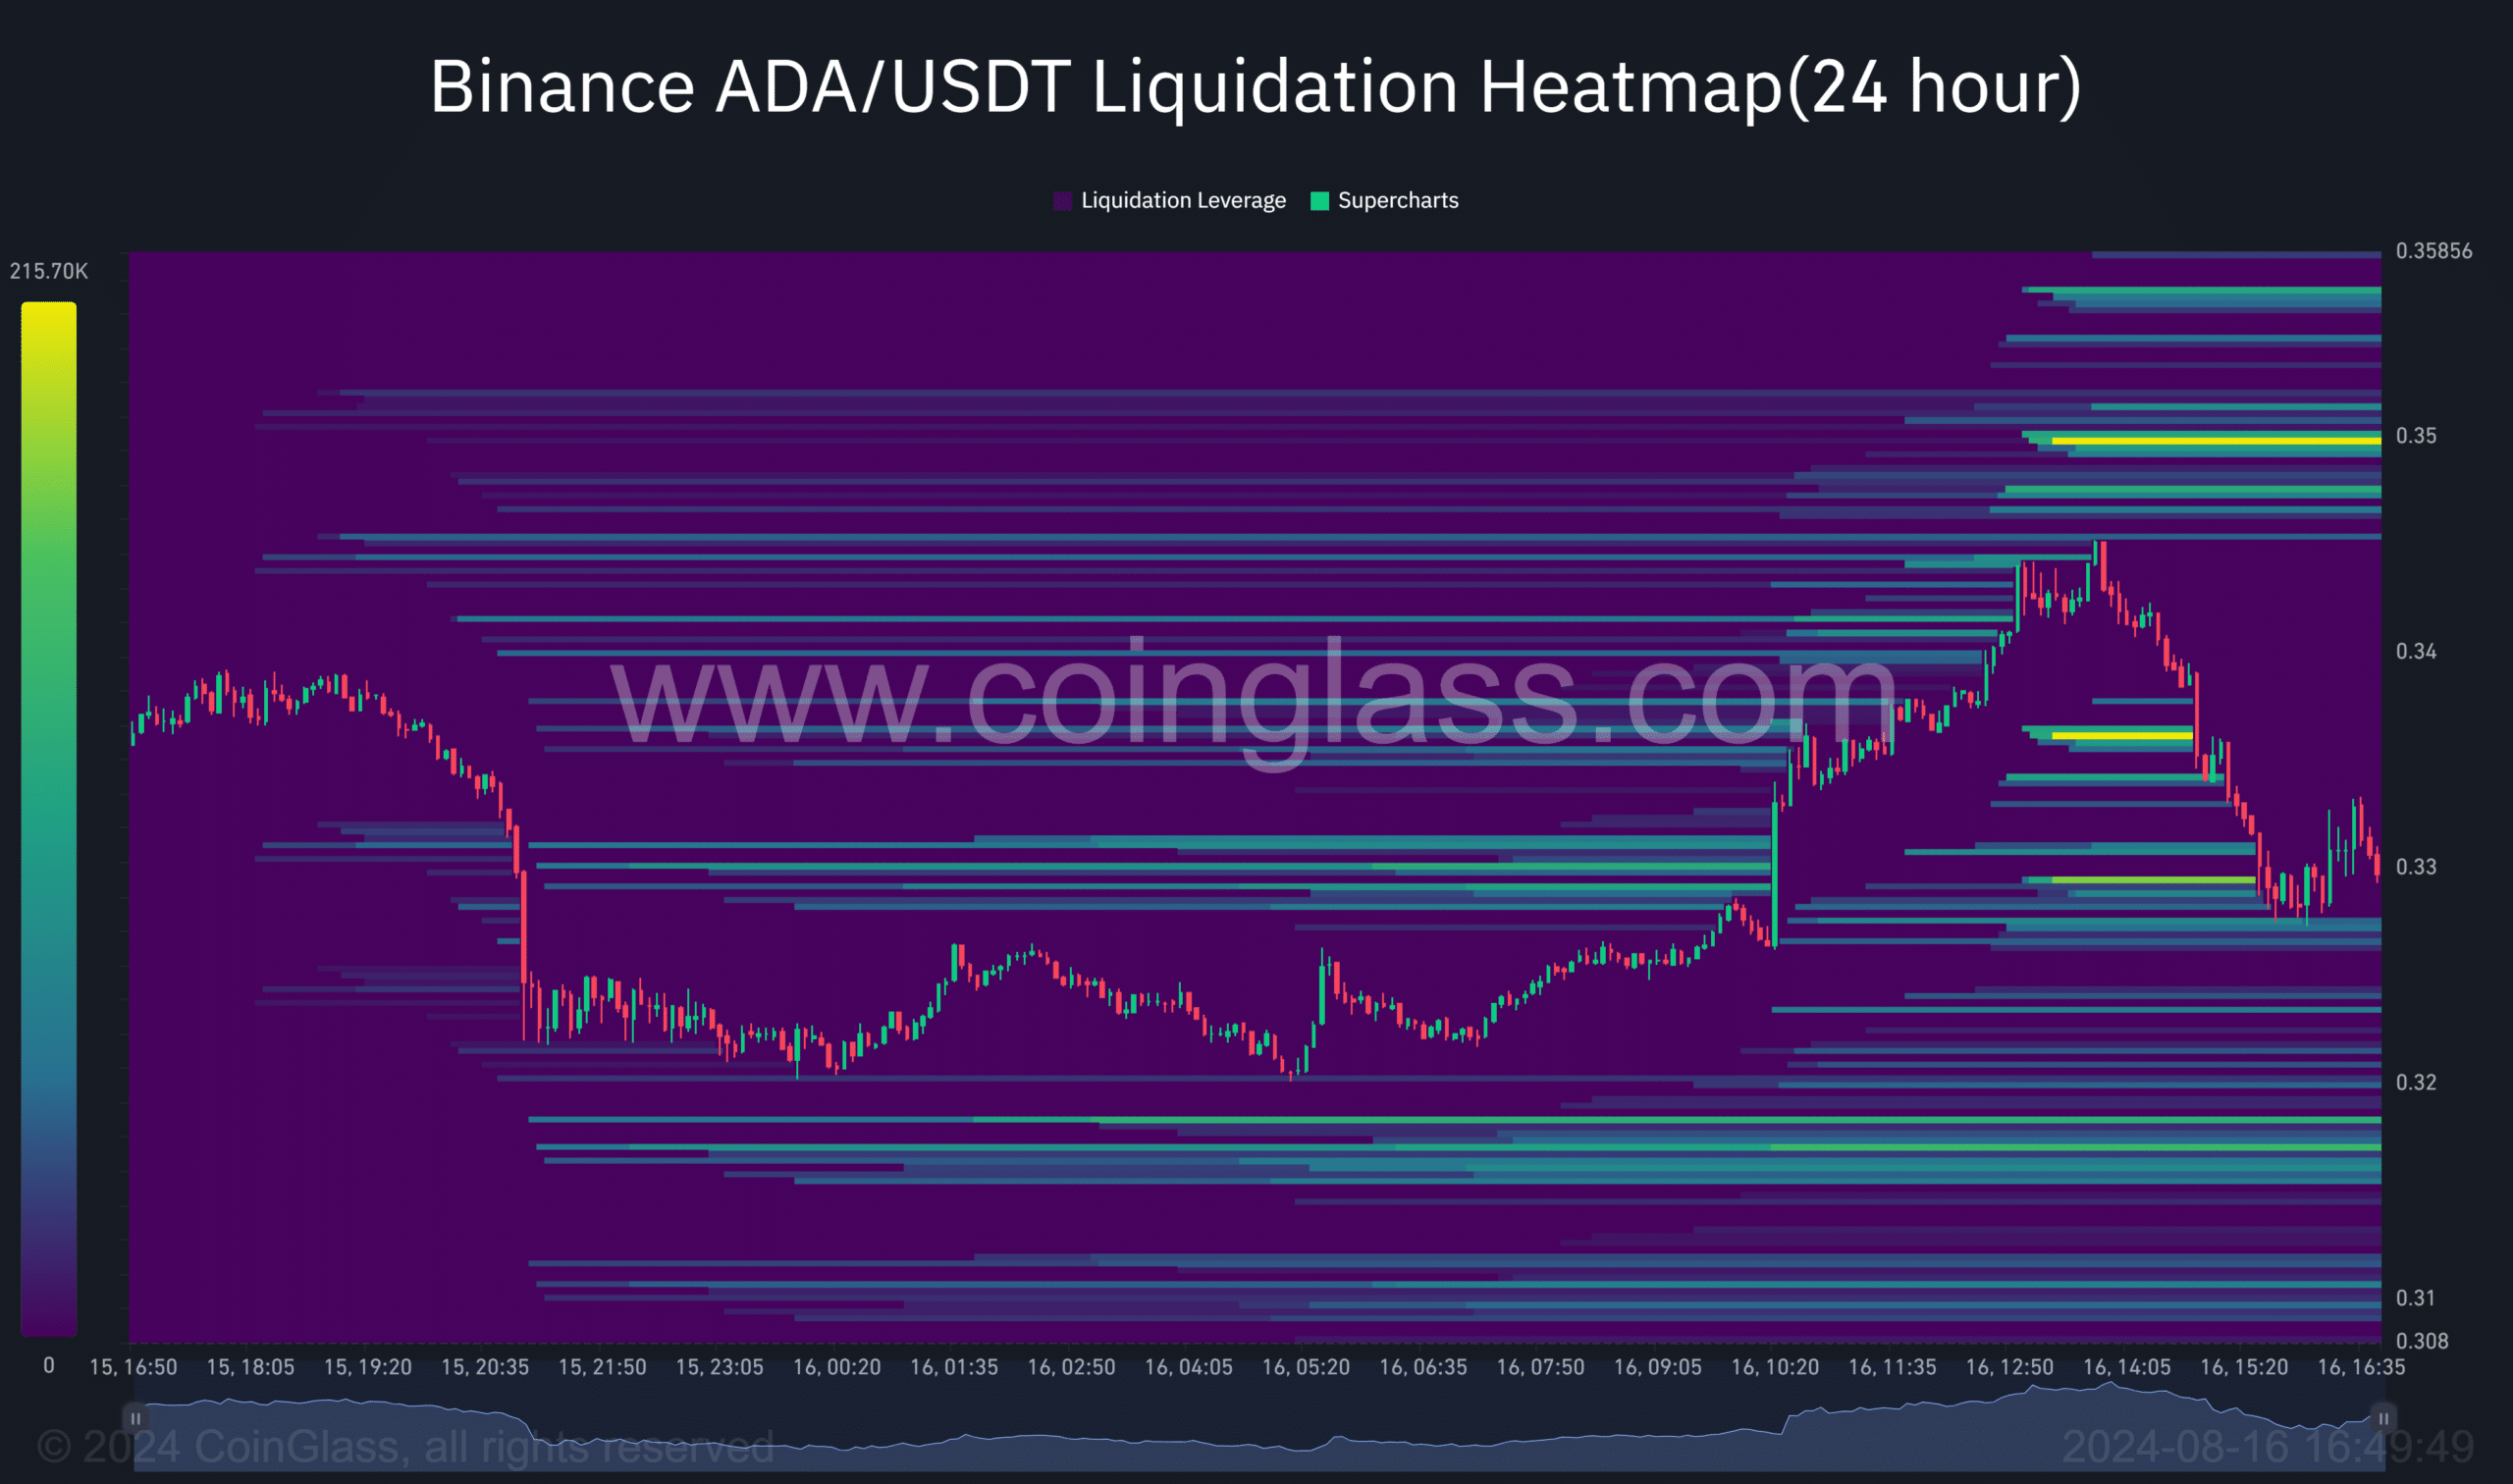
Source: Coinglass
Hence, the question – Can 16% profitable addresses bring about a significant bull rally? Despite being a minority, this group might have the money and confidence necessary to drive up prices positively.
To have any meaningful recovery for Cardano, it will need to break convincingly above the $0.35 resistance level. This will not only lead to potential liquidations. but also make more addresses profitable, thereby reducing sell-side pressure.
Recent technical analysis reveals a mixed outlook for Cardano. After a notable rebound from its recent low, ADA managed to break above the resistance at $0.316. Despite this, the overall sentiment in the market remains bearish, with the cryptocurrency struggling to maintain upward momentum. On the daily chart, Cardano has encountered resistance at various levels, including the 50-day Simple Moving Average (SMA) of $0.39126 and the 14-day Relative Strength Index (RSI) of 40.05, which indicates a lack of strong buying pressure.
The RSI, which measures the speed and change of price movements, currently suggests a potential for further downside if the market sentiment does not shift positively. The Bollinger Bands have also widened, reflecting increased volatility and a potential bearish reversal. While Cardano holds crucial support at $0.31, any failure to maintain this level could lead to further declines, possibly testing the $0.2175 support level.
For August 2024, Cardano’s price is expected to experience some fluctuations. The short-term outlook suggests a consolidation phase, with ADA likely to test the support region between $0.31 and $0.33 before making a decisive move. The potential for recovery to $0.42 and even $0.55 exists if the market sentiment turns bullish. However, given the current bearish trends and market conditions, a cautious approach is advisable.
Looking further ahead to 2024, Cardano’s potential to recover and break above its previous resistance levels is contingent upon broader market trends and investor confidence. Predictions suggest that ADA could potentially reach a high of $2.02 by the end of 2024, with a possible low around $0.30 and an average price of $1.16. These projections are based on anticipated market movements and potential bullish trends in the latter part of the year.
As we move into 2025, Cardano’s price forecast becomes more optimistic. Analysts predict that ADA could average around $2.11, with potential lows of $1.81 and highs of $2.42. The anticipated increase in ADA’s value is attributed to potential improvements in the Cardano platform’s functionality and adoption.
In 2026, ADA’s price is expected to range between $2.76 and $3.30, reflecting continued growth and increased market confidence. By 2027, the cryptocurrency could reach new heights, with predictions indicating a potential maximum price of $5.03. This bullish outlook assumes that Cardano will achieve significant milestones in technology and adoption, reinforcing its position in the market.
For 2028, ADA’s price forecast includes a range from $5.29 to $5.73. This period may see Cardano benefiting from sustained growth and broader acceptance. The long-term prospects for Cardano suggest a steady rise, with an average price around $5.51.
Looking further into the future, the predictions for 2029 and 2030 become even more promising. By 2029, ADA could see a minimum value of $6.68 and a maximum of $7.79, with an average price of $7.23. If Cardano continues to expand and innovate, the forecast for 2030 becomes particularly optimistic, with ADA potentially reaching $10.32. This would require substantial growth and positive market dynamics, but it is not entirely out of the realm of possibility.
Cardano’s unique selling points, including its energy-efficient Proof of Stake (PoS) consensus algorithm and its focus on scalability and sustainability, make it an attractive long-term investment. Despite current market challenges and volatility, Cardano’s technological advancements and growing ecosystem offer a solid foundation for future growth.
The recent news of Cardano’s availability for custody and trading on Post Finance, coupled with upcoming events like the RareEvo Blockchain conference, could positively impact ADA’s short-term performance and adoption. These developments are likely to influence market sentiment and potentially drive ADA’s price upward.
Cardano has faced significant price fluctuations, but there are signs of potential recovery. The cryptocurrency’s ability to retest previous support levels and consolidate could signal a turnaround if positive market conditions prevail. Historical price patterns suggest that Cardano has the potential to recover to its previous highs and possibly exceed them, given favorable market conditions and technological advancements.
Cardano’s journey from its all-time high to its current levels has been marked by volatility and challenges. However, the long-term outlook for ADA remains positive, with potential price increases anticipated through 2025 and beyond. While short-term movements may be uncertain, the cryptocurrency’s innovative approach and growing ecosystem suggest that ADA could achieve significant milestones in the coming years.
Post Views: 6
At the beginning of August, XRP had a difficult start as its price dropped to the lowest point in three months on August 5. However, the overall cryptocurrency market began to show signs of improvement during the second week of the month. This recovery was partly due to the less severe penalty imposed on Ripple by U.S. authorities. This decision was viewed positively by many investors, especially considering the prolonged legal dispute with the Securities and Exchange Commission (SEC).

During the recent market fluctuations, XRP has shown remarkable resilience when compared to other alternative cryptocurrencies. This resilience can be observed in the price action, as XRP experienced a notable 6.7% price increase, rising from $0.55 to $0.574 between August 11 and August 15. Meanwhile, the TOTAL3 chart indicates a 4.8% decline in the broader altcoin market, which lost over $28.4 billion in market capitalization. This contrast suggests that XRP has internal bullish catalysts, propelling its performance ahead of the market average.
The impact of the ruling appears to extend beyond mere FOMO buying. Underlying on-chain data shows a significant increase in user activity on the XRP Ledger blockchain since the ruling. Specifically, daily transactions on the XRP Ledger have surged, reflecting broader market confidence.

The chart highlights that daily transactions rose from 985,498 on August 6 to 1,587,800 by August 13. This represents a 61% increase in just a week. The surge correlates with the U.S. court’s decision to fine Ripple $125 million, marking a positive end to the prolonged SEC case.
Two factors contribute to this bullish signal: first, increased daily transactions often indicate heightened network activity, a precursor to price surges. Second, more transactions suggest growing adoption, which is typically positive for long-term price stability. If this trend continues and broader market sentiment improves, XRP could be on the verge of a major breakout.
The technical outlook for XRP is cautiously optimistic, with key resistance and support levels in focus. XRP has been trading within a narrow range between $0.55 and $0.57. The recent uptick to $0.574 brings XRP closer to a critical resistance level at $0.61.
The Keltner Channel (KC) indicator suggests that XRP’s price is nearing the upper boundary, a potential sign of overextension. However, the Parabolic SAR (Stop and Reverse) dots remain below the price, indicating a continuing uptrend.
 | TradingView - The Crypto Basic")
The first major resistance at $0.61 is significant, as it marks the upper limit of the current trading range.
If XRP manages to break through this resistance, the next target would likely be around $0.65. However, failure to surpass $0.61 could lead to a retest of support at $0.55, with a potential further downside toward $0.50 if market sentiment deteriorates.
In summary, while XRP’s recent performance is promising, it faces a crucial test at the $0.61 level. A break above could signal further gains, but investors should be cautious of a possible pullback if this resistance holds firm.
Disclaimer: This content is informational and should not be considered financial advice. The views expressed in this article may include the author’s personal opinions and do not reflect The Crypto Basic’s opinion. Readers are encouraged to do thorough research before making any investment decisions. The Crypto Basic is not responsible for any financial losses.
-Advertisement-
Also Read: Solana Struggles Continue: Can Brazil’s SOL ETF Trigger $160 Target?
 Weekend Price Prediction: Mid-August 2024")
It is unclear why the crypto market is in a slump right now. The stock markets, on the other hand, seem to be rising. Investors and traders may be uncertain about risky assets given the Federal Reserve’s ambivalence on interest rate cuts. The Fed has not officially commented on whether it intends to cut rates later this year.

According to the analysts at CoinCodex, Solana (SOL) will trade at $145.67 on Sunday, Aug. 18, 2024, a 1.51% increase from current levels.
Also Read: Bitcoin Seized: $600M and IMF 85% Electricity Tax
Changelly analysts also present a similar price prediction for SOL. The platform anticipates SOL continuing to trade at current levels, reaching $144.81 on Sunday, Aug. 18, 2024.
Given the crypto market’s lackluster performance over the last few days, Solana (SOL) may consolidate at current levels. If market sentiment improves, the asset may begin to turn things around.
Also Read: Solana: How Bitcoin & Ethereum Can Carry SOL to $250 This Year
There is also much talk about an SOL ETF making its debut. Although the SEC has yet to give a verdict, an ETF could vastly improve the asset’s price.
Today, Ethereum revisited the $2,518 low, adding to the broader bearish trend that has persisted. Data show a significant drop of 24% over the past month, indicating negative momentum in the higher timeframes.
At its current value, Ethereum is far from the key resistance at $2,670, a critical level that would need to be breached for this downward trend to shift. Despite this, several experts suggest there could be an upside.
Amid the current market challenges, a recent CoinGecko study offers a more optimistic view of Ethereum’s long-term prospects. The study examines eight predictions from several reputable industry voices, including Ark Invest, Changelly, VanEck, and others. All eight sources forecast a rise in ETH’s value, with estimates ranging from $4,400 to $166,000.

Among the predictions, the lowest estimate targets $4,443.63 by 2025. On the other hand, Cathie Wood of Ark Invest anticipates a much higher value, predicting ETH could reach $166,000 by 2032. While most analysts foresee an increase, only two sources—VanEck and Cathie Wood—expect ETH to cross into six-digit territory.
VanEck projects a potential rise to $154,000. Importantly, shorter-term predictions, including those from QCP Capital, Bernstein, and Standard Chartered, suggest a more modest rise to between $6,000 and $8,000 within the year. On the other hand, crypto exchange Changelly thinks Ethereum will climb to $5,094 by 2025, while Digital Coin Price puts their odds at $7,528 by 2025.
Per CoinGecko’s study, several factors could play a role in determining Ethereum’s trajectory in the months ahead. The transition from proof of work to proof of stake, completed in September 2022, continues to influence the network. Staking requirements have notably reduced decentralization potential, raising concerns about transaction censorship. However, PoS also enables Ethereum to scale, with Layer 2 networks driving higher transaction volumes and reduced fees.
Ethereum currently processes twice the daily transactions of Bitcoin. As Ethereum’s 2.0 roadmap introduces sharding, the network could achieve 100,000 transactions per second. This improvement, combined with Ethereum’s unique position as a prime platform for Layer 2 projects, enhances its attractiveness to investors.
The latest developments, such as Grayscale’s introduction of new cryptocurrency trusts for SUI, TAO, and MKR, further highlight the growing institutional interest in crypto assets.
This development fueled hopes of increased institutional adoption, notably lifting Ethereum’s price by 30% between August 5 and August 10. Despite this optimism, Ethereum’s price experienced fluctuations, notably declining 6% on August 14 after U.S. CPI data led to market volatility.
Disclaimer: This content is informational and should not be considered financial advice. The views expressed in this article may include the author’s personal opinions and do not reflect The Crypto Basic’s opinion. Readers are encouraged to do thorough research before making any investment decisions. The Crypto Basic is not responsible for any financial losses.
-Advertisement-
The market watcher presented three different charts to confirm his thesis. According to him, the XRPUSD, XRP Market Dominance and XRPBTC charts all suggest that XRP is in a favorable position marketwise.
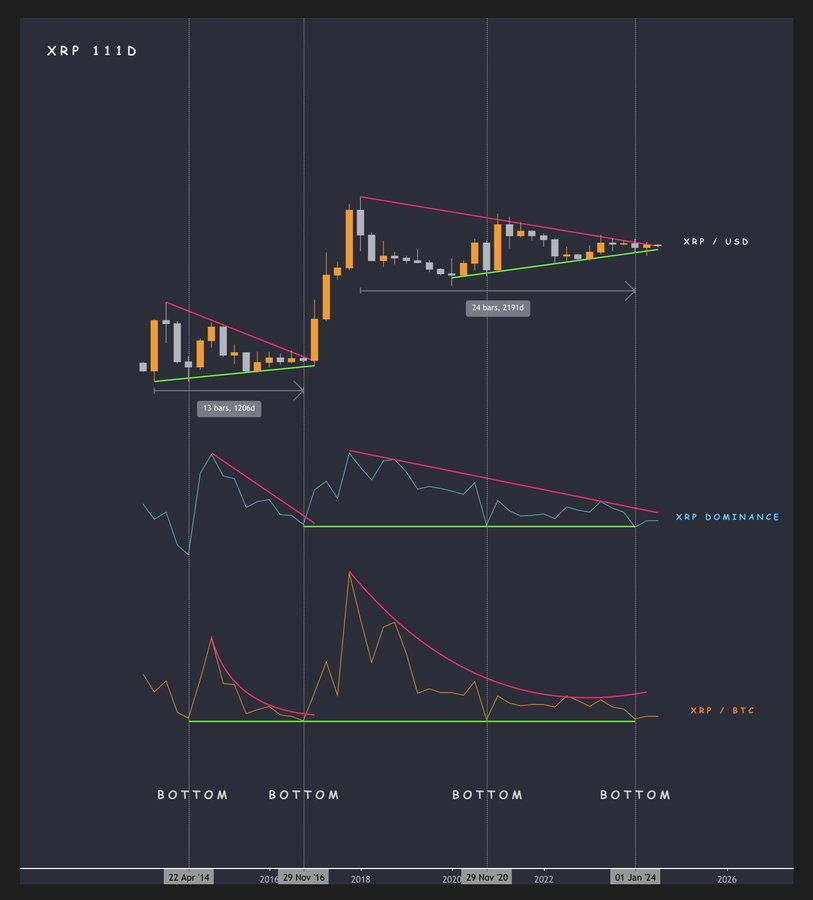
The XRP/USD chart shows a consolidation phase. Moonshilla pointed out that this consolidation period has almost doubled compared to the previous one seen between 2014 and 2016.
The chart reveals a symmetrical triangle pattern, which has been developing for 2,191 days. This pattern often leads to a strong breakout. In this case, XRP is close to the apex of the triangle, signaling that a breakout is imminent.
The last similar pattern, which lasted 1,206 days, led to a massive surge in XRP’s value. If history repeats itself, the current setup could result in another explosive move upward.
The XRP dominance chart further bolsters this bullish outlook. The chart shows a triple bottom formation, a classic bullish reversal pattern. This pattern occurs when an asset’s price hits the same support level three times without breaking below it.
The pattern on the dominance chart suggests that XRP has found a strong support level and is now poised to regain market share. A declining trendline above the chart indicates that this period of underperformance might be ending, potentially leading to a significant increase in XRP’s market dominance.
Meanwhile, the XRP/BTC chart shows a quadruple bottom pattern, another bullish reversal indicator.
This pattern, similar to the triple bottom, indicates strong support at a particular price level. Notably, XRP has found support against Bitcoin four times, suggesting that the downside is limited, and a reversal is likely.
The chart also features a downward-sloping trendline, which XRP looks ready to challenge. If XRP can break through this trendline, it could signal the start of a new uptrend against Bitcoin.
When these three charts are viewed together, they point to a massive rally in XRP. Moonshilla emphasized that trading is all about balancing risk and reward, and in this case, the potential reward far outweighs the risk.
The analyst drew parallels between the current market conditions and those seen in 2014-2016, a period that preceded a 50,000% increase in XRP’s value within 333 days.
He acknowledged that it may be hard for investors to believe in such a rally, especially given XRP’s recent performance. However, the historical context and current technical setup suggest that XRP could surprise the market once again.
Moonshilla also makes a broader case for XRP as a long-term investment. The analyst argues that XRP’s longevity—having been around for over 11 years—sets it apart from other assets, particularly the meme coins that have come and gone in a matter of days or hours.
He asked investors to secure a position in XRP, even if it’s a small one. The analyst suggests that the risk-reward ratio is too favorable to ignore, especially given the potential for a massive upside.
He believes that XRP could be the “true ticket to financial freedom.” When asked about his possible target for the future, Moonshilla noted that he imagines a price above $100. This would represent a minimum of 17,477% increase from XRP’s current price of $0.5689.
Disclaimer: This content is informational and should not be considered financial advice. The views expressed in this article may include the author’s personal opinions and do not reflect The Crypto Basic’s opinion. Readers are encouraged to do thorough research before making any investment decisions. The Crypto Basic is not responsible for any financial losses.
-Advertisement-

XRP’s current lackluster performance follows the general crypto market trend. Bitcoin (BTC) has fallen to $58,000, and the global crypto market cap has dropped 0.6% in 24 hours to $2.16 trillion.
Also Read: Ripple: Here’s When XRP Could Breach The $100 Mark
XRP witnessed a price surge last week after a settlement was reached in the fintech company’s lawsuit with the SEC. The lawsuit had presented significant hurdles to the cryptocurrency’s price over the last few years. The rally did not last very long as prices seem to have consolidated.
According to the analysts at Changelly, Ripple’s XRP token could breach the $0.70 level this weekend, hitting $0.741189 on Sunday, Aug. 18, 2024. A rally of about 32.3% would result if it hit $0.741189 from current price levels.
CoinCodex analysts’ price prediction also suggests that XRP will rally over the weekend. The platform anticipates the asset hitting $0.607 on Sunday, Aug. 18, 2024. At current prices, hitting $0.607 will entail a rally of about 8%.

Given the positive outcome of the SEC vs. Ripple lawsuit, XRP may pick up the pace over the next few weeks.
Also Read: Ripple: How High Can XRP Go If Bitcoin Hits $100,000?
There is also much talk about launching an XRP ETF soon, which could vastly help XRP’s price hit new highs.
In a post on X today, CryptoTank expressed his hope that everyone will take the time to research and acquire XRP before the low-cost opportunity disappears.
He emphasized the potential for XRP to significantly impact the financial futures of those who invest wisely, urging followers to share their research with loved ones.
Furthermore, CryptoTank advised XRP investors to tune out detractors, warning that they could sow doubt about the asset’s prospects. He framed XRP as a “once in a lifetime opportunity” to change the course of families’ lives for generations.
“It’s a once-in-a-lifetime opportunity to change the course of your families’ lives for generations if you invest wisely.”
Today, XRP costs $0.569 after its value declined by 7% over the past week. Optimists like CryptoTank, calling for research and investment in XRP, anticipate that the asset will be much more valuable in the coming months and years.
The optimism is founded on XRP’s potential to revolutionize global money movement by providing a faster, more efficient, and less expensive way to transfer funds across continents.
Supporters often highlight the vast scale of the cross-border payment market, which is projected to reach $300 trillion in the coming years. They theorize that if XRP were to handle just 1% of this market, its value could skyrocket.
For instance, if XRP were to process $5 trillion of the projected market, its price would be above $50 to ensure sufficient liquidity for such transactions. This translates to a return of over 8,670% for today’s investors.
Hopes on this hypothetical occurrence and the hope of global central banks adopting XRP as a reserve asset continue to fuel optimism about XRP’s future value.
However, over the past six years, XRP’s value has steadily declined rather than increased. In particular, it is currently trading at a staggering 85% below its 2018 ATH. Proponents believe the lower price counts as an opportunity to buy XRP cheaply, as they are convinced XRP will rise.
In response to CryptoTank’s call for XRP believers to educate others, many acknowledged having tried to inform family members but admitted that their efforts have largely fallen on deaf ears.
“I have, brother. But I have been ridiculed and dismissed mostly,” recounted X user Tyler. “That’s what I have been doing for the past few years. No one believes me. They don’t see it,” lamented Cristian.
This dismissive reaction is likely due to XRP’s stagnant price over the past six years, which has frustrated many holders. “I’m getting out of XRP, sick of it doing absolutely nothing,” one commenter said.
Disclaimer: This content is informational and should not be considered financial advice. The views expressed in this article may include the author’s personal opinions and do not reflect The Crypto Basic’s opinion. Readers are encouraged to do thorough research before making any investment decisions. The Crypto Basic is not responsible for any financial losses.
-Advertisement-
It’s been a week since the over three-and-a-half-year lawsuit involving XRP and Ripple concluded, but the price of XRP remains solidly around $0.56. XRP shredded 2% of its value over the past day and 6.4% over the last week.
Zooming out to a longer time frame, XRP is trading 10% below the value it sold for a year ago. Despite this long-running unimpressive price action, crypto analyst Amonyx has boldly asserted that XRP is instead loading what he describes as “massive green God candles.”
Taking to X recently, he shared a weekly chart of XRP suggesting the asset could stage giant green candles over an eight-week period, or 56 days. During this period, he expects XRP’s value to rise by an astonishing 11,745% to a $57 price level.

Notably, crypto analysts often infer the emergence of a “God candle” after an extended period of suppression or pressure build-up, where an asset has been consolidating at a lower range. They expect these giant candles to compensate for the built-up pressure from the days of underperformance.
Meanwhile, Amonyx is not the first analyst to cite the potential emergence of a “God candle” on XRP’s weekly timeframe. A few weeks ago, analyst DustyBC issued a similar observation, but his expectation was for XRP to attain $30.
It has been nearly three months since this bullish observation, and XRP has not completely broken free from the $0.5 range it was in when DustyBC made the suggestion.
Interestingly, market participants have taken note of this unfulfilled forecast and other similar projections. This has led to doubts around Amonyx’s latest proposition of an incoming God candle.
“Maybe one day someone will be correct,” remarked X user Xeowold. Another commenter named Scott sarcastically noted that if he had a dollar for every time someone has made this prediction in the last four years, he would already be a multi-millionaire.
Meanwhile, commenter Mehmetemin Tekin highlighted a crucial point by noting that XRP and Ripple just triumphed in a nearly four-year legal battle that threatened their existence. Yet, XRP’s price has remained unchanged, as if nothing significant happened.
“Unfortunately, if XRP is $0.58 despite winning the court case, there is no reason for it to rise from now on,” Tekin submitted.
Disclaimer: This content is informational and should not be considered financial advice. The views expressed in this article may include the author’s personal opinions and do not reflect The Crypto Basic’s opinion. Readers are encouraged to do thorough research before making any investment decisions. The Crypto Basic is not responsible for any financial losses.
-Advertisement-
ADA, the native coin of the Cardano blockchain, has underperformed the broader cryptocurrency market over the past week. The global cryptocurrency market cap surged by over 25.44%, adding more than $431 billion since August 5, fueled by bullish news such as Solana ETFs being approved in Brazil and Russia legalizing crypto mining.
 | TradingView - The Crypto Basic")
Despite these market-wide gains, Cardano’s price action has been lackluster. ADA’s price rose modestly from $0.28 to $0.33, achieving just a 21% gain. Over the past three days, ADA’s price has stagnated around the $0.33 level, yet recent data suggests that demand for ADA is on the rise.
After three days of price stagnation, growing market demand could soon propel ADA into a significant breakout. On-chain data reveals an influx of buy orders for ADA this week, which could be a precursor to a bullish move.
Exchange Order Books, which track buy and sell orders, typically show bullish signals when buy orders outweigh sell orders.
 | TradingView - The Crypto Basic")
The chart above indicates total buy orders amounting to 198.86 million ADA, compared to 161.42 million ADA in sell orders. This excess demand, valued at approximately $67.5 million at the current average price, underscores the bulls’ growing influence in the market.
Two factors suggest that this could be bullish for ADA in the coming days. First, the sheer volume of buy orders indicates strong market confidence in ADA’s potential upside. Second, the accumulation of ADA at current levels could create a solid support base, making it more difficult for bears to push the price lower.
Although Cardano has been consolidating, technical indicators suggest a bullish outlook. The Keltner Channels indicator highlights that ADA is trading near its lower band, which often acts as a support level. If the price can maintain above this lower band, it could rise toward the middle band at $0.35, which serves as the next key resistance level.
 | TradingView - The Crypto Basic")
A break above $0.35 would likely attract more buying interest, potentially driving ADA toward the upper Keltner band at $0.43. However, should ADA fail to hold its current support at $0.28, a retest of this level could occur before any upward movement.
In conclusion, while ADA’s recent performance has been underwhelming, growing market demand and bullish technical indicators suggest that a breakout to $0.35 is achievable in the near term.

