The main tag of cryptocurrency price today Articles.
You can use the search box below to find what you need.
[wd_asp id=1]
The main tag of cryptocurrency price today Articles.
You can use the search box below to find what you need.
[wd_asp id=1]
With a remarkable recovery in the last two weeks, the SOL price has increased by 40% from $131 to $184. However, the intraday pullback of 1.69% drops the current price of Solana to $181. Further, Solana ranks #5 with a $84.25B market cap and #3 in the DeFi world with a TVL of $5.39B.
The recent recovery in SOL price from the $130 demand zone results in a double bottom with a neckline at $185. Following the streak of four consecutive bullish candles, there is a high possibility of a breakout rally surpassing the $200 mark.
Further, the 75% hike in the trading volume to reach $3.25B bolsters the possibility of an extended up move.
Technical Indicators:
RSI: The daily RSI line hits a borderline overbought zone with a massive jump in the last few days. However, the lack of bearish divergence increases the uptrend chances as the demand continues to grow rapidly in this recovering market.
DMI: The uptick in the ADX line following the bullish crossover of the VI lines bolsters Solana’s breakout chances.
Retracing the correction phase with the Fibonacci levels, the double bottom neckline is just 15 points shy of the $200 level. Currently, the ongoing recovery is likely to surpass the overhead neckline and unleash the trapped momentum to exceed $200.
As per the Fibonacci levels and the double bottom pattern, the uptrend in the Solana price can reach the $250 mark.
“Sell-the-News” is a trading phenomenon that occurs when traders rapidly sell an asset in the wake of a positive event, in hopes of cashing in on the markets’ euphoric reaction.
Looking at the chart above we see that bears have mounted $704 million leverage SHORT contracts against ETH. Worryingly, this has now exceeded active ETH LONG futures contracts, which currently stands at $394 million at the time publication of July 21.
The downward pressure from ETH SHORT trades exceeding LONGs by over $300 million, partly explains why Ethereum price failed to advance above the $3,600 territory, while falling behind BTC over the weekend,
However, it remains to be seen if Joe Biden bowing out of the 2024 Presidential Campaigns race would spur spot market demand when the US markets open on Monday July 22.
As Ethereum hovers around the $3,450 mark, technical indicators suggest a cautious outlook for the week ahead.
The Bollinger Bands on the daily chart show a contracting range, indicating lower volatility and a potential consolidation phase. The upper band at $3,631.12 and the lower band at $2,852.28 outline critical resistance and support levels, respectively.
This article represents the opinion of the author and is not to be construed as financial advice.
Ripple’s XRP may be one of the most undervalued currencies in the blue-chip blockchain economy. That’s due to XRP’s legal success against the SEC and its product development.
Could XRP price be gearing up for a moonshot bull run sometime in Q3?
XRP price analyst Egrag Crypto raised the staggering specter of a $17 XRP price sometime in the near future if Ripple bulls beat key resistance at $1 and keep it running to XRP’s all-time high price of $3.50.
That’s very bullish, but not unheard of in crypto markets. Actually, similar performances are not uncommon at all in blockchain investing. They happen with shocking frequency in altcoin markets. Of course, it’s worth noting that they happen a lot less often with large-cap cryptocurrencies which boast total capitalizations in the billions, like XRP does.
If the Egrag XRP price prediction comes true, it would represent a 39.5x gain over Tuesday’s average Ripple price on exchanges.
Ripple has done these kind of numbers before. For example, when it reached its historic all-time high price of $3.50 in Jan. 2018, it skyrocketed there in under 60 days, from the $0.15 handle in Nov. 2017.
That represented a gain of over 23x the Nov. 2017 level for XRP in under two months.
Here are six important factors that markets are evaluating over the past weeks:
The U.S. Securities and Exchange Commission sued Ripple Labs, its founder, Chris Larsen, and its CEO, Brad Garlinghouse, in Q4 2020.
So the SEC Ripple lawsuit has been raging for years, but finally showed signs of settling last summer when a sweeping series of legal wins came one after another until the end of last year.
Ripple Labs could finally resolve the years-long SEC lawsuit soon.
A positive or even less-damaging resolution could finally remove the overhang that XRP has been under for the past years and help it perform well, especially in bullish market conditions.
What the market doesn’t know yet, telling by the XRP price performance against competitors like Solana, is that this cryptocurrency for banks is about to break out in the DeFi space with its smart contract issuance layer, XRP ledger.
According to a recent X post by a16z-backed blockchain developer group EasyA app founder Dominic Kwok, 134,000 developers are learning about Ledger on his company’s app. Talk about an XRP army.
Meanwhile, X crypto analyst CryptoGeek reported, “The XRP Ledger is expected to manage $30 to $50 trillion by 2025, with transactions likely shifting to the CTF Token, the primary DeFi token on the #XRPL.”
While those figures may seem astonishing, the SWIFT international payments system used by financial institutions like those Ripple serves processes some $5 trillion a day in transaction volume.
One very exciting development for Ripple, which could have a positive impact on XRP price, is growing interoperability with Ether. That’s because Ethereum is the current DeFi leader in Web3. Meanwhile, there’s an EVM (Ethereum Virtual Machine)/XRP Ledger side-chain incoming!
In May, interchain protocol Cosmos announced that Ripple and Ethereum Cosmos developer evmOS are partnering “to build an XRP Ledger EVM sidechain!”
“The sidechain will be built with evmOS – a production-ready modular solution that leverages Cosmos SDK, IBC, and CometBFT to bring EVM compatibility to Web3 businesses,” Cosmos added.
That might be bullish for XRP price because the easier it is to use and spend your Ether to get service from an XRPL Dapp (decentralized application) or vice versa— the easier it is to spend your XRP tokens directly to the Ethereum Virtual Machine and pay for service— the more value your ETH and XRP tokens have on the market.
Moreover, XRP Ledger has made big strides in Korea and Japan this month.
Korea’s only licensed VASP (virtual asset service provider) recently announced integrations with XRP Ledger. According to a June 27 report that appeared on Investing.com:
“Infinite Block, the only South Korean crypto firm to secure a Virtual Asset Service Provider (VASP) license until now, has announced support for XRP Ledger (XRPL), the open-source, public blockchain designed by American fintech firm Ripple.”
Korea and Japan are among the most digitally engaged and conscious nations in the OECD (Organisation for Economic Co-operation and Development). Korean demand for cryptocurrencies has proven formidably insatiable. Higher fees than most places and government import controls have not been able to slow the East Asian country’s roll in Web3 adoption.
The Infinite Block partnership came as a result of Ripple Labs’ aggressive global expansion efforts. Earlier in June, Ripple announced the launch of its XRPL Japan and Korea Fund, to “provide support for a range of robust initiatives to foster innovation on the XRP Ledger in both countries.”
“The launch of this fund is a testament to Ripple’s strong belief in the potential of Japan and Korea as pivotal regional hubs for blockchain innovation,” Ripple Vice President of Strategic Initiatives Emi Yoshikawa said in a press release.
Ripple network transaction volume on XRPL saw a massive spike earlier this month to levels unseen since February, according to on-chain data.
Meanwhile, the number of whales or addresses holding large amounts of XRP (1 million or more) has grown markedly in 2024.
According to data from blockchain intelligence firm Santiment, that figure surged past 2,000 to 2,043 by July 4, a 4.3% increase in XRP millionaires for the year so far.
After buttoning up this SEC lawsuit, an IPO would likely chum up the waters for more whale-sized inflows to boost XRP price.
Just don’t expect it to happen on Wall Street, given that XRP is primarily a cryptocurrency for international payments among major financial institutions.
That’s especially so after the long, drawn-out hostile treatment the SEC has given Ripple Labs. The company’s CEO, Brad Garlinghouse, said in January and again last month that Ripple is actively exploring how to go public and issue shares in Ripple Labs to be traded on the international stock market.
The prices of some coins keep rising, while others have returned to the red zone, according to CoinMarketCap.Top coins by CoinMarketCap
The rate of Ethereum ![]() ETHUSD has almost remained the same since yesterday. Over the last week, the price has risen by 9.61%.Image by TradingView
ETHUSD has almost remained the same since yesterday. Over the last week, the price has risen by 9.61%.Image by TradingView
On the hourly chart, the price of ETH has made a false breakout of the local support level of $3,483. If the daily bar closes near it, one can expect a blast to the $3,450 zone shortly.Image by TradingView
On the bigger time frame, one should pay attention to the nearest level of $3,547. If a breakout happens, the accumulated energy might be enough for a continued upward move to the $3,600-$3,700 range.Image by TradingView
From the midterm point of view, bulls are trying to hold the gained initiative.
If the weekly candle closes around the current prices, traders may witness a further rise by the end of the month.
Ethereum is trading at $3,502 at press time.
Bulls are trying to keep most coins in the green zone, according to CoinStats.
The rate of XRP has fallen by 1.45% over the last 24 hours.
Such a statement is also confirmed by the falling volume. In this regard, sideways trading in the zone of $0.57-$0.61 is the more likely scenario.
XRP is trading at $0.5827 at press time.
About the author
Denys Serhiichuk
Solana price traded near seven-week highs on Saturday, hitting $172.13 after rising by 0.4 percent at the time of writing. SOL has been on a strong upside momentum in July, with its monthly gains standing at 15.6 percent so far. Furthermore, it has registered substantial gains in the last week rising by 21 percent- the largest gain by any crypto asset in the top 10. Solana’s performance this year has seen its ecosystem grow significantly, with its native meme coins like Dogwifhat (WIF), Bonk and Book of Meme (BOME) registering scintillating growth to build the strong upbeat sentiment around the Solana chain.
The Solana price action has been above the Bollinger Band signal line for the last week. In addition, it has recently broken above the upper band, underlining a strong buying momentum. The Relative Strength Index (RSI) also calls for further upside, as it reads 64 on the daily chart as of this writing.
Notably, Solana’s 50-MA crossed above the 200 MA back in late October 2023, and it has never crossed below that mark since that time. In addition, the current price is well above the 50-MA ($148.17) and the 100 MA ($150.44). These figures not only signal Solana’s strong buying momentum in the current crypto market upturn, but also points to its resilience to stay up above critical support levels.
However, the current SOL price is still some way below the YTD high of $210, and a stronger momentum will be needed to hit that mark. On the double bottom pattern shown on the chart below, we can see that the near-term resistance will likely come at the $180 mark. A break above that mark could potentially clear the way for a move to retest YTD in the coming days. Meanwhile, the current price is well above the critical $125 support mark.
Solana price will likely continue on the upside if SOL stays above the $168.50 pivot mark. The first resistance will likely come at 170.70 mark, but extended control by the buyers could break above that mark and send SOL higher to test $182.00. Conversely, a move below 168.50 will favour the sellers to take control. In that case, the first support could come at $166.97, but extended control by the sellers could strengthen the downside momentum to breach that level and test $165.50. Also, such a momentum will invalidate the downside narrative.
This post was last modified on Jul 20, 2024, 11:45 BST 11:45
Bulls are more powerful than bears at the beginning of the weekend, according to CoinMarketCap.
DOGE has gained a lot of value today, rocketing by 6.05%.
If it happens near it and with no long wick, the accumulated energy might be enough for a breakout followed by a blast to the $0.1350 area.
DOGE is trading at $0.1271 at press time.
About the author
Denys Serhiichuk
Disclaimer: The opinions expressed by our writers are their own and do not represent the views of U.Today. The financial and market information provided on U.Today is intended for informational purposes only. U.Today is not liable for any financial losses incurred while trading cryptocurrencies. Conduct your own research by contacting financial experts before making any investment decisions. We believe that all content is accurate as of the date of publication, but certain offers mentioned may no longer be available.
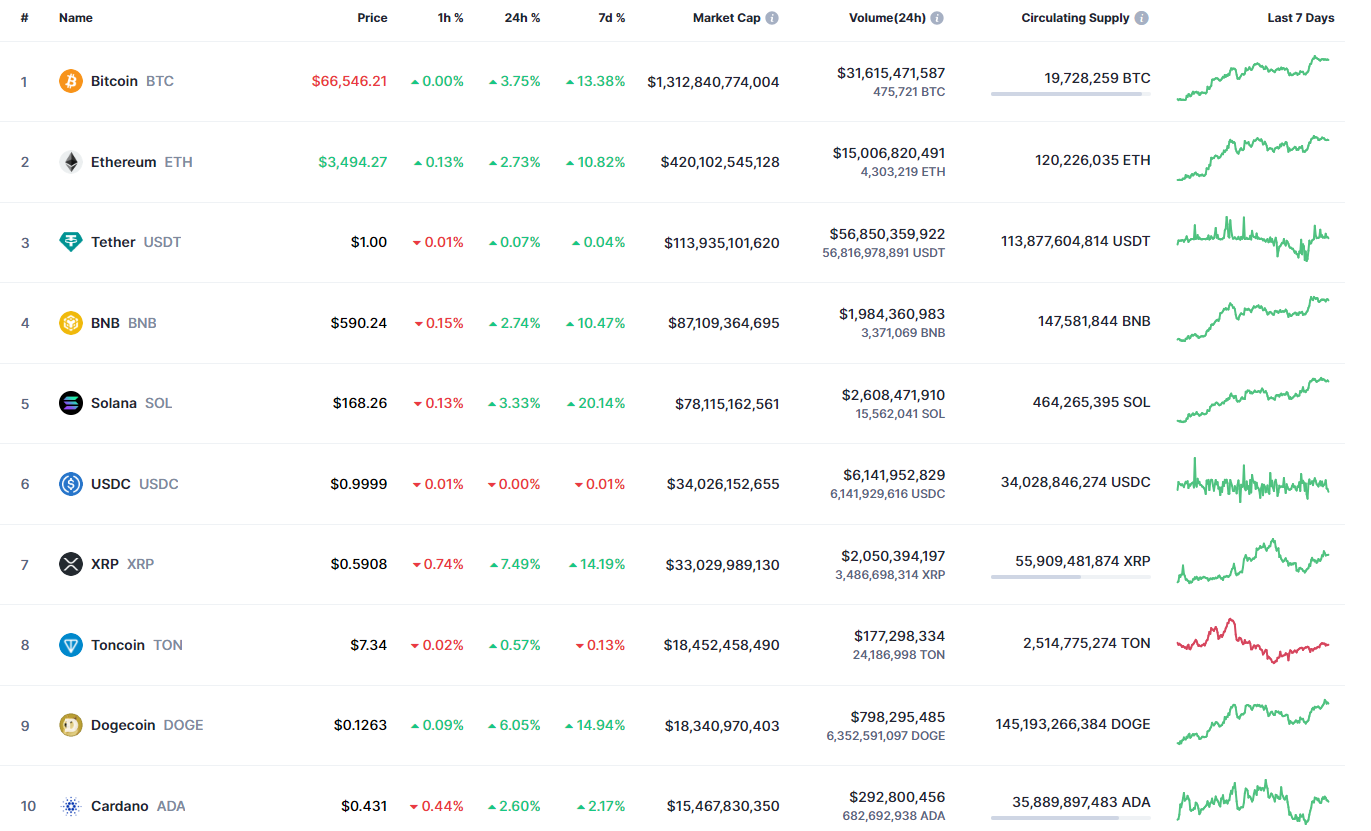
DOGE has gained a lot of value today, rocketing by 6.05%.
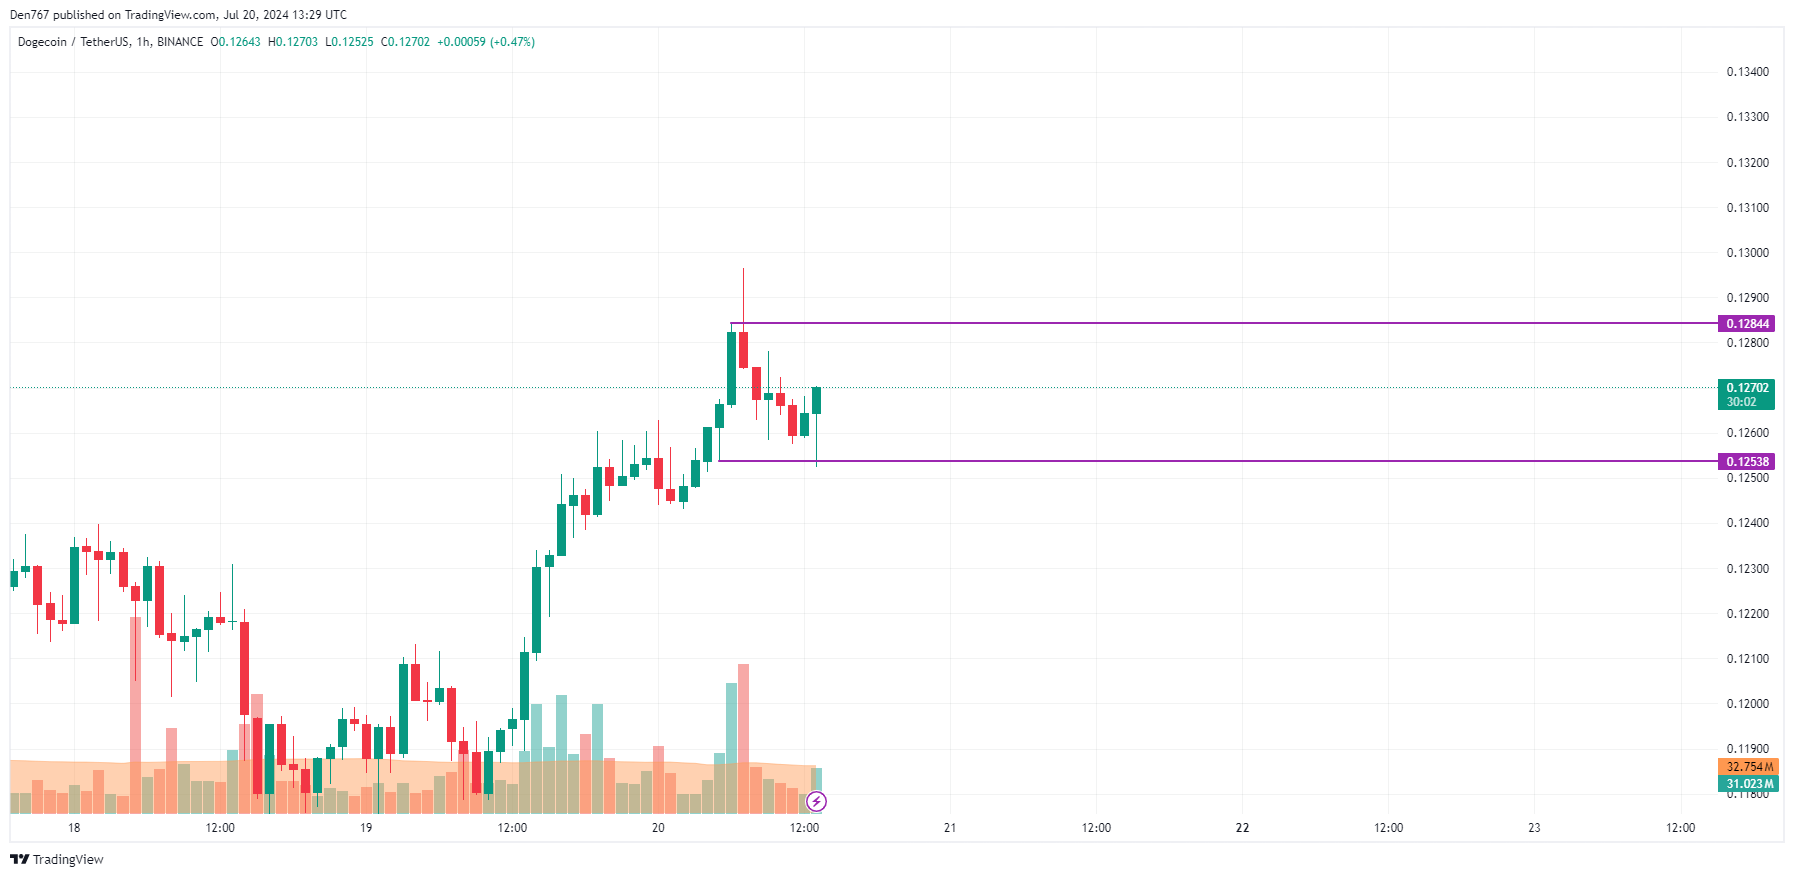
On the hourly chart, the price of DOGE has bounced off the local support level of $0.1253. If the daily bar closes far from it, the upward move may continue to the $0.13 area by tomorrow.
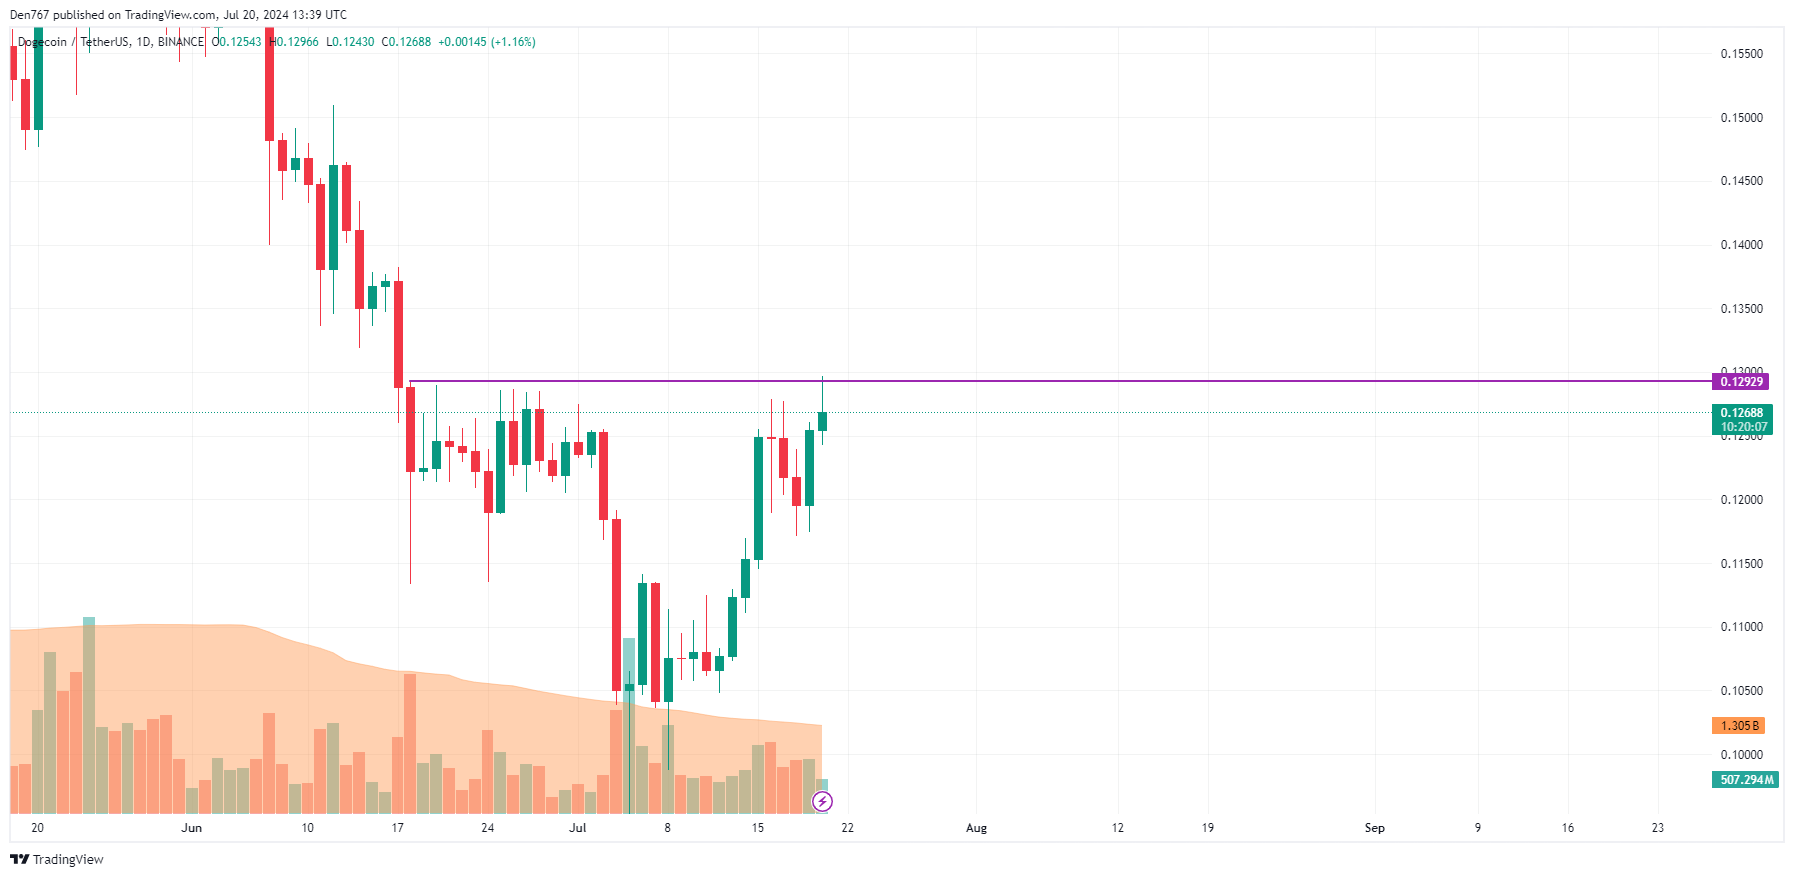
On the bigger time frame, one should pay attention to the candle closure in terms of the $0.1292 level.
If it happens near it and with no long wick, the accumulated energy might be enough for a breakout followed by a blast to the $0.1350 area.
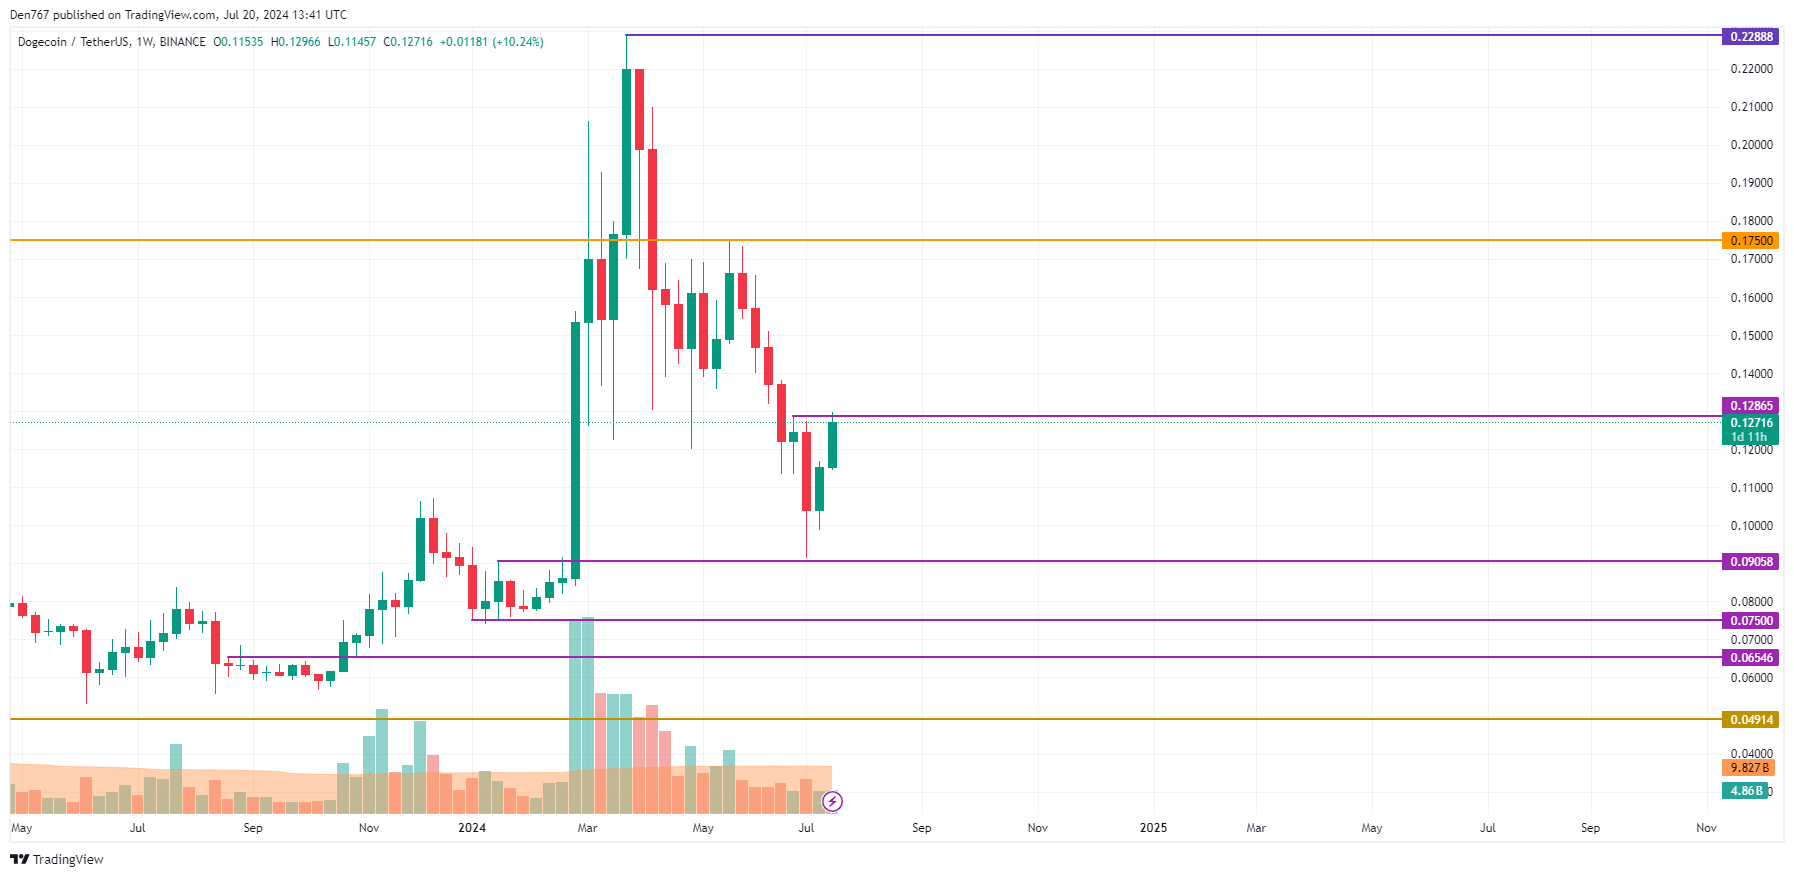
From the midterm point of view, bulls are trying to seize the initiative. If the weekly bar closes around the current prices, traders may expect a continued rise to the $0.14 mark next week.
DOGE is trading at $0.1271 at press time.
The Cardano price prediction highlights a potential breakout that could see the top ten smart contracts token break the stubborn resistance at $0.6 on the day to achieve a milestone above $1.
This bullish analysis comes when Bitcoin price has renewed the push for $70,000 following a temporary mid-week setback that confirmed support at $64,000.
BTC currently holds above $65,500 on Saturday, up 4% in 24 hours. The bullish wave spread across the entire spectrum of altcoins with Ethereum rising to $3,488 boasting a 2.6% growth.
Solana had dropped to $168 after peaking above $170. SOL maintains a 4% increase in 24 hours. XRP is among the biggest gainers, soaring 8% to $0.59. The uptick in altcoin prices was reflected in the total market cap’s 4% growth to $2.54 trillion, according to CoinGecko data.
Traders are eager to see the next move in Cardano price after testing support at $0.315. The recovery witnessed this week reclaimed key levels at $0.35 and $0.4.
ADA price exchanged at $0.436 as bulls battled to bring down a confluence resistance around $0.46 formed by two Exponential Moving Averages (EMAs); the 50-day and 20-day.
A falling wedge pattern’s resistance coincides with the confluence point, implying that bulls must be deliberate in their quest to sustain the uptrend over the weekend and into next week.
Two downward-slopping trend lines form the falling wedge. The volume reduces as the price drops, while sellers become weary and bulls increase accumulation.
Breaching the upper trend line validates the wedge upon which traders place buy orders. The Cardano price prediction hints at a 47% breakout target, equal to the pattern’s height.
The Moving Average Convergence Divergence (MACD) gearing up for a buy signal on the weekly chart supports the bullish Cardano outlook.
With the Relative Strength Index (RSI) climbing to 46 in the neutral region, the path of least resistance remains upwards. A break from the RSI bearish divergence above the descending trend line would affirm the bullish thesis.
Traders should hold on until ADA tops the confluence resistance and overcomes the wedge pattern trend line before going all-in or adding to their long positions.
Some key achievements likely to signal the continuation of the uptrend include movement above the $0.5 and $0.6 levels. Although Cardano price prediction shows the potential for a $1-bound rally, ADA will closely follow the general sentiment in the market.
Related Articles
Cardano boasts a layered architecture, peer-reviewed code, and a focus on scalability, security, and sustainability, aiming to address blockchain’s limitations and rival established platforms.
Recent data from Santiment reveals that the XRP network activity has reached its highest levels since March. Two key indicators: Network Growth and Daily Active Addresses, have shown significant spikes:
Based on the analysis of this increase in both Network Growth and Daily Active Addresses, which suggests a surge in both new users and activity from existing users, the XRP price should have surged as well. Specifically proven, on July 18, the surge in new addresses and users that interacted on the network was reflected in XRP price surge of over 18% and by 9% alone over the past 24 hours.
Such spikes are crucial for sustaining price rallies, as increased traffic provides the necessary momentum. Historical data indicates that rallies failing to attract attention typically fizzle out quickly. Therefore, the current surge in network activity may bode well for XRP’s ongoing recovery.
Despite the positive on-chain metrics, XRP price has faced some resistance, dropping back to $0.55 after briefly surpassing $0.63. However, the increased network activity suggests a foundation for potential price stability and future growth.

The overall strength of the cryptocurrency market, particularly Bitcoin’s performance, has contributed to XRP’s recent rebound. Additionally, recent U.S. economic data and speculation about Federal Reserve rate cuts have positively influenced market sentiment. A slowdown in inflation, evidenced by lower annual Consumer Price Index (CPI) figures, has raised hopes for interest rate cuts starting in September, potentially boosting investor confidence in cryptocurrencies like XRP.
Technically, XRP faces a resistance point around the $0.5835 level, as indicated by current trendlines and the Relative Strength Index (RSI) positioned at 51. The 50-day Exponential Moving Average (EMA) also validates this resistance. Should XRP price remain below this threshold, a pursuit of the bearish trend is likely. Therefore, a cautious approach would be to consider selling below $0.5835 to avoid further declines.


")


