The main tag of cryptocurrency price today Articles.
You can use the search box below to find what you need.
[wd_asp id=1]
The main tag of cryptocurrency price today Articles.
You can use the search box below to find what you need.
[wd_asp id=1]
Cardano [ADA] continued its downtrend on the price chart. Cardano’s price prediction has been bearish on the higher timeframes since mid-April when the support level at $0.56 was lost. In the second half of June, bears showcased their intent once again.
The mid-April low at $0.4 failed to hold as support, and the price was hovering ominously around it. A push could send the prices tumbling. What is the next target for the sellers from here on?

Source: ADA/USDT on TradingView
The range that ADA had maintained from December 2023 to May 2024 was broken and flipped to resistance. Based on the Fibonacci levels plotted during the March price decline, we can see that the next target for the bears is the 23.6% extension level at the $0.3 support level.
The daily timeframe technical indicators were also bearish. The RSI tried to poke its head above neutral 50 recently but faced rejection, cementing the bearish momentum.
The OBV was also in a persistent downtrend.
This signified strong selling pressure and the lack of buying volume, making it more likely that prices will fall toward $0.3 next.
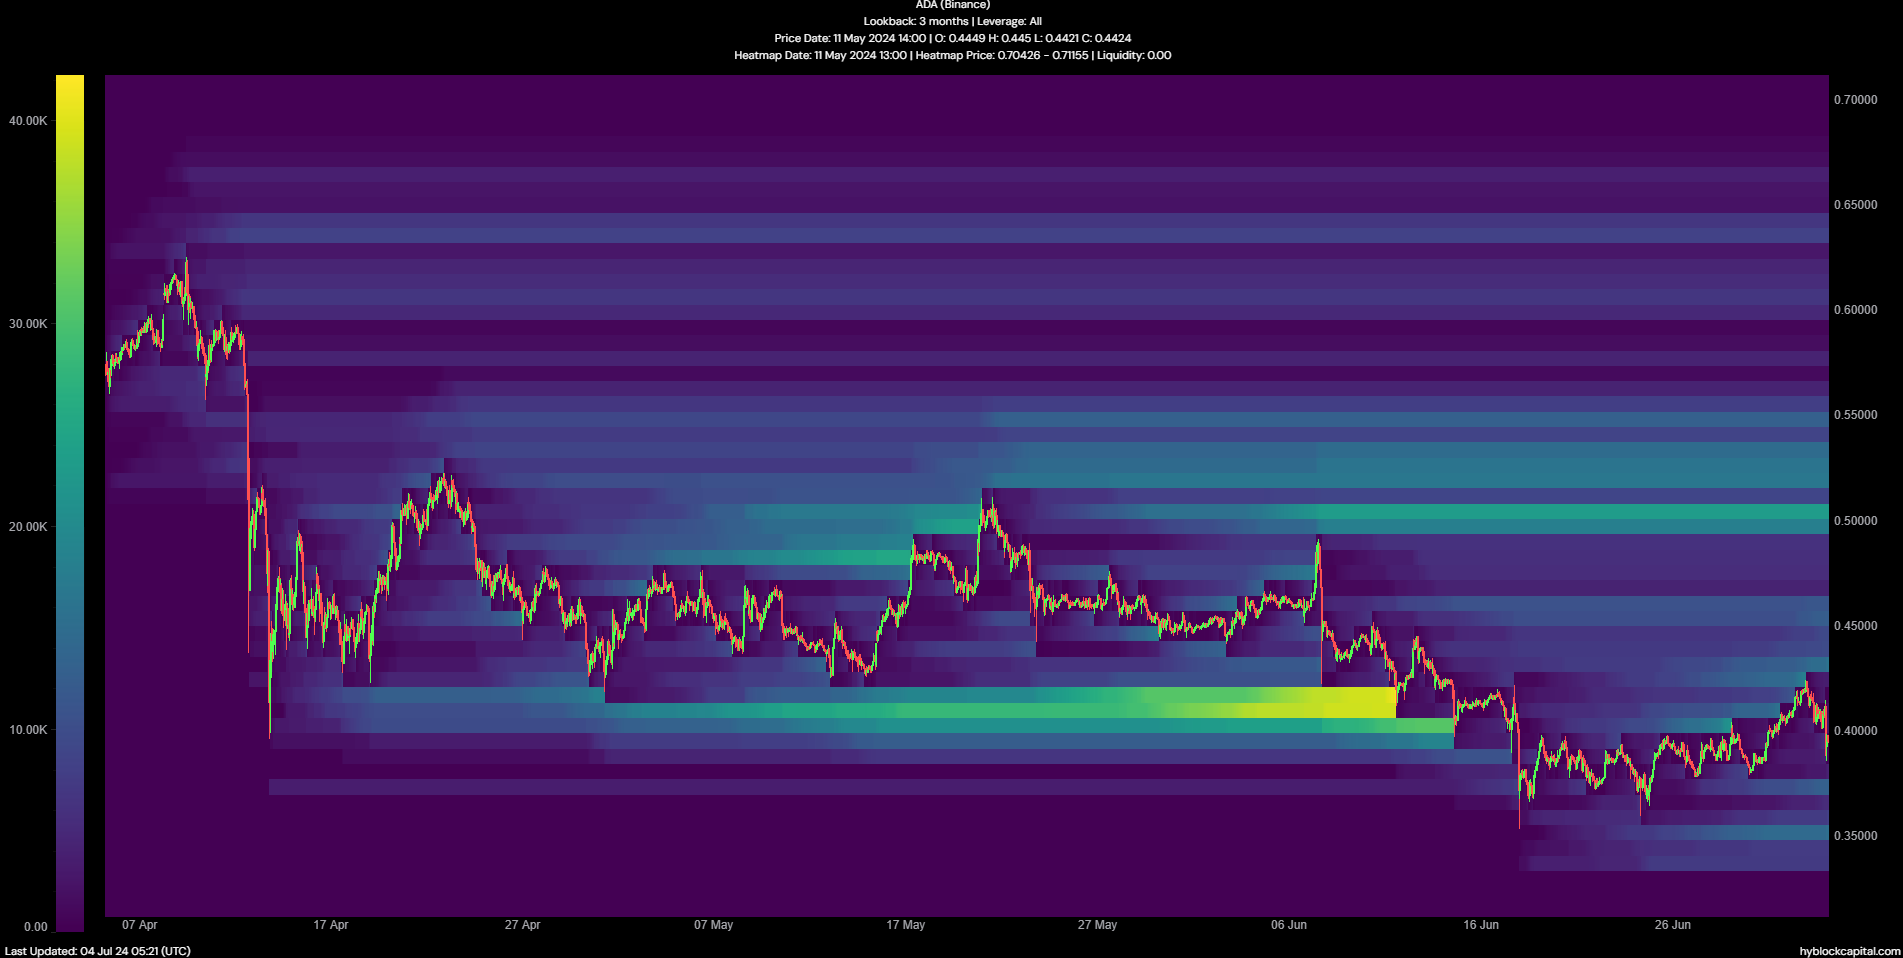
Source: Hyblock
In early June, the $0.4-$0.415 region was a pocket of liquidity with a huge number of liquidation levels. It was tested as support and eventually ceded to the selling pressure. Over the past ten days it has been flipped to resistance.
Read Cardano’s [ADA] Price Prediction 2024-25
The liquidation heatmap showed some liquidity building up at $0.427, just above the recent high. The $0.35 was also a zone of interest in the short-term.
It is possible that ADA prices could oscillate between the $0.42-$0.37 levels to increase the liquidity above these two zones before collecting them in a few weeks.
Disclaimer: The information presented does not constitute financial, investment, trading, or other types of advice and is solely the writer’s opinion.
The current market cap stands at approximately $16 billion, according to CoinMarketCap data. This downturn is reflected in the increased trading volume, which surged 113% within the same period, signaling heightened activity among traders.
Over the past week, DOGE price has decreased by 7% and 30% in the past 30-day period, reflecting broader volatility in the cryptocurrency market. This trend underscores the fluctuating investor sentiment and market dynamics affecting meme coins. Doge price has seen market correction and fluctuation, trading between $0.12 and $0.11.
The meme coin Dogecoin has experienced a significant decline, paralleling trends in major cryptocurrencies like Bitcoin, Ethereum, and XRP. DOGE has now fallen about 55% from its yearly peak and stands 84% below its record high. This drop occurs alongside a slump in newer meme coins such as Pepe, Dogwifhat, Bonk, and SHIB.
Despite the downturn, BitMEX has recently introduced the MEMEMEX Basket Index, which aggregates leading meme coins into a single trading entity. This index, the meme coin equivalent of the S&P 500, enables traders to engage with these assets through a USDT-margined contract. It offers up to 25x leverage and incorporates prominent names like Dogecoin, SHIB, and PEPE.
Dogecoin is currently experiencing a downward trend. If it falls below its current level, the price might dip under $0.11. This decline could pave the way for Dogecoin to reach the $0.1 support level. If market conditions worsen, The meme coin could see the cryptocurrency dropping to $0.09. This would suggest that sellers are overwhelmingly controlling the market.
Conversely, if optimism returns, the Dogecoin price prediction could climb above $0.12 if optimism returns to the market. Breaking past this point may initiate a rise towards $0.15. Increased bullish momentum could push the price further, reaching the $0.2 mark. Such a move could transform its usual trading patterns, aiming for a high of $0.3.
The daily technical indicators for Dogecoin reveal notable trends in the cryptocurrency market. The Relative Strength Index (RSI) stands at 32, indicating that the coin might soon be approaching oversold territory. The Moving Average Convergence Divergence (MACD) shows a slight bearish momentum as the signal line remains above the MACD line.
The Bollinger Bands on the daily charts show a notable contraction, suggesting a potential period of decreased volatility or a forthcoming significant price move. The upper Bollinger Band is approximately $0.1353, while the lower band is about $0.1127. The Awesome Oscillator beneath the price chart shows red bars, reinforcing the bearish sentiment in the market.
Related Articles
Dogecoin was created by Billy Markus and Jackson Palmer in 2013. It began as a humorous commentary on the proliferation of alternative cryptocurrencies to Bitcoin.
Dogecoin (DOGE) is a cryptocurrency that started as a meme but has grown into the most prominent meme coin in the crypto world. It boasts a vibrant and enthusiastic community, and high-profile figures like Elon Musk have expressed support for it.
Yes, Dogecoin can be mined using a proof-of-work (PoW) algorithm, similar to the method used by Bitcoin.
As of the reporting time, Cardano price is currently at $0.3895 during the US sessions on Thursday, marking a 4% decrease in price based on CoinMarketCap data.
The current market capitalization stands at $13 billion, making it the 10th largest cryptocurrency in terms of market value. Despite the decline, trading volume has surged by over 7%, indicating a heightened activity level among traders.
Bitcoin and other leading cryptocurrencies have been caught between optimistic bulls and skeptical bears in a tug-of-war. However, for Cardano, the outlook might be more favorable than it appears. Despite a minor setback on the daily charts, ADA’s performance over the week remains robust, hinting at potential bullish momentum.
Cardano price has risen by over 2% in the last seven days, oscillating between $0.37 and $0.42. Over the past month, though, the token has been more turbulent, marking a 14% dip due to heightened volatility.
The conversation around ADA heated up when Charles Hoskinson, the creator of Cardano, addressed a controversial statement by BitBoy Crypto. The crypto influencer declared that Cardano’s ADA was “dead,” prompting a swift rebuttal from the community.
I remember when the point of cryptocurrencies was to replace institutions instead of acting out a scene from deliverance.
I guess I got to learn the banjo to make Ben happy. https://t.co/yLMj1qAE1T
— Charles Hoskinson (@IOHK_Charles) July 3, 2024
Noteworthy was the response from @cardano_whale on platform X. They labeled BitBoy Crypto’s remarks as “amusing” and challenged his rationale for dismissing a coin with active governance mechanisms as “dead.”
Cardano is currently on a downward trend. With insufficient market support, the coin’s price risks further decline. It may soon hit a support level at approximately $0.38. If the downward pressure continues, ADA might drop further to support at around $0.3. Intensified selling could push the price down to $0.2.
On the upper side, if ADA breaks through the resistance at $0.4, it could signal a bullish reversal. Such a move would likely push the price toward a key resistance point at $0.5. With continued bullish momentum, ADA’s value could potentially escalate to $1 during an upcoming rally.
The 24-hour technical indicators for Cardano depict a mild bearish trend. The Awesome Oscillator (AO) displays red bars below the zero line, suggesting the continuation of bearish momentum in the short term. The Average Directional Index (ADX) stands at 21.22.
The Moving Average Convergence Divergence (MACD) shows a bearish crossover, suggesting that the downward momentum may continue in the short term. The Relative Strength Index (RSI), currently at 41, hovers near the oversold territory, which could indicate a possible pivot or rebound in the near term if buying pressure increases.
Related Articles
Cardano was founded by Charles Hoskinson.
Yes, ADA holders have the opportunity to stake their coins to participate in transaction validation and earn rewards.
ADA introduces scalability and sustainability to the DeFi sector, presenting a significant challenge to Ethereum.
As the majority of assets in the cryptocurrency market have entered into a bearish phase, things are looking bleak for XRP (XRP) as well, with machine learning and artificial intelligence (AI) algorithms predicting that its troubles will not end in the next several weeks.
Indeed, XRP has been in the red on all of its observed charts, even though some crypto trading experts, like the pseudonymous Egrag Crypto, still cling to hope, arguing that the current period of bearish price performance is nothing more than a “natural” consolidation zone.
With this in mind, Finbold has consulted the advanced AI algorithm deployed by the crypto monitoring and forecasting platform PricePredictions, and it currently projects that XRP will continue to decline toward the end of this month, setting its price at $0.379972 by July 31, 2024.

In other words, if the AI’s predictions, relying on a combination of technical analysis (TA) indicators, like moving average convergence divergence (MACD), average true range (ATR), Bollinger Bands (BB), and others, turn out to be correct, it would represent a decline of 15.37% from XRP’s current price.
Meanwhile, related Ripple news, like the performance in its legal fight against the United States Securities and Exchange Commission (SEC), could have an effect on the XRP token at the center of this courtroom standoff as both sides throw motions and notices at each other and the court.
Specifically, in the most recent developments, the blockchain company has filed a notice of supplemental authority regarding the recent decision in the SEC’s case against one of the largest crypto exchanges in the world, Binance, in which the court observed problems with the regulatory agency’s current practices.
In response, the SEC referred to the Binance decision as “wholly irrelevant to the pending motion on remedies,” according to the court document shared by a defense attorney, former federal prosecutor, and popular commentator on the case, James K. Filan, in an X post on July 3.
Furthermore, the securities watchdog has argued that the decision in question “says nothing at all about Ripple’s conduct or the remedies that are proper for the violations this Court found,” adding that:
“More importantly, Ripple’s latest letter entirely omits (…) the portion of the ruling rejecting – like this Court did – the argument that the fair notice doctrine provides a defense to liability.”
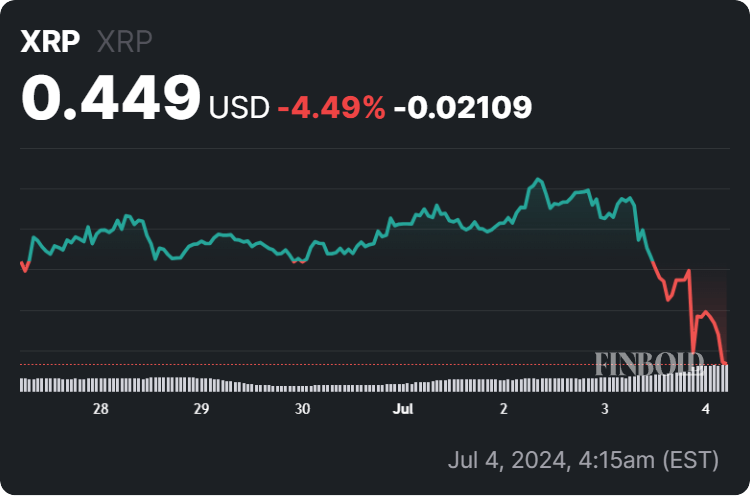
For now, the currently seventh-largest asset in the crypto sector by market capitalization is changing hands at the price of $0.449, recording a 6.79% drop in the last 24 hours, declining 4.49% across the previous seven days, and adding up to the loss of 13.42% on its monthly chart, as per data on July 4.
All things considered, XRP could continue to drop towards the price target set by the advanced AI algorithms, especially if it doesn’t receive any positive triggers like the possible end of Ripple’s legal saga in the blockchain company’s favor. That said, trends could easily change, so doing one’s own research is critical.
Disclaimer: The content on this site should not be considered investment advice. Investing is speculative. When investing, your capital is at risk.
Solana price fell along with the broader market, following Bitcoin’s drop late last night. The recent Bitcoin downturn is part of a 3-day price drop from $63,490 to its current $58,893. Solana took a hit and dropped from $155 to its current $136. Nevertheless, the SOL price remains above the 200-day simple moving average (SMA), which is a bullish indicator for the asset.
Despite the overall crypto market cap dropping by 4% to $2.29 trillion, Solana’s price action has not broken form, maintaining its symmetrical triangle formation. The asset found support at the 200-day SMA and seems to be bouncing back up.
The price of SOL must remain above $128 for the asset to continue to be bullish. Otherwise, a break below this level could result in further downside toward the $87 major support level. If bulls prevail and the SOL price bounces off the current 200-day SMA support, Solana may rise further in a 22% surge to hit $164, which coincides with the top trend line of the symmetrical triangle.
The prevailing trend before this chart pattern formed was upward. Zooming out, the symmetrical triangle becomes part of a bullish pennant chart formation, which has a high probability of resolving to the upside. This Solana price prediction shows a break above the symmetrical triangle may result in a further 37% price swing to put SOL’s price at $227, just 12% shy of the previous all-time high.
News of VanEck and 21Shares filing for a SOL ETF has rocked the crypto space. Crypto enthusiasts are calling for a Solana alt season if the ETF gets approval soon.
In the GSR Trading report on the ETF possibility score, Solana comes right below Ethereum with a 0.58 score against ETH’s 1.13. The rankings were based on decentralization and demand scores. According to the report, if a SOL ETF receives approval, the asset’s value could soar by 8,900% in this bull market.
Solana’s price analysis reveals an impressive bullish stance, even as Bitcoin price experiences a downturn. SOL’s growing adoption in the crypto market allows it to maintain positive momentum despite broader market trends. The continued resilience in price action is proof of its ecosystem growth, which attracts investor interest and may potentially set the stage for further gains.
Related Articles
Solana achieved its all-time high price of around $259.96 on November 6, 2021.
Solana has shown significant potential and continues to be considered a promising blockchain platform. Its high throughput, low transaction costs, and rapidly growing ecosystem have attracted attention from developers and investors alike. Many see Solana as a viable competitor to Ethereum, particularly due to its scalability and performance advantages.
Some of the best Solana wallets include, Sollet, Solfare, Trust Wallet and Ledger.
The bears’ pressure continues, according to CoinStats.
The price of Bitcoin (BTC) has dropped by 3.25% over the last day.
If the daily bar closes below the vital zone of $60,000, there is a high possibility to expect a test of $58,000.
From the midterm point of view, there are no reversal signals yet. If buyers cannot seize the initiative shortly, traders may expect a support breakout, followed by a move to the $55,000 range.
Bitcoin is trading at $60,311 at press time.
About the author
Denys Serhiichuk
The prices of the coins keep going down, according to CoinMarketCap.
The rate of Binance Coin (BNB) has declined by 3.31% over the last 24 hours.
If the bar closes near it, the accumulated energy might be enough for a breakout to the $530-$540 area.
BNB is trading at $559.3 at press time.
Cardano (ADA) has followed the drop of BNB, going down by 0.90%.
ADA is trading at $0.4091 at press time.
Solana (SOL) is not an exception to the rule, falling by 3.42%.
SOL is trading at $142.71 at press time.
About the author
Denys Serhiichuk
Disclaimer: The opinions expressed by our writers are their own and do not represent the views of U.Today. The financial and market information provided on U.Today is intended for informational purposes only. U.Today is not liable for any financial losses incurred while trading cryptocurrencies. Conduct your own research by contacting financial experts before making any investment decisions. We believe that all content is accurate as of the date of publication, but certain offers mentioned may no longer be available.

The price of Bitcoin (BTC) has dropped by 3.25% over the last day.

Despite today’s decline, the rate of BTC keeps looking bearish as it is on its way to the local support level of $59,544.
If the daily bar closes below the vital zone of $60,000, there is a high possibility to expect a test of $58,000.
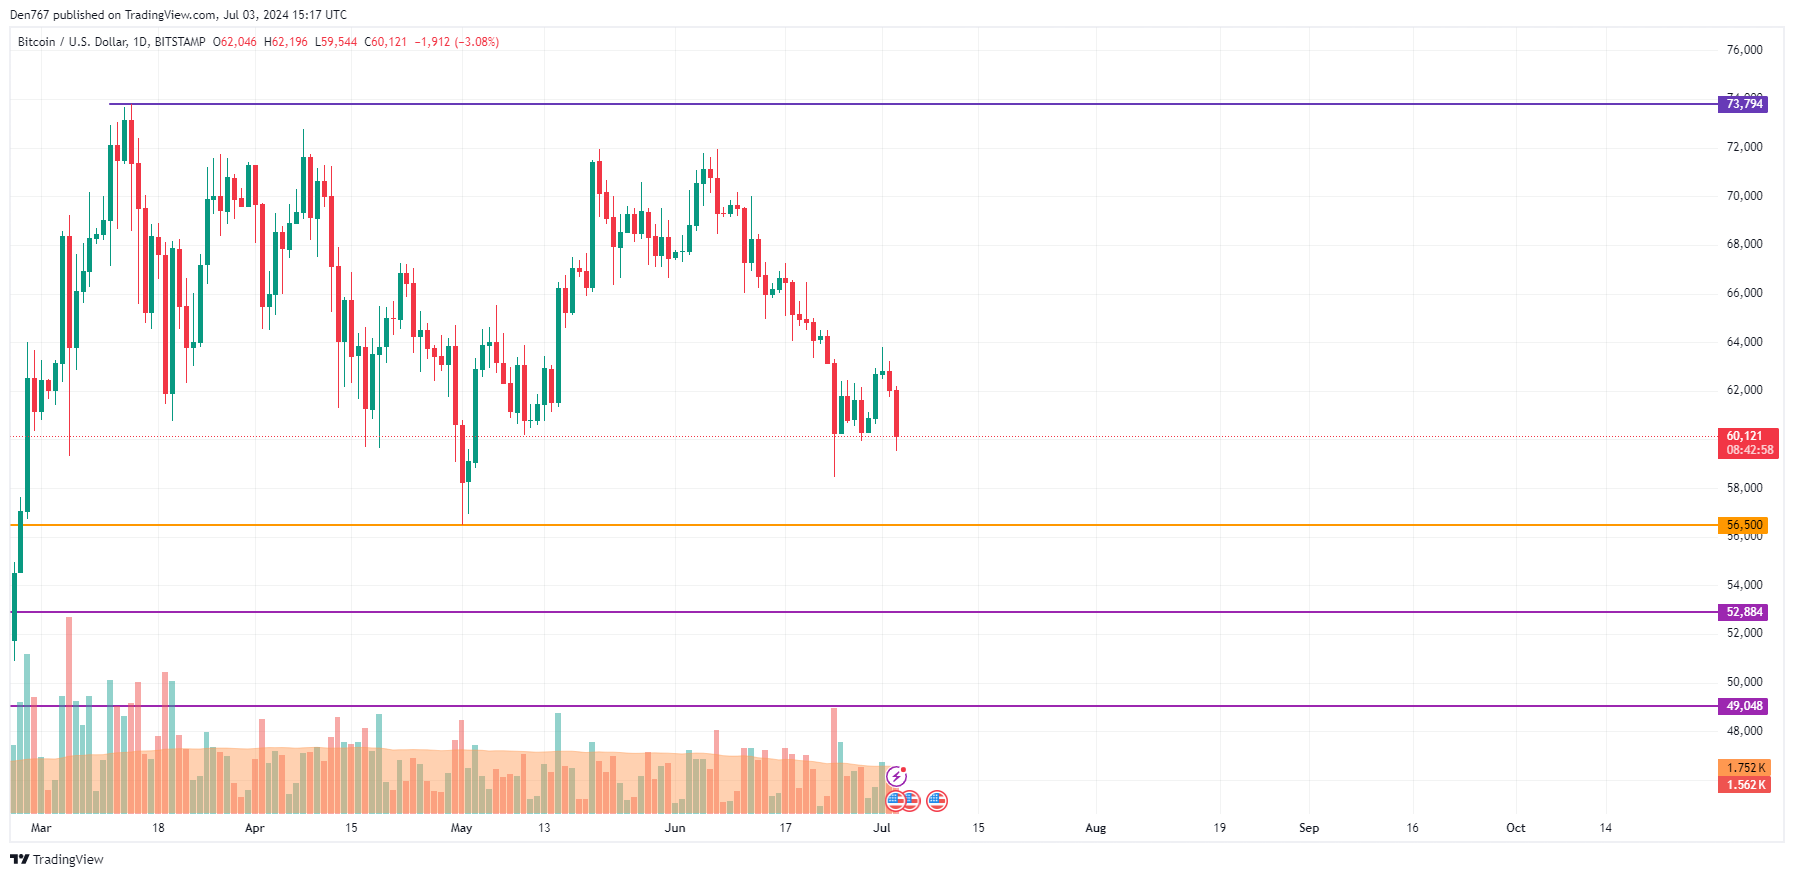
Sellers are also more powerful than buyers on the daily time frame. If the situation does not change until the end of the day and the bar closes near its low, the fall is likely to continue to the support of $56,500.
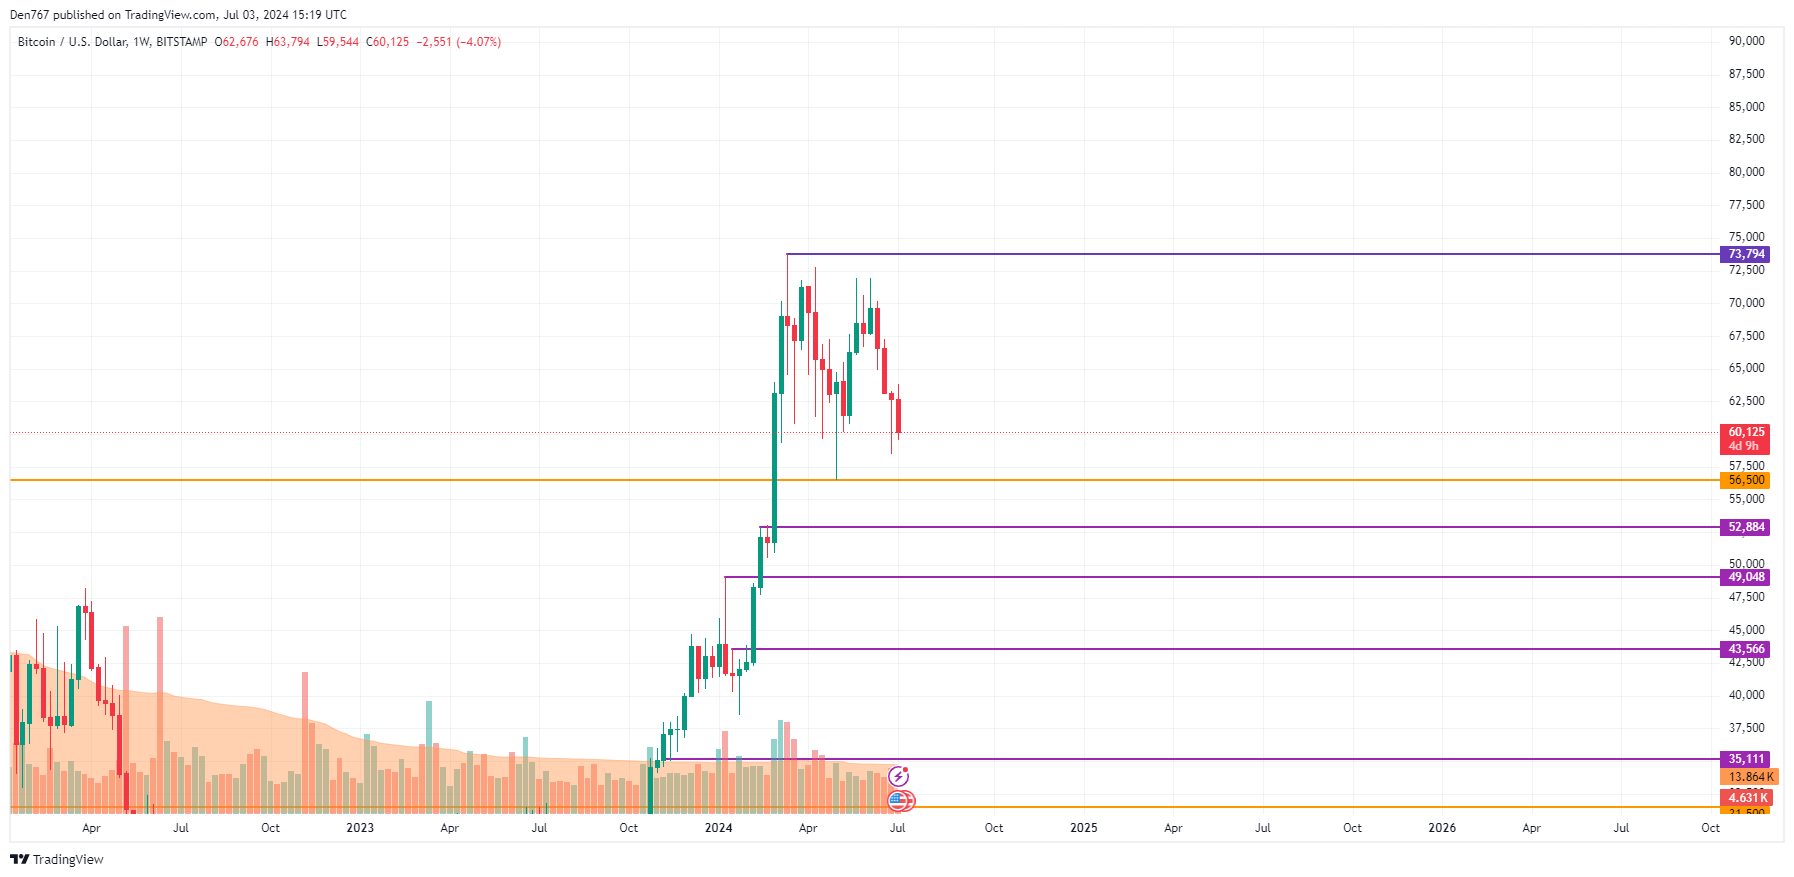
From the midterm point of view, there are no reversal signals yet. If buyers cannot seize the initiative shortly, traders may expect a support breakout, followed by a move to the $55,000 range.
Bitcoin is trading at $60,311 at press time.
The anticipation is at an all-time high! Are we finally going to get the verdict we have all been waiting for?
Pro-XRP lawyer Fred Rispoli forecasts that Judge Torres might announce the decision on remedies by July, with potential dates as early as July 13 or by the end of the month. The SEC is pushing for a hefty penalty of $2 billion, while Ripple counters that a fine of no more than $10 million is more appropriate.
Rispoli also suggests that a pre-judgment settlement is improbable, though some unresolved issues may still be subject to negotiation. Notably, July 13 holds historical significance for Ripple, marking the anniversary of Judge Torres’ pivotal decision declaring XRP not a security. This landmark ruling caused XRP’s price to surge dramatically, showcasing the market’s sensitivity to legal outcomes.
July 13 is notable in Ripple’s legal battle because it marks the anniversary of the landmark decision where Judge Torres declared that XRP is not a security. This decision caused XRP’s price to double in a matter of hours, highlighting the potential for significant market movements based on legal outcomes in this case. Rispoli’s suggestion of this date for the final verdict reflects hope for a similar positive turnaround for Ripple and its supporters.
The lawsuit has shifted from determining whether XRP is a security to debating the financial penalties Ripple must face. The SEC is seeking billions of dollars in damages from Ripple for what it claims were unregistered securities sales.
On the other hand, Ripple has argued that the SEC’s demands for damages are unreasonable and should be reduced to $10 million. The SEC has recently lowered its demand to $102 million, indicating a positive outcome for Ripple, but Ripple has turned down this request. The dispute over the damages is a critical phase in the lawsuit, as both sides maintain their legal arguments over the scale of financial penalties.
XRP is in a critical position after Ripple turned down the SEC’s offer to reduce its penalty to $102.6 million. This move could impact Ripple and the XRP token, which has already seen over $200 million in legal costs. Currently priced at $0.4830, XRP has risen 0.8% in 24 hours and 1.5% over the past week. With a 14% increase in trading volume to $862 million, XRP could see further gains if market sentiment remains positive.
Will July prove to be another historic month for Ripple? Only time will tell.
Disclaimer: The opinions expressed by our writers are their own and do not represent the views of U.Today. The financial and market information provided on U.Today is intended for informational purposes only. U.Today is not liable for any financial losses incurred while trading cryptocurrencies. Conduct your own research by contacting financial experts before making any investment decisions. We believe that all content is accurate as of the date of publication, but certain offers mentioned may no longer be available.

The rate of Binance Coin (BNB) has declined by 3.31% over the last 24 hours.
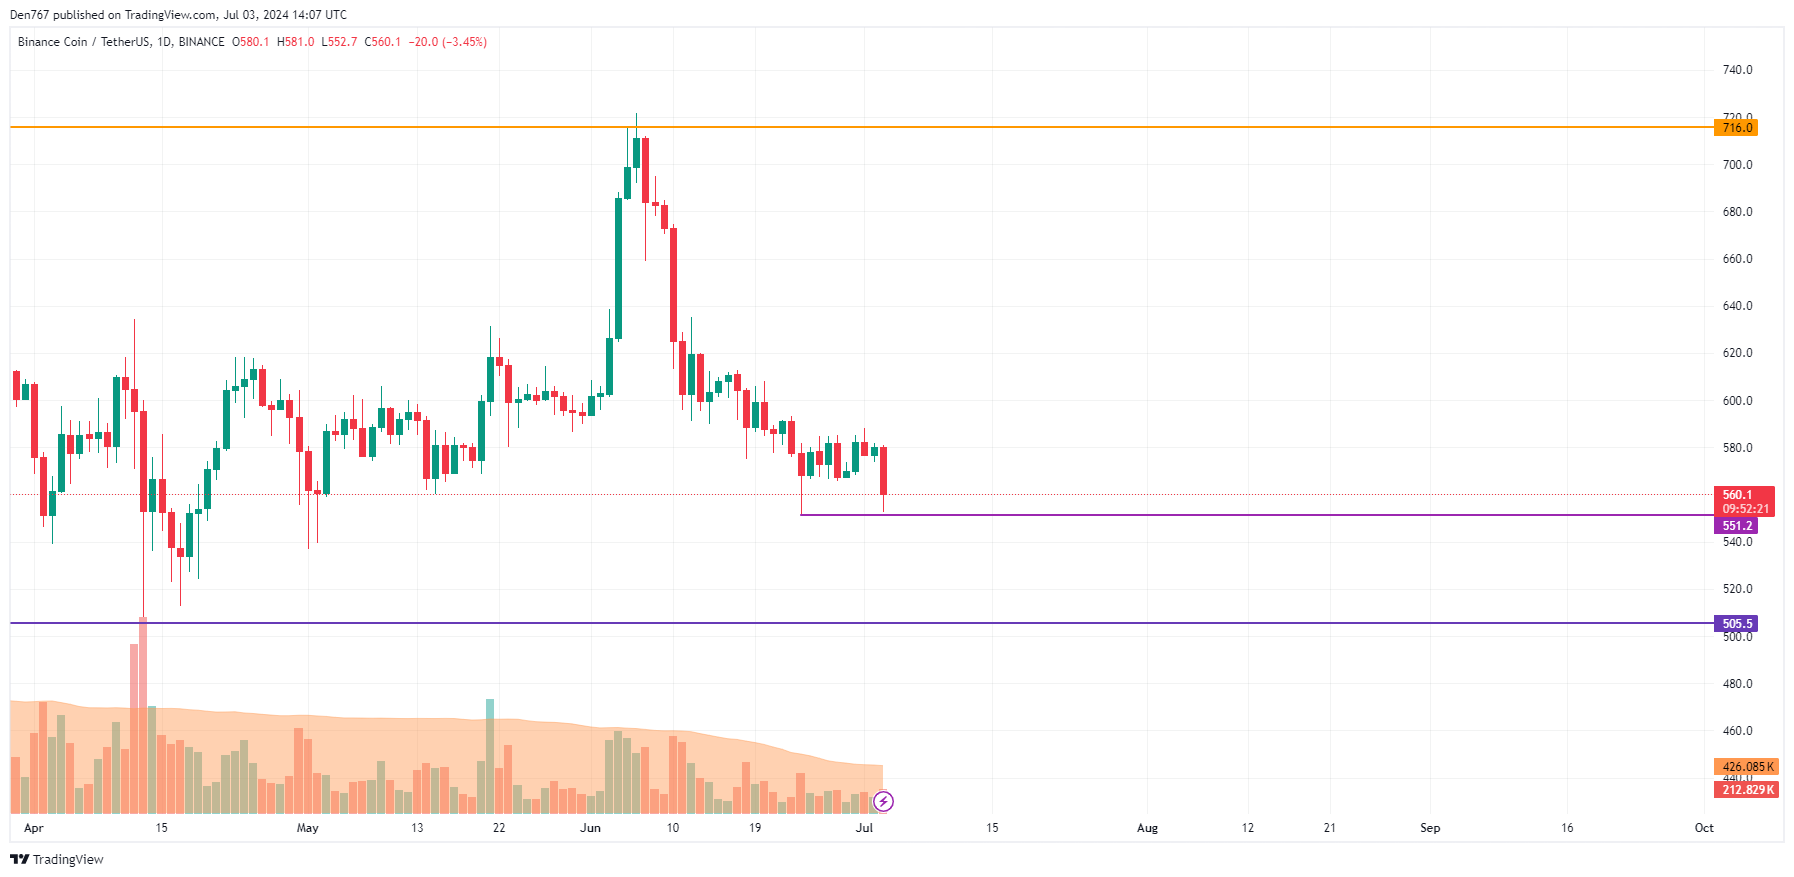
On the daily chart, one should pay attention to the candle’s closure in terms of the support level of $551.2.
If the bar closes near it, the accumulated energy might be enough for a breakout to the $530-$540 area.
BNB is trading at $559.3 at press time.
Cardano (ADA) has followed the drop of BNB, going down by 0.90%.

The price of ADA has made a false breakout of the resistance level of $0.4210. If the bar closes far from it, bears may again seize the initiative, which can lead to a decline to the $0.39-$0.40 range.
ADA is trading at $0.4091 at press time.
Solana (SOL) is not an exception to the rule, falling by 3.42%.

From the technical point of view, the rate of SOL has absorbed yesterday’s rise. If the candle closes around the current prices, there is a chance to see an ongoing correction to the $120-$130 zone.
SOL is trading at $142.71 at press time.


 Price Prediction for July 3")

