The main tag of cryptocurrency price today Articles.
You can use the search box below to find what you need.
[wd_asp id=1]
The main tag of cryptocurrency price today Articles.
You can use the search box below to find what you need.
[wd_asp id=1]
Ripple’s ongoing case is undoubtedly at the forefront of the cryptocurrency industry, and its outcome is likely to have an impact on the price of XRP.
However, analysts are taking the opportunity to forecast potential price points based on certain technical patterns, irrespective of the SEC lawsuit’s outcome.
One such analyst is EGRAG CRYPTO, who recently pointed out a bullish candle formation known as the quarterly hammer.
The analyst points out that based on this pattern, XRP needs to close the next three-month candle above $0.55 – $0.58 in the next ten days. This would pave the way for a “mega pump,” but given the current PA, it might be a bit challenging.
That would potentially complete the first Hammer formation and initiate a rally toward the $8 level, starting as soon as July.
But there’s more!
Well, the analyst takes the so-called Hammer formation even further, speculating that it would take about six months, but if the second hammer formation is completed, that would push XRP’s price to a whopping $27.
In any case, EGRAG CRYPTO confirms that the next ten days will be defining.
It’s worth noting, however, that XRP is trending within a confined range for the past few weeks and has so far been unable to escape it.
This makes the upcoming movement much more likely to be considerable, but we have yet to see if the bulls will be able to take control. The broader crypto market remains in a rather bearish trend and this might impact Ripple as well.
Though in the last 24 hours, a minor 1% recovery has been made in its price, the altcoin has a long way to go to maintain its position in the top 5 cryptocurrencies of the market.
Solana’s price was on the lower side for years, where it has crossed the $200 mark only once since the ATH years ago. That happened in the most bullish condition and seems a big challenge for now as the market is continuously dropping. In the week interval, the price is down by 8.57%. This drop comes as the network activity has been continuously declining. As a result, the last 24 hours trading volume has declined another 14% and is currently at $3,040,988,314, indicating the losing faith of investors.
The biggest threat to the Solana price is the increasing competition in the market. As explained by the former CEO of BitMEX, Arthur Hayes, Solana might not lead the base layer decentralized application in the upcoming years. Instead, he promoted Aptos as the next market leader instead of Solana.
BitMEX founder Arthur Hayes predicted in a video interview (38:25) that in the L1 competition, Aptos will flip Solana and become the number two L1. This will take one to three years, and he will reveal more details in September this year. https://t.co/t4bj4xCAB3
— Wu Blockchain (@WuBlockchain) June 17, 2024
The competition does not end here, as the layer2 blockchains
are upgrading and covering a major portion of the market. The Ethereum layer2 is on the verge of leading the industry, offering faster transactions at low cost while maintaining high security. This continuity can flip the layer1 blockchain like Solana soon.
Based on the ongoing price and factors pulling Solana back, analysts predicted a dump where the Solana price might drop to test support at $116. As it is in consolidation, the risk is higher for such falls. However, as Solana’s price began to recover today, and if it crosses the resistance around $157, an upsurge can happen for this cryptocurrency this time.
Solana is currently in a correction phase within a broader consolidation range. If price falls below $127, it may retest the significant support level at $116
If SOL can break the $157 resistance level, it could move towards the next target at $188 pic.twitter.com/guB7Uld3xP
— LaCryptoLycus🐺 (@CryptoLycus) June 18, 2024
As per the technical indicators, Solana is in complete bearish trends today, where the Relative Strength Index (RSI) is 37.26, an indicator of the overselling of this crypto. Moreover, the MACD (12,26) is -5.04, another prominent sign of the active bears in the market. The same is the case with the other technical indicators like Stochastic(20,3), ROC(20), CCI(20), Williamson%R(14), etc.
Furthermore, the simple and the exponential moving averages on the intervals of 5,10,20,50,100 hint at the bearish side dominating the other. Based on these, the probability of the drop is higher than any recovery. Analysts believe the Solana price can drop as low as $102, following a similar decline from 18 March to 13 April.
Continue Reading 5 Budget-Friendly Altcoins To Buy For Altcoin Season
Most of the coins are facing a bounce back, according to CoinStats.
The price of Bitcoin (BTC) has risen by almost 1% over the last 24 hours.
Bitcoin is trading at $64,263 at press time.
Ethereum (ETH) has followed BTC’s rise, increasing by 0.7%.
Ethereum is trading at $3,504 at press time.
XRP is not an exception to the rule, going up 0.43%.
XRP is trading at $0.4871 at press time.
DOGE is one of the biggest gainers today, rising by 2.22%.
On the daily chart, the price of DOGE is growing after yesterday’s bearish closure. If the candle closes above $0.1257, the upward move may continue to the resistance level of $0.12929 shortly.
DOGE is trading at $0.1251 at press time.
The rate of SHIB has increased by 0.68% over the last 24 hours.
The price of SHIB is far from the main levels. However, if today’s bar closes above yesterday’s candle peak, traders can expect a bounce back to the $0.00001893 level next week.
SHIB is trading at $0.00001811 at press time.
The rate of Cardano (ADA) has followed the rise of other coins, going up by 1.63%.
From the technical point of view, one should focus on today’s bar closure in terms of yesterday’s high.
If it happens above it, the accumulated energy might be enough for a test of the resistance level.
ADA is trading at $0.3887 at press time.
The rate of Binance Coin (BNB) has gone up by 1.04%.
Despite today’s slight rise, the price of BNB remains rather more bearish than bullish as it is located near the support level of $580. If a bounce back does not occur soon, one can expect a breakout, followed by a downward move to the $570 area.
BNB is trading at $587 at press time.
About the author
Denys Serhiichuk
Bitcoin BTCUSD retail on-chain accounts are demonstrating interest in buying the orange coin at current prices. The metric has been surging during the last few weeks and has already added 7%, which can be treated as positive signal, the analyst says.
Bitcoin ![]() BTCUSD retail investors’ demand surging as price tumbles
BTCUSD retail investors’ demand surging as price tumbles
Amid the prolonged decline of the Bitcoin ![]() BTCUSD price, interest in buying from accounts with up to $10,000 is surging, says macro analyst Axel Adler. This metric, which is a crucial one for BTC price prediction, has already added 7% compared to the local bottom reached in May.
BTCUSD price, interest in buying from accounts with up to $10,000 is surging, says macro analyst Axel Adler. This metric, which is a crucial one for BTC price prediction, has already added 7% compared to the local bottom reached in May.
As Bitcoin declines, there is a resurgence in demand from retail investors (+7%).
It’s too early to talk about a full recovery, but the signal is positive. pic.twitter.com/DaErcqB70k— Axel 💎🙌 Adler Jr (@AxelAdlerJr) June 22, 2024
In general, while Adler stresses that it is too low to say much about a recovery coming, the interest from the retail segment should be interpreted as a positive signal.
Per his chart derived from CryptoQuant’s data, the dynamics of retail accounts’ interest might be correlated with the potential for price moves.
The local peak of retail demand was registered in mid-Q1, 2024, right after Bitcoin ![]() BTCUSD touched an all-time high above $73,738 on March 14, 2024.
BTCUSD touched an all-time high above $73,738 on March 14, 2024.
The analyst also highlighted that the rally of the first crypto will be back as crypto whales are interested in reinvesting their gains:
Undoubtedly, retail players will contribute to the market’s recovery, but there’s no need to worry about the market, no matter what happens, it will recover, as major players have the cash they obtained from sales in March.
Yesterday, the Bitcoin ![]() BTCUSD price plunged below $65,000 and reached mid-May levels. By press time, the largest cryptocurrency is changing hands at $64,262 on major spot exchanges.
BTCUSD price plunged below $65,000 and reached mid-May levels. By press time, the largest cryptocurrency is changing hands at $64,262 on major spot exchanges.
Proper Bitcoin ![]() BTCUSD recovery yet to come, Willy Woo says
BTCUSD recovery yet to come, Willy Woo says
Seasoned analyst and Bitcoin proponent Willy Woo is also sure that the price run for BTC is yet to come. He analyzed the hashrate dynamics and foresees the capitulation of inefficient miners.
I’ll break it down in simple terms.
When does #Bitcoin recover? It’s when weak miners die and hash rate recovers.
This one is for the record books as it’s taking a lot of time for miner capitulation post-halving.
Probably can thank ordinal inscriptions boosting profits. pic.twitter.com/19MB0b8mHO— Willy Woo (@woonomic) June 20, 2024
He highlighted that, historically, miners with cost-ineffective hardware (outdated ASICs of previous generations) have left the segment after halving events.
As the market matures and the net hashrate of Bitcoin ![]() BTCUSD surges, this time, the long-anticipated capitulation of miners has lasted longer than previously.
BTCUSD surges, this time, the long-anticipated capitulation of miners has lasted longer than previously.
However, the ending of this process (that has already been running for over 60 days) will signal an opportunity for the next phase of the BTC rally.
Dogecoin’s [DOGE] recent decline below the $0.13 resistance finally provoked a breakout from its classic descending triangle pattern on the daily chart. Soon after, the memecoin fell below its 200-day EMA and confirmed a rather long-term bearish sentiment.
Meanwhile, the altcoin’s funding rate also turned negative amid bearish pressure when a whale transferred over $10M worth of DOGE from an unknown wallet to Robinhood.
A potential reversal above the $0.13-level can turn the narrative around. At the time of writing, DOGE was trading at nearly $0.0122.

Source: TradingView, DOGE/USD
After witnessing over 150% gains in just a month, the previous bull run in March helped the bulls test the $0.22 resistance. The bears then quickly induced a downtrend over the next few weeks, especially as the market-wide uncertainties increased.
The reversal from the $0.13 resistance (then support) caused a consolidation phase on the charts. In the meantime, the resulting price movement resulted in a classic descending triangle structure on the daily timeframe. The recent break below this level confirmed the bearish bias as the coin touched its four-month low on 18 June.
A reversal above the 200 EMA near the $0.13 resistance can help the buyers provoke a near-term recovery. In this case, likely targets would lie around the $0.147-zone.
However, any reversal below the 200 EMA can invalidate the near-term bullish tendencies. In this case, the first major support level would be the $0.11-mark.
The Relative Strength Index (RSI) stood near the 30-level, which indicated a relatively oversold position. The buyers can expect a convincing reversal from these levels soon.
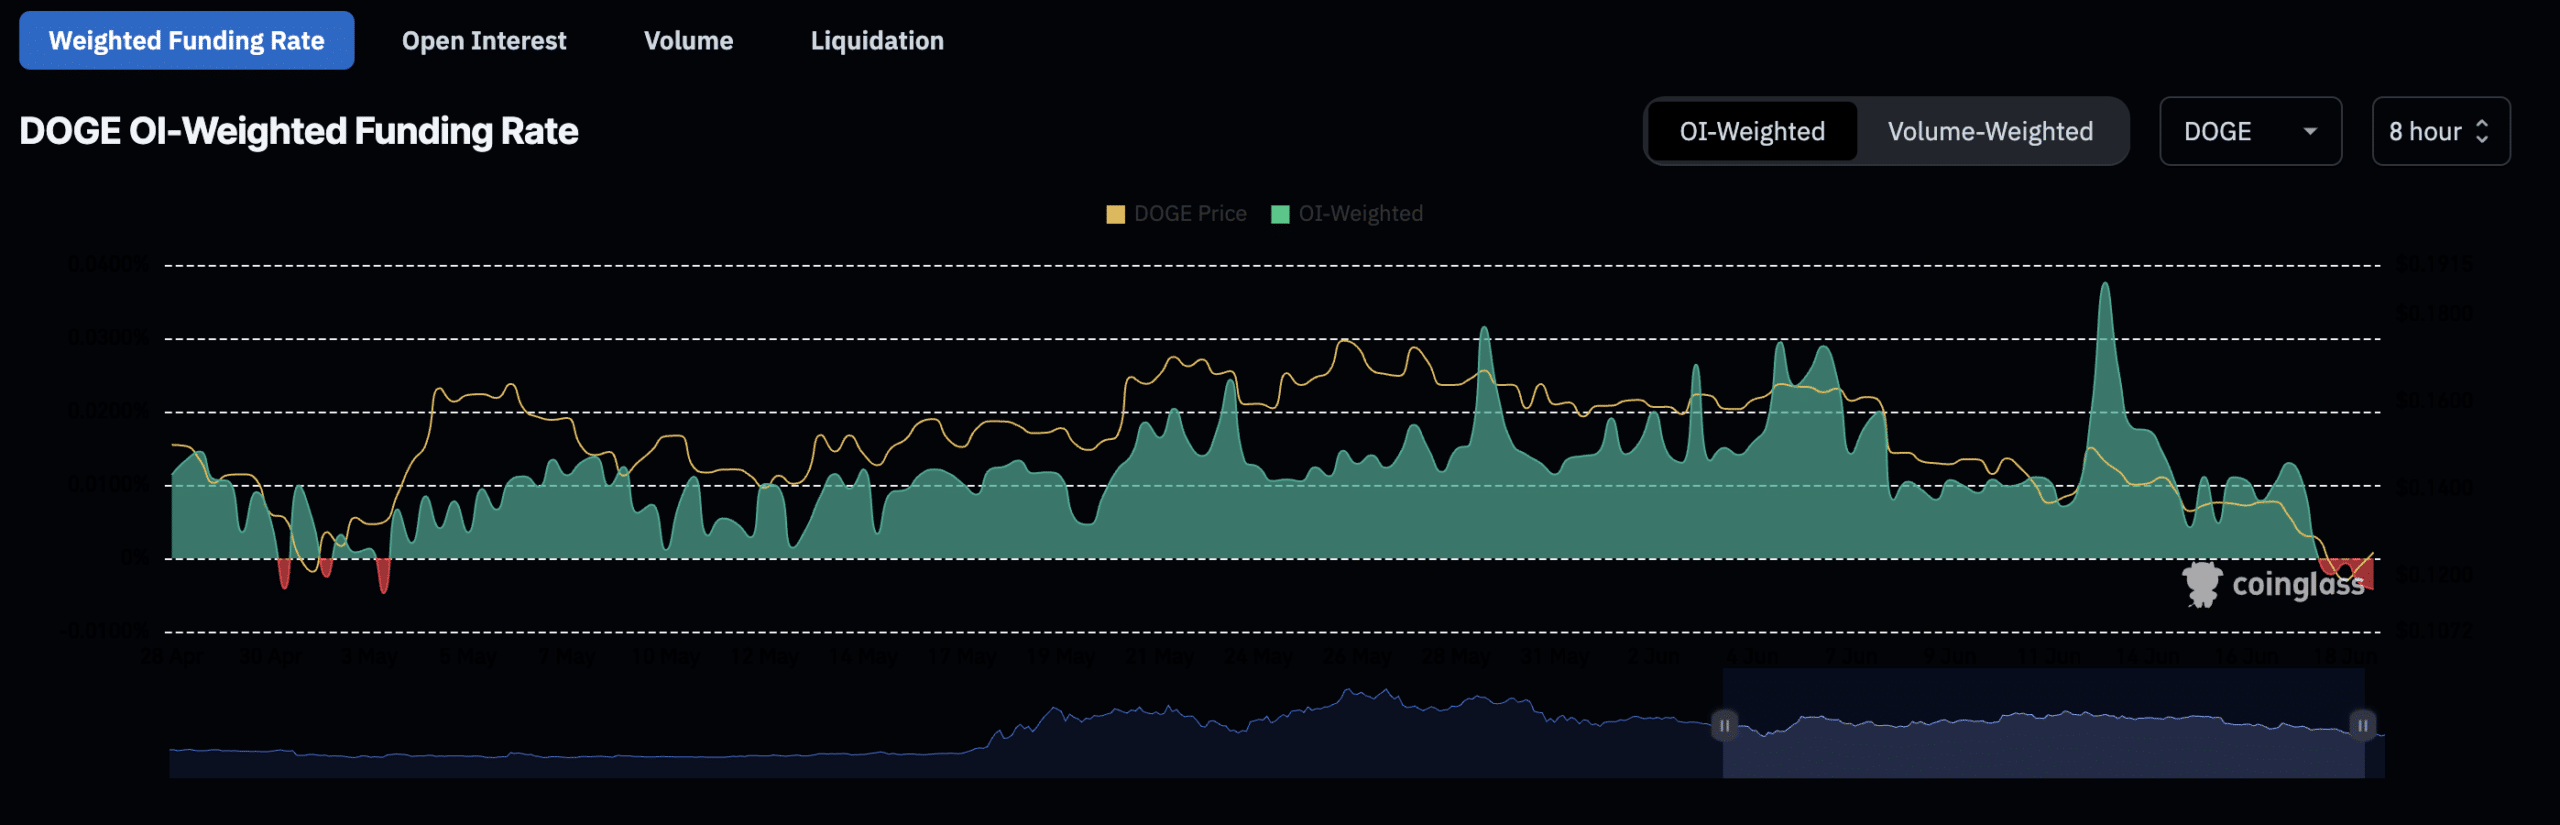
According to data from Coinglass, DOGE’s funding rate over the last few days has seen a steep decline. Here, it’s also worth noting that this level was last seen in May 2024.
Given the price action’s historical sensitivity to this metric, the price could further account for this decline in the coming days. However, this also means that any reversals on this front can help buyers recreate a bullish narrative.
DOGE shared a 75% 30-day correlation with Bitcoin at press time. So, Bitcoin’s movement is worth keeping an eye on, along with these technical factors.
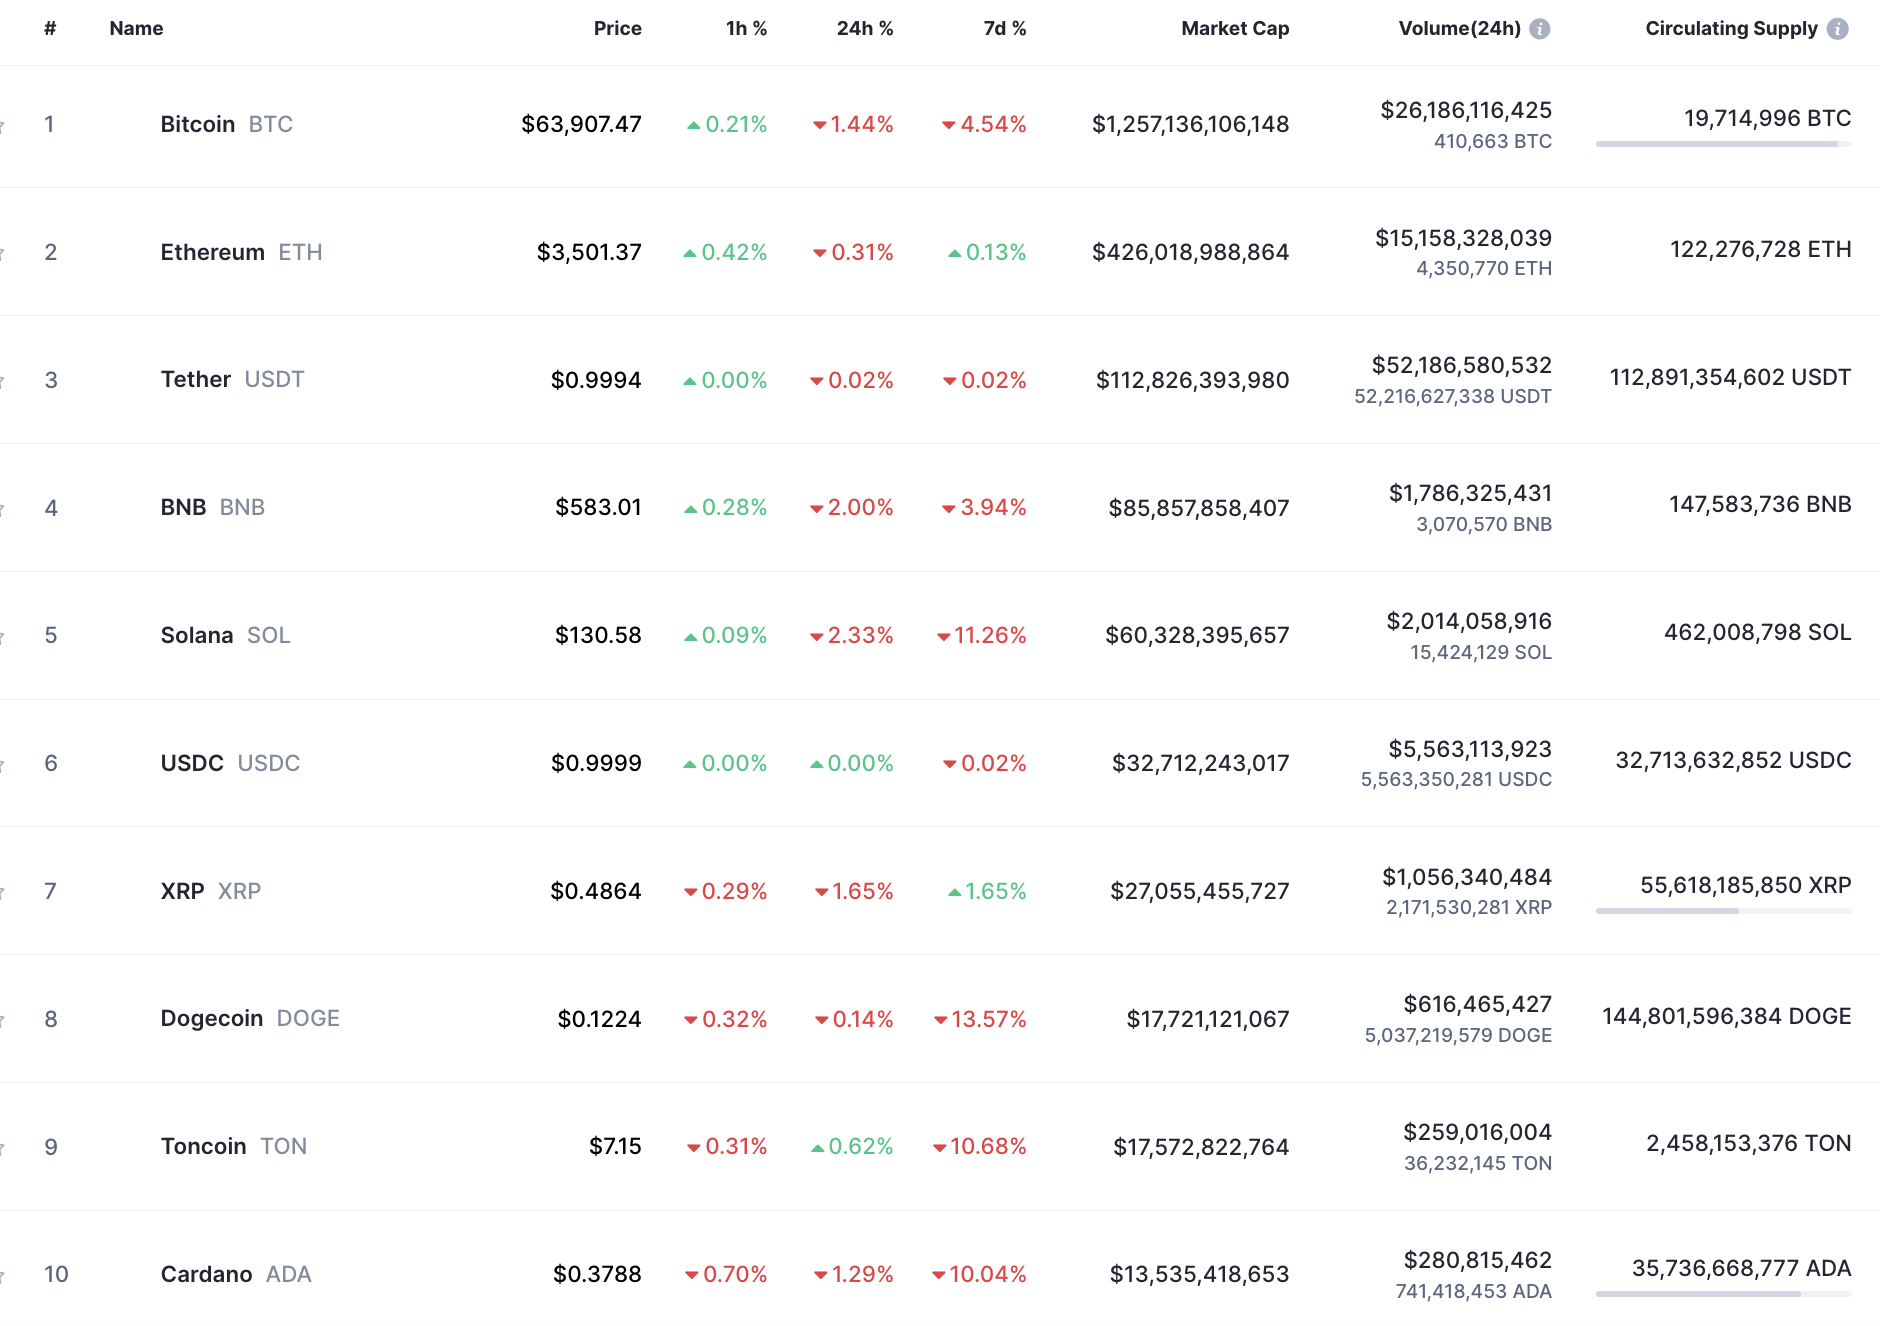
Most of the coins have not found a local bottom, according to CoinMarketCap.
The rate of Cardano (ADA) has dropped by 1.29% over the last 24 hours.
If sellers’ pressure continues, there is a possibility of seeing a breakout, followed by a further drop to $0.3575.
ADA is trading at $0.3826 at press time.
About the author
Denys Serhiichuk
Disclaimer: The opinions expressed by our writers are their own and do not represent the views of U.Today. The financial and market information provided on U.Today is intended for informational purposes only. U.Today is not liable for any financial losses incurred while trading cryptocurrencies. Conduct your own research by contacting financial experts before making any investment decisions. We believe that all content is accurate as of the date of publication, but certain offers mentioned may no longer be available.
The rate of Cardano (ADA) has dropped by 1.29% over the last 24 hours.
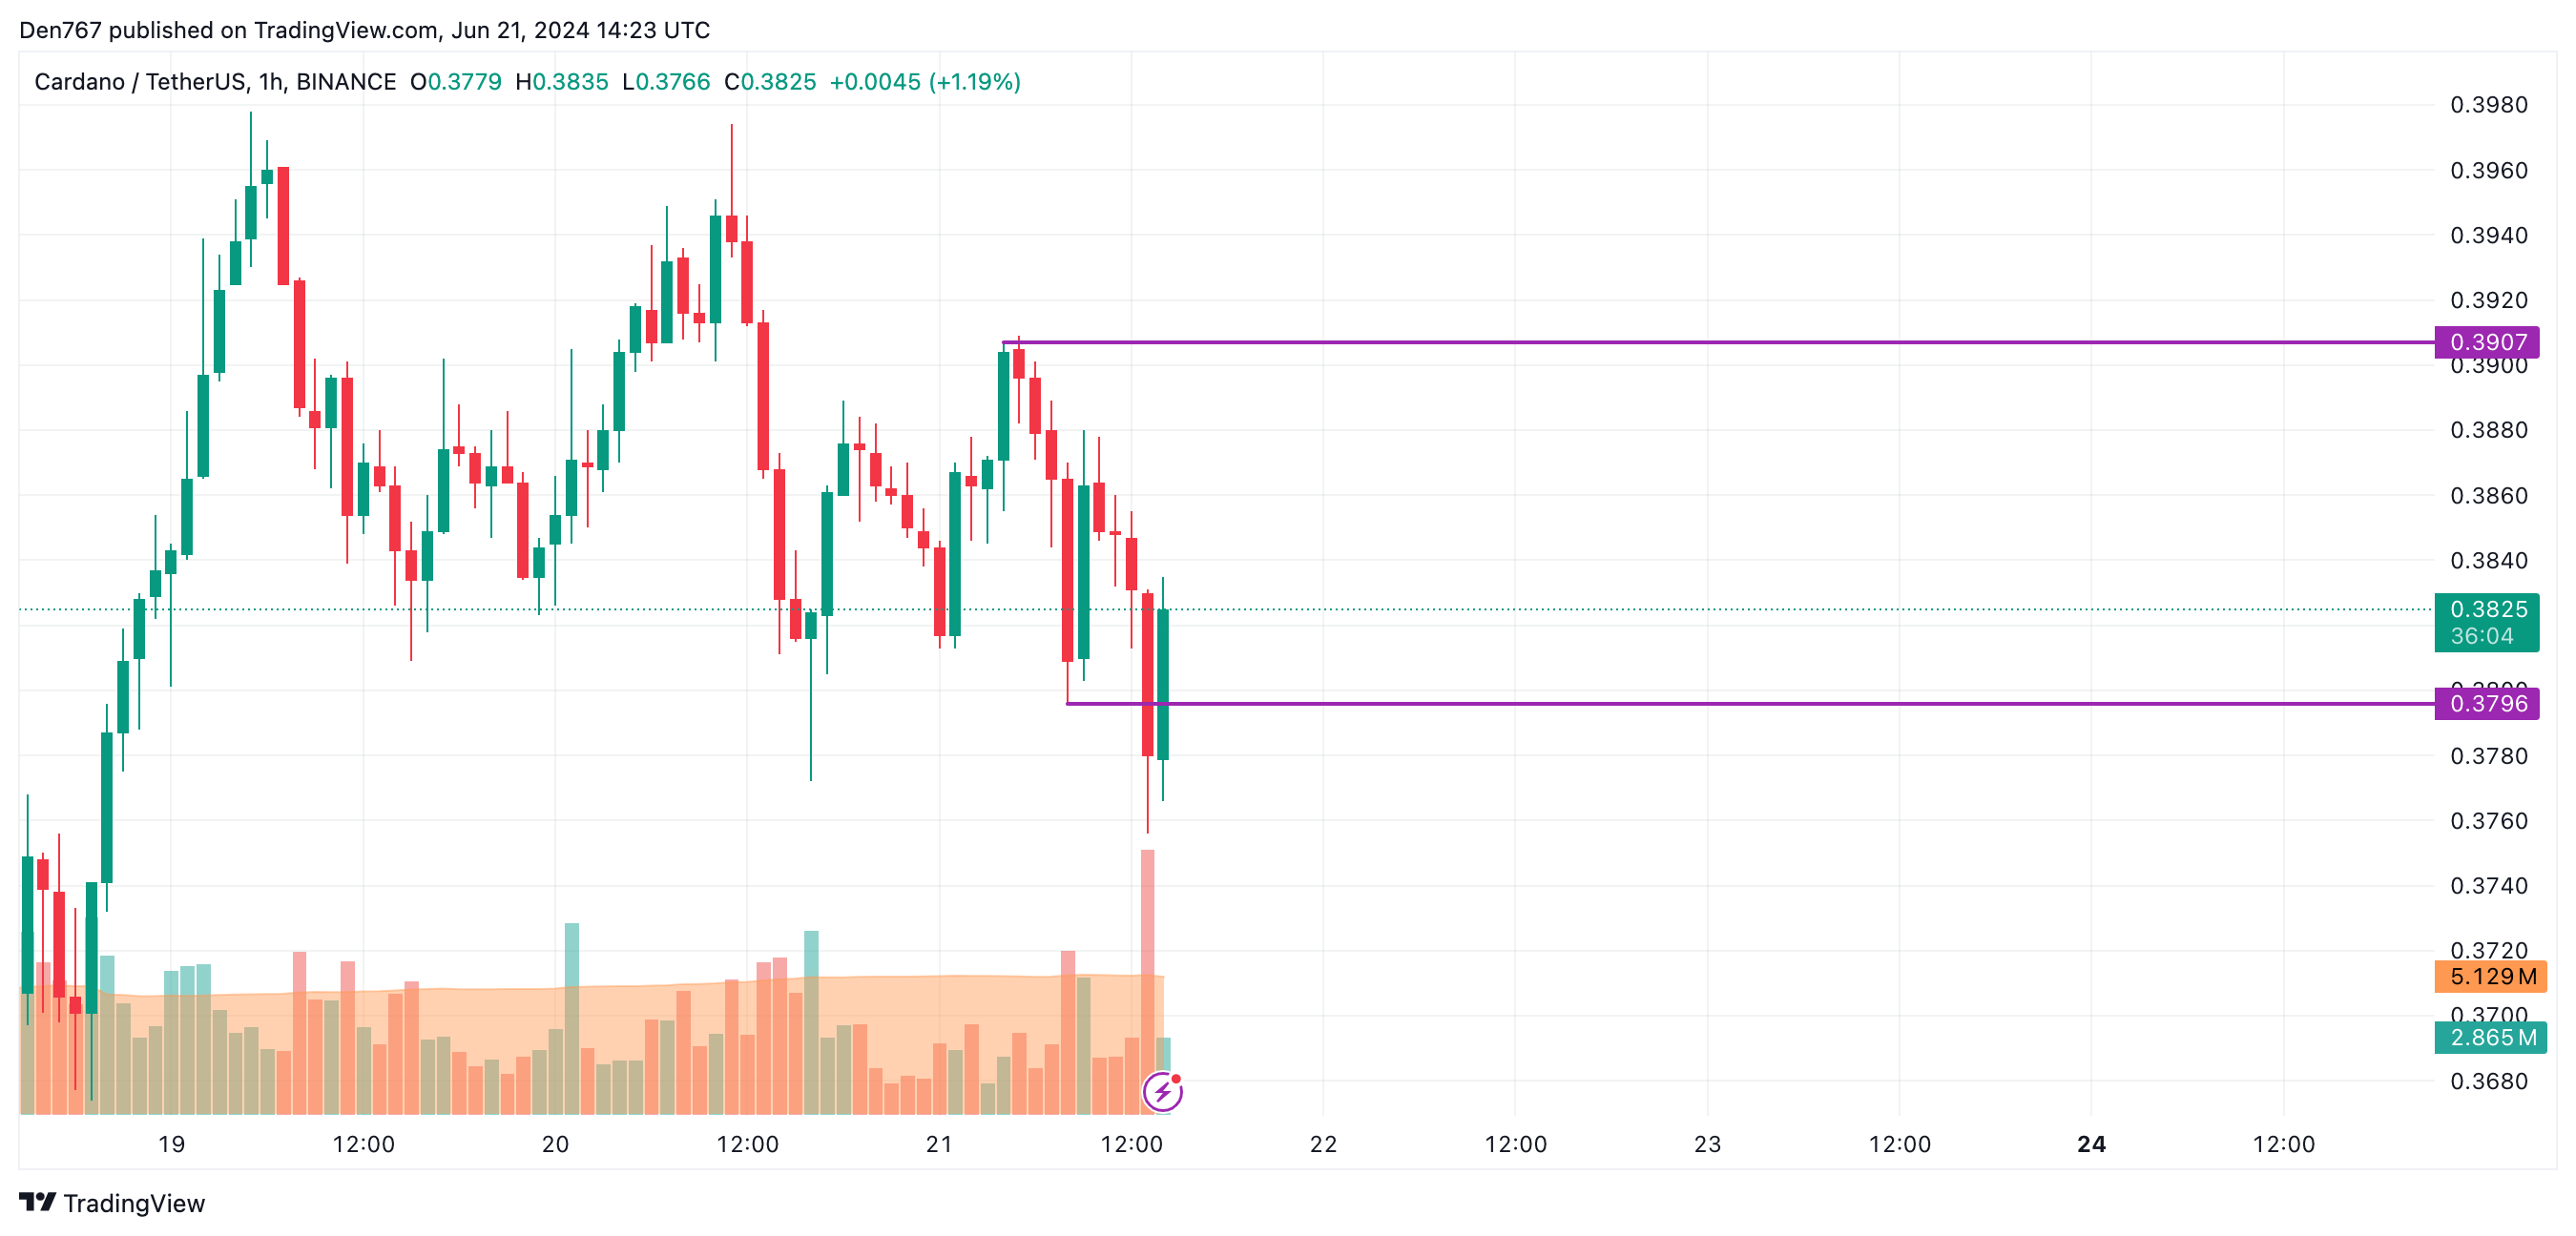
On the hourly chart, one should pay attention to the local support level of $0.3796. If the daily bar closes far from it and closer to the resistance, there is a chance to see a test of the $0.39 zone tomorrow.
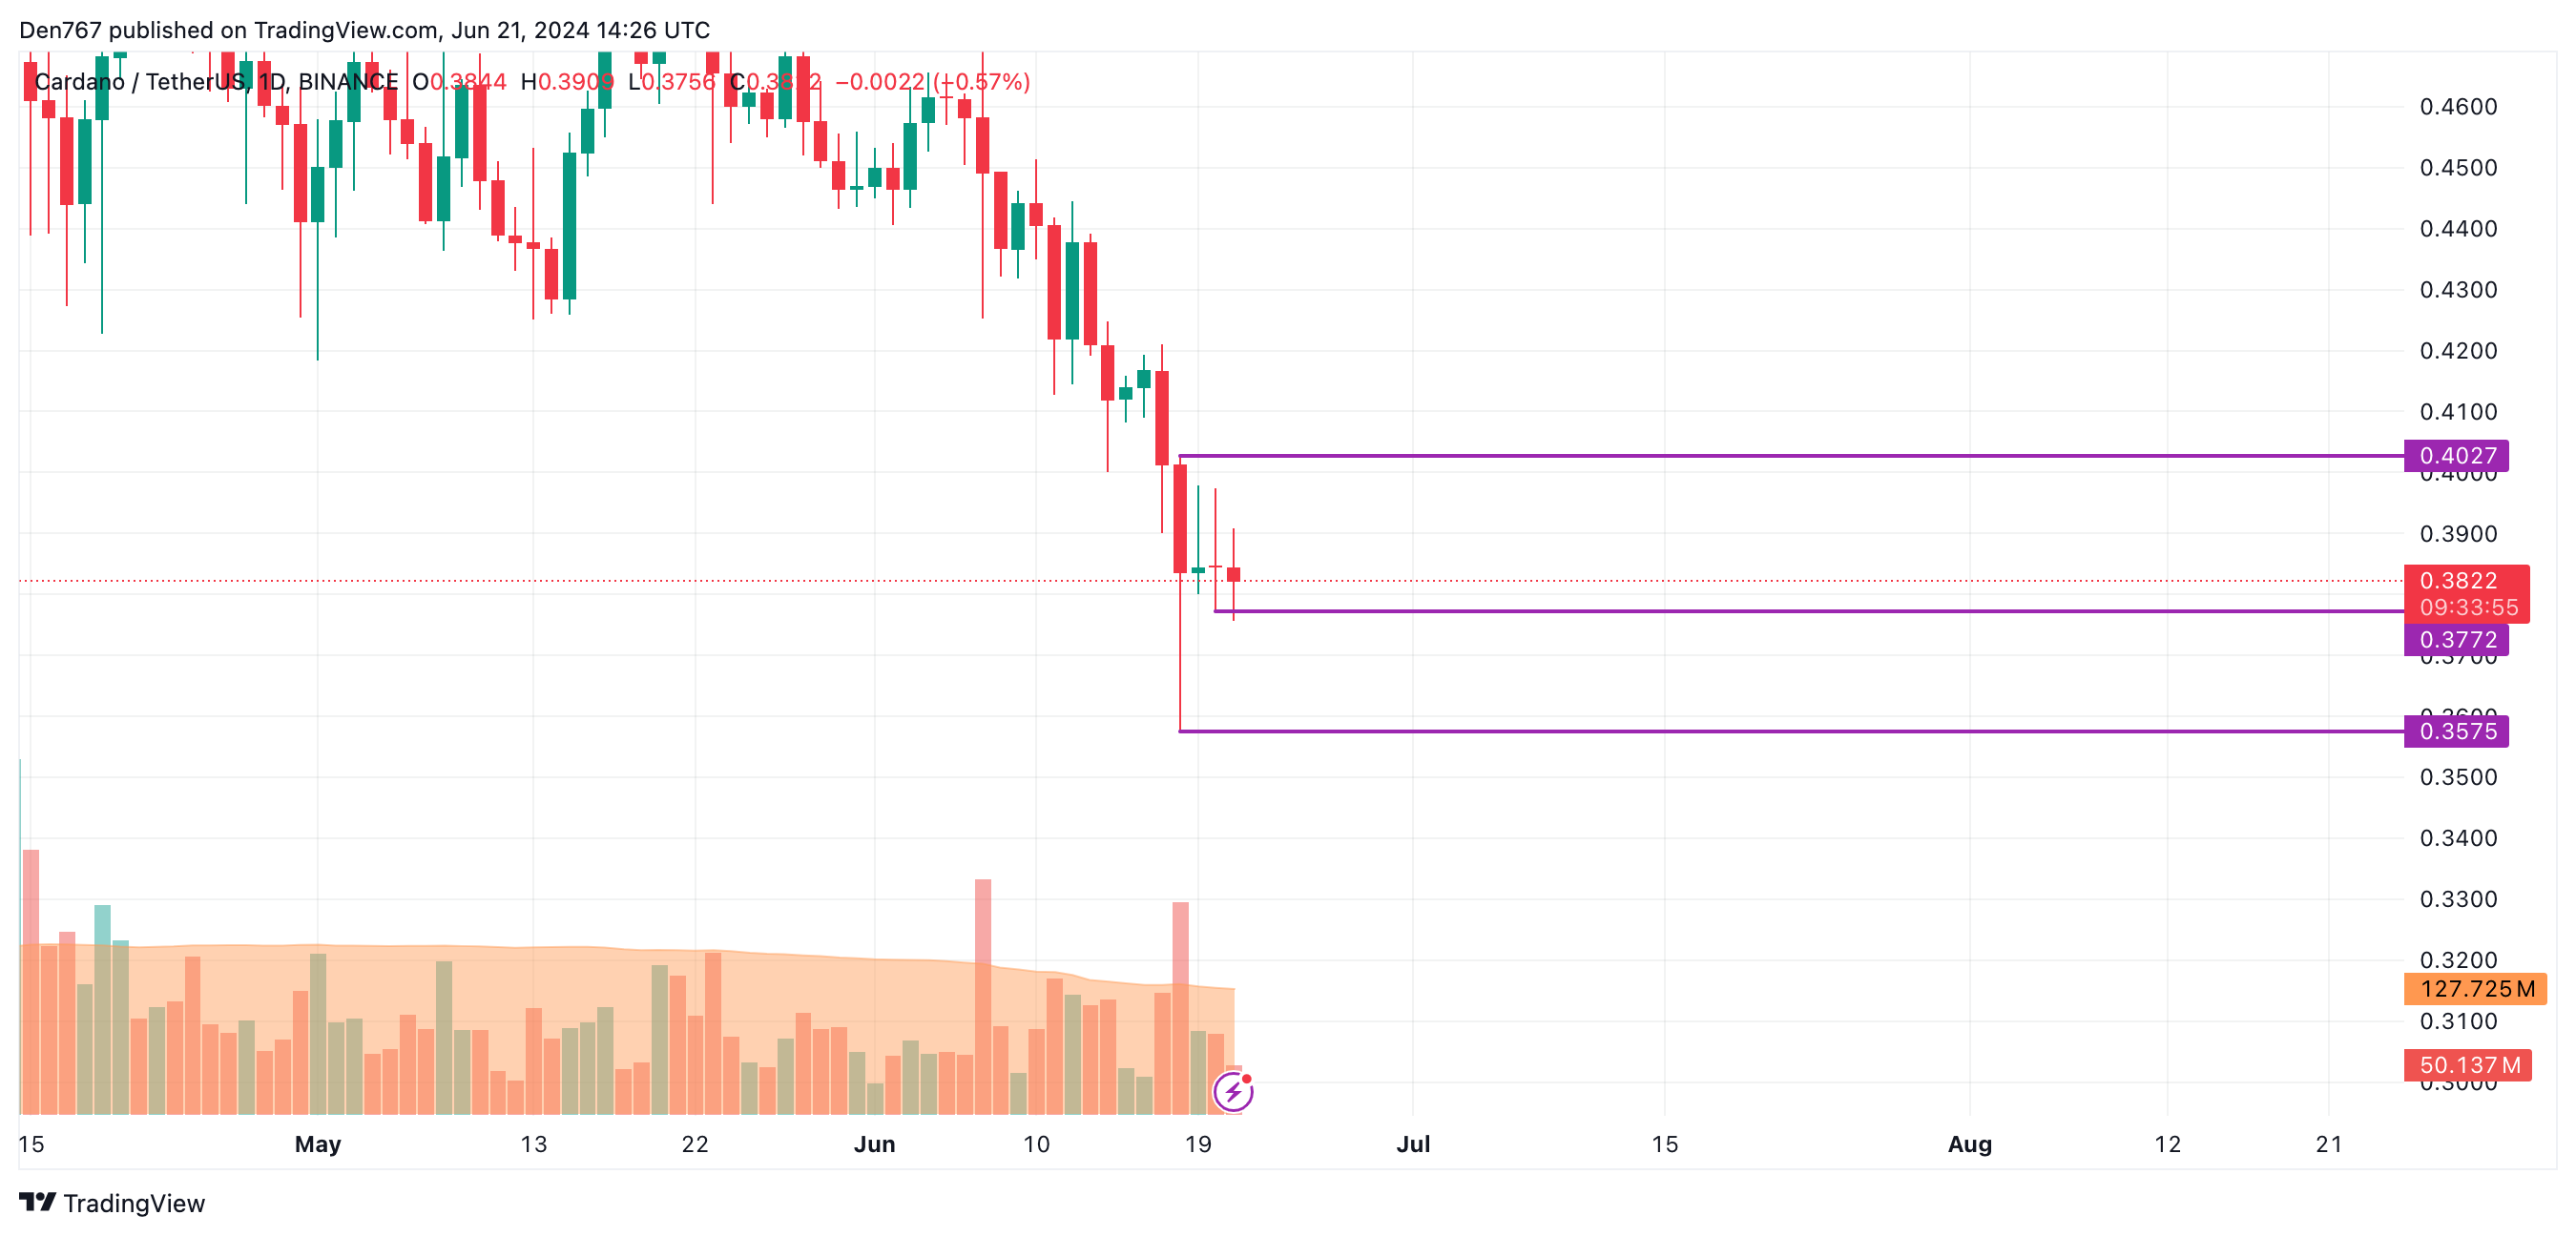
On the bigger time frame, traders should focus on the candle’s closure in terms of the nearest support level of $0.3772.
If sellers’ pressure continues, there is a possibility of seeing a breakout, followed by a further drop to $0.3575.
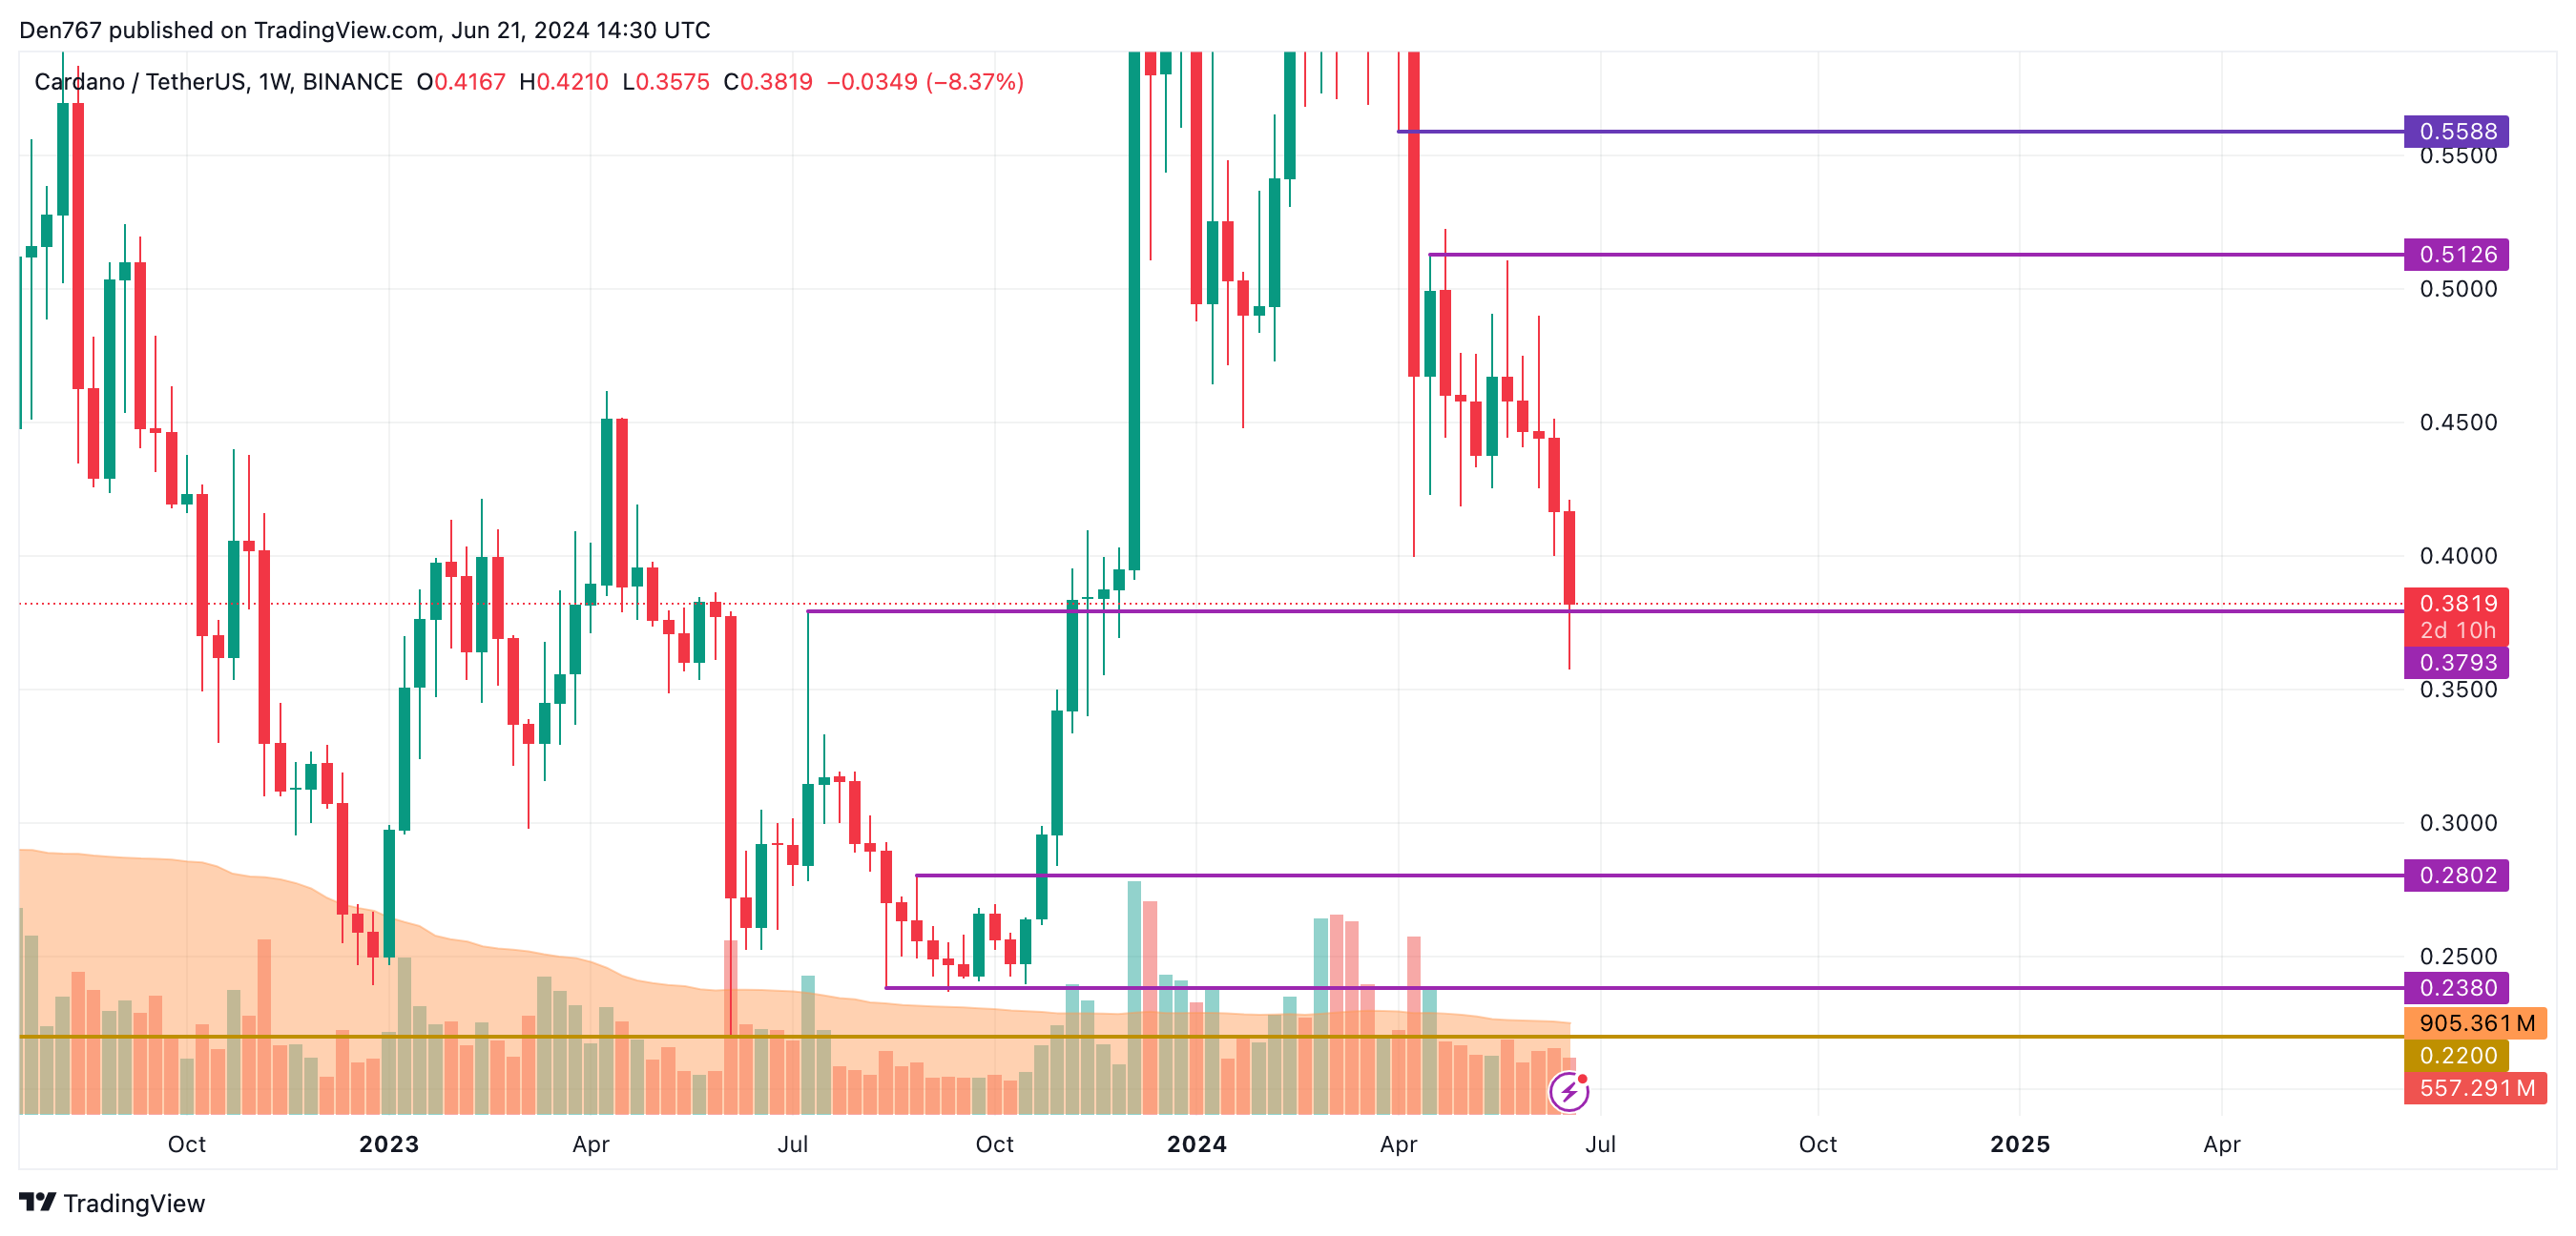
From the midterm point of view, the situation remains bearish. If the bar closes with no long wick and below $0.3793, the energy might be enough for a move to the $0.35 range.
ADA is trading at $0.3826 at press time.
With questions like “Is Solana Crypto dead?” and “Will SOL Price ever recover?” investors are raising concerns about its future prospects. Further, will the filing for ETFs of Solana act as a catalyst in regaining its lost value during the coming time?
Let’s go, as in this article, we have covered the price analysis and potential short-term price targets of SOL crypto. To find out if Solana price will achieve a new high, check out our researched and in-depth detailed article on Solana price prediction.
The most volatile altcoin of the crypto market, the SOL price continues trading under a bearish influence by losing 2.32% within the past day with a change of +6.10% in its trading volume. Furthermore, it has corrected 10.29% within the past seven days and 27.29% over the past month.
Furthermore, the Solana crypto has formed a rounding top pattern in the 1D time frame, indicating a rising bear power for the altcoin in the cryptocurrency space.
The technical indicator, SMA, has constantly acted as a resistance to the SOL token since the month started, highlighting a strong bearish sentiment for the altcoin.
The Relative Strength Index (RSI) has failed to surpass its neutral point with its average recording a constant decline. This has resulted in the trendline constantly heading toward its oversold range and further indicating an increase in the selling pressure in the crypto market.
If the market holds the Solana coin price above its crucial support level of $127, this could result in the altcoin regaining momentum and testing its resistance level of $155.
Moreover, if the bullish sentiment in the market increases, this could asset the SOL crypto price to rise toward its upper resistance level of $181.50.
Conversely, if the bears continue to dominate the crypto market, the Solana token will break down its crucial support level and plunge toward its lower support trendline of $100.
XRP price has been trending below the 50-day and 200-day simple moving averages (SMA) for some time now. Although this is not bullish for the asset, it has remained inside a consolidation zone for the past 2.5 months, establishing a strong support base.
The relative strength index (RSI 14) is below the midpoint at 43. It has been struggling to stay above the 50 level, occasionally and briefly breaking above it a few times in the past. This is an indicator of struggling bulls. The RSI line (purple) is also above its moving average (yellow), indicating some support might be available for the asset around the 40 level.
The Open Interest (OI) for XRP is up 9.7% in the past week, per Coinalyze, indicating that money is flowing into the asset. Furthermore, the daily trading volume to XRP is up 9% in the last 24 hours to $921 million, signaling investor interest.
XRP price has sufficient room to move higher and reclaim $0.6, but it may face some resistance around $0.51 and $0.54. On the flip side, $0.45 presents a robust support barrier, below which XRP may find additional support at $0.42 and $0.38.
The past few days have been eventful for the
Ripple and XRP community. The S.E.C’s Chief of Crypto Asset and Cyber Unit, David Hirsh, resigned from his post, a move that came as a blow from the regulatory agency. Hirsh had served in that office for the last 9 years.Furthermore, following the dropping of investigations into Ethereum 2.0 by the SEC, XRP investors have become more optimistic. Stuart Alderoty, Ripple’s Chief Legal Officer, took the opportunity to shed light on the SEC’s lack of regulatory clarity.
Additionally, following the SEC vs. Terraform Labs settlement, Ripple wrote to the court explaining why, based on the Terraform Labs settlement, they shouldn’t pay anything above $10 million in fines. Following this move, the SEC folded to and reduced the proposed fine from $2 billion to $102.6 million. However, Ripple insists on a maximum of $10 million. The lawsuit has already entered its trial phase and may result in volatility for the price of XRP.
In a recent development, a California judge has disagreed with Judge Analisa Torres and sent the Ripple vs. SEC lawsuit to trial. However, the judge dismissed four of the class action claims, allowing only one related to Ripple CEO Brad Garlinghouse to proceed. The trial is expected to cause volatility in the price of XRP.
As the lawsuit enters the trial phase, investors eagerly await the outcome of the case. Will the SEC release Ripple the way they did for Ethereum? In the meantime, the developments around the case are causing market XRP price volatility as witnessed in its increased duality trading volume.
Related Articles
XRP Price Prediction: The price of XRP gained 2% in the past week, but is down 1.2% in the last 24 hours. The price of the asset hovered around $0.487 during European business hours on Friday. The daily trading volume of the asset also surged by 9%, signaling a recent increase in market activity. Among other things, this increase may be caused by recent developments in the Ripple vs. SEC lawsuit, which has mostly played out in Ripple’s favor.

XRP price has been trending below the 50-day and 200-day simple moving averages (SMA) for some time now. Although this is not bullish for the asset, it has remained inside a consolidation zone for the past 2.5 months, establishing a strong support base.
The relative strength index (RSI 14) is below the midpoint at 43. It has been struggling to stay above the 50 level, occasionally and briefly breaking above it a few times in the past. This is an indicator of struggling bulls. The RSI line (purple) is also above its moving average (yellow), indicating some support might be available for the asset around the 40 level.
The Open Interest (OI) for XRP is up 9.7% in the past week, per Coinalyze, indicating that money is flowing into the asset. Furthermore, the daily trading volume to XRP is up 9% in the last 24 hours to $921 million, signaling investor interest.
XRP price has sufficient room to move higher and reclaim $0.6, but it may face some resistance around $0.51 and $0.54. On the flip side, $0.45 presents a robust support barrier, below which XRP may find additional support at $0.42 and $0.38.
The past few days have been eventful for the Ripple and XRP community. The S.E.C’s Chief of Crypto Asset and Cyber Unit, David Hirsh, resigned from his post, a move that came as a blow from the regulatory agency. Hirsh had served in that office for the last 9 years.
Furthermore, following the dropping of investigations into Ethereum 2.0 by the SEC, XRP investors have become more optimistic. Stuart Alderoty, Ripple’s Chief Legal Officer, took the opportunity to shed light on the SEC’s lack of regulatory clarity.
A big win for Consensys, though questions remain. Does this mean the SEC thinks Consensys’ offers and sales of ETH are not securities transactions and/or that ETH itself is not a security? What will Gensler say if now asked? What is the status of MetaMask and staking?
This is…
— Stuart Alderoty (@s_alderoty) June 19, 2024
Additionally, following the SEC vs. Terraform Labs settlement, Ripple wrote to the court explaining why, based on the Terraform Labs settlement, they shouldn’t pay anything above $10 million in fines. Following this move, the SEC folded to and reduced the proposed fine from $2 billion to $102.6 million. However, Ripple insists on a maximum of $10 million. The lawsuit has already entered its trial phase and may result in volatility for the price of XRP.
In a recent development, a California judge has disagreed with Judge Analisa Torres and sent the Ripple vs. SEC lawsuit to trial. However, the judge dismissed four of the class action claims, allowing only one related to Ripple CEO Brad Garlinghouse to proceed. The trial is expected to cause volatility in the price of XRP.
As the lawsuit enters the trial phase, investors eagerly await the outcome of the case. Will the SEC release Ripple the way they did for Ethereum? In the meantime, the developments around the case are causing market XRP price volatility as witnessed in its increased duality trading volume.
Related Articles
 Price Prediction: Is it too Outrageous?")


 Price Prediction for June 21")


