The main tag of cryptocurrency price today Articles.
You can use the search box below to find what you need.
[wd_asp id=1]
The main tag of cryptocurrency price today Articles.
You can use the search box below to find what you need.
[wd_asp id=1]
Ripple [XRP] led the market rally in the intraday trading session on the 17th of May, posting 3% gains. The upswing saw it hit $0.52.
XRP’s slight bounce followed Bitcoin’s [BTC] surprise jump from $64K to $67K. But the largest digital assets erased early-week gains and could spell trouble for XRP.

Source: XRP/USDT, TradingView
The Monday upswing saw XRP defend the 78.6% Fib level ($0.48), a crucial range low. XRP has been stuck between the 61.8% and 78.6% Fib levels.
So, a decisive reclaim could set the altcoin for the range-high ($0.54). That’s a potential 10% for bulls.
However, key technical chart indicators haven’t demonstrated market leverage to bulls as of press time.
The RSI (Relative Strength Index) faced rejection at the mid-range, indicating buying pressure surged but wasn’t strong enough to push XRP higher.
Similarly, the CMF (Chaikin Money Flow) showed an uptick but hadn’t crossed above the zero level. It meant inflows improved but weren’t substantial enough.
That said, XRP bulls need to defend the 78.6% Fib level if the 10% potential is to be realized. Otherwise, short-sellers could drag it lower to $0.45 or $0.41
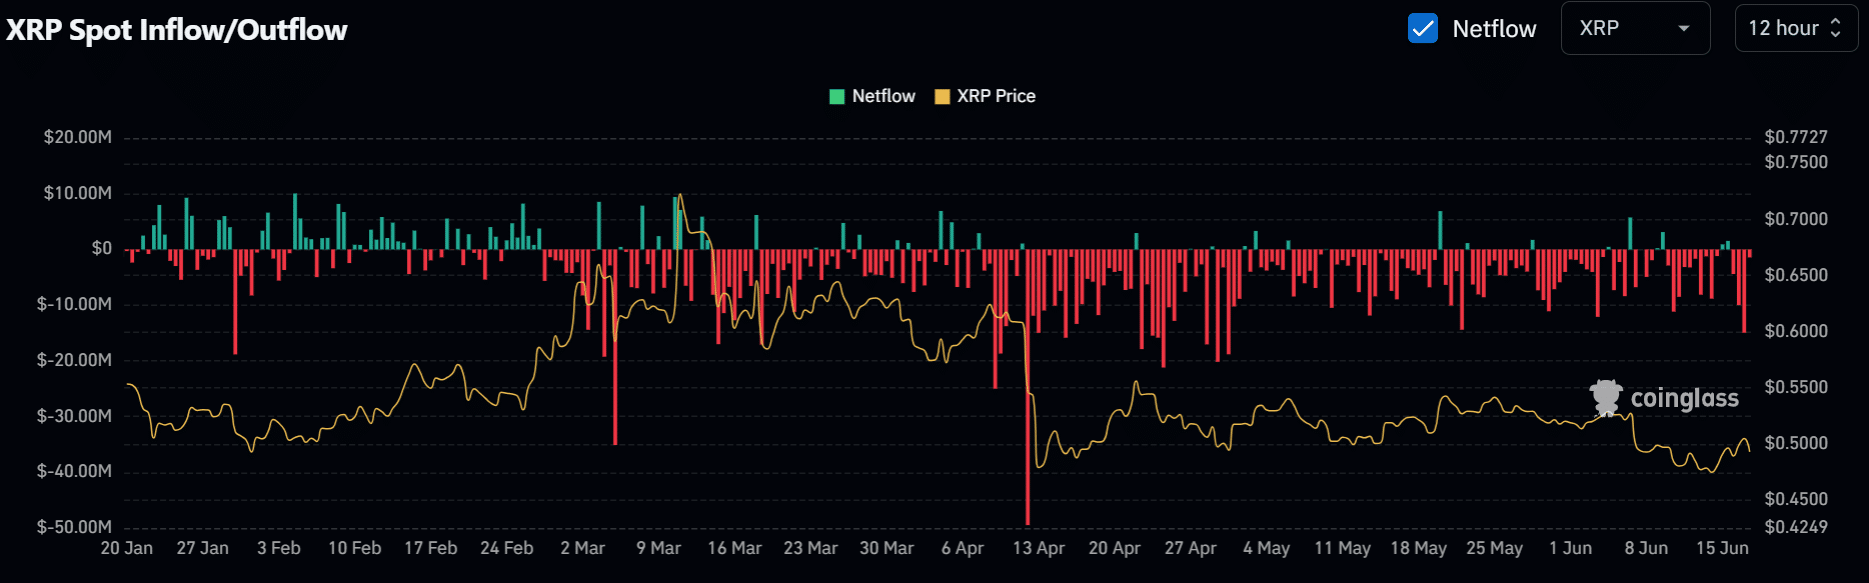
Source: Coinglass (XRP spot flows)
The weak CMF was supported by massive outflows from XRP spot markets after Monday’s upswing.
Per Coinglass data, the XRP spot market recorded a $24.99 million outflow on the 17th of June, demonstrating that some investors de-risked after the upswing.
If it persists, the bearish sentiment could weigh on an extended recovery.
However, Santiment, an intelligent crypto data platform, noted that crowd sentiment on XRP has dipped to 2024 lows and could be a perfect buying opportunity.
‘Patient traders who have been waiting for the crowd to give up on these large-cap altcoins may finally have their buy opportunity with FOMO at a 2024 low.’
The bullish position, despite a weak price chart, was reiterated by another X (formerly Twitter) user and analyst, BCBacker.
Realistic or not, here’s XRP’s market cap in BTC’s terms
The analyst established that, on higher timeframe charts, XRP flashed signals that were followed by an explosive rally in 2017 and 2021.
That said, BTC’s next move would be the key driver of XRP’s price movement. Further weakening of the king coin could complicate the altcoin’s recovery.
June 18, 2024 by Editor’s Desk
2
    As the crypto landscape witnesses new developments, a new contender, ETFSwap (ETFS), is emerging with the potential to disrupt the market significantly.  Expert analysts forecast that ETFSwap (ETFS) could deliver 100x returns in 2024, positioning it as a viable alternative to Cardano (ADA). With its robust utilities and advanced infrastructure, ETFSwap (ETFS) is rapidly gaining    </p><div>
    <p>As the crypto landscape witnesses new developments, a new contender,<a rel="nofollow noopener" target="_blank" href="https://etfswap.io/?utm_source=blockchainmagazine&utm_medium=pr&utm_campaign=0618"> ETFSwap (ETFS)</a>, is emerging with the potential to disrupt the market significantly.  Expert analysts forecast that ETFSwap (ETFS) could deliver 100x returns in 2024, positioning it as a viable alternative to Cardano (ADA).
With its robust utilities and advanced infrastructure, ETFSwap (ETFS) is rapidly gaining traction among investors seeking exponential growth. The recent introduction of Ethereum ETFs has further fueled interest in the trading platform, amplifying its rise within the crypto space.
ETFSwap (ETFS) is more than just a digital asset; it represents a comprehensive ecosystem designed to offer unparalleled utility and infrastructure. At its core, the DeFi project aims to streamline the token-swapping process, providing users with seamless, efficient, and 24/7 secure transactions. This platform leverages cutting-edge blockchain technology to facilitate low-cost, high-speed swaps between different tokens, generate high yield from ETF staking, positioning itself as a critical player in the decentralized finance (DeFi) sector.
ETFSwap (ETFS) is a decentralized finance (DeFI) tokenization platform built on the Ethereum blockchain technology, which allows users to own and trade tokenized exchange-traded funds (ETFs). The platform ensures that tokenized assets are backed by real-world securities purchased from traditional financial markets. ETFSwap (ETFS) integrates blockchain technology with ETFs because it works with MiCa-compliant regulated investment banks to deal in both securities and crypto trading.
ETFSwap’s (ETFS) infrastructure includes a user-friendly interface, advanced security protocols, and robust liquidity pools, ensuring that users can execute transactions with minimal slippage and maximum efficiency. Additionally, its governance model allows token holders to have a say in the platform’s development, fostering a community-driven approach that enhances its adaptability and resilience.
Moreover, ETFSwap (ETFS) features advanced AI powered ETF Screener and ETF Tracker and special tools like ETF Search, and ETF Filter. It offers borderless ETF trading, decentrslized ETF trading, offering investors a suite of advanced tools to be part of the ETF revolution.
These features collectively make it a formidable alternative to Cardano (ADA), with the potential for significant returns.
Cardano (ADA) has long been a favorite among crypto enthusiasts due to its innovative technology and strong market presence. However, Cardano’s (ADA) current performance in the market has shown signs of stagnation, with Cardano (ADA) struggling to maintain its previous momentum. This has led investors to seek alternatives that promise higher returns and greater growth potential.
ETFSwap (ETFS) stands out from Cardano (ADA) in this regard as analysts highlight its unique value proposition, which combines traditional ETFs’ strengths with decentralised finance’s dynamism (DeFi). The recent surge in interest around Spot Ethereum ETFs has had a spillover effect, drawing attention to platforms like ETFSwap (ETFS) that are poised to benefit from the growing acceptance of ETF-like products in the crypto world.
Moreover, ETFSwap’s ( ETFS) strategic partnerships and innovative development roadmap further bolster its growth prospects more than that of Cardano (ADA). With the ongoing presale offering ETFS tokens at the low price of $0.01831, investors have a unique opportunity to get in early on a project that is primed for substantial appreciation.
The anticipated price rise to $0.03846 in the next presale stage underscores the strong demand and bullish sentiment surrounding the platform, fuelling the urgency of investing without delay as early birds are bound to cash out big shortly.
ETFSwap (ETFS) presents a compelling case for investors seeking high returns in the volatile world of cryptocurrencies. Its robust utilities, advanced infrastructure, and strategic market positioning make it a formidable alternative to Cardano (ADA) and other altcoins. Expert predictions of 100x returns in 2024 are supported by its unique value proposition and the broader market dynamics favoring ETF-like crypto products.
With the presale price at an all-time low of $0.01831, now is the opportune moment for investors to seize this golden opportunity. The projected price rise to $0.03846 in the next presale stage is a clear indicator of the platform’s potential to deliver significant returns. As the crypto market continues to evolve, ETFSwap (ETFS) is poised to lead the charge, offering investors a slice of the future at the best price since sliced bread.
For more information about the ETFS Presale:
The market keeps setting a new local low, according to CoinMarketCap.
The rate of Solana (SOL) has fallen by 6.60% over the last 24 hours.
If it happens far from its low, traders may expect sideways trading in the zone of $135-$145 until the end of the week.
From the midterm point of view, the price of SOL is far from the support and resistance levels. However, if the decline continues to the $120 zone, the accumulated energy might be enough for a breakout, followed by a move to the $100-$110 area.
SOL is trading at $137.27 at press time.
About the author
Denys Serhiichuk
Also Read: Rollblock, Solana, and Ripple’s Price Set to Surge as Bitcoin Records a Rally in Price
The XRP token in the past two months has showcased moderate volatility in line with broader market consolidation. However, unlike most of the major cryptocurrencies which recorded notable corrections in June, the XRP price remained sideways above $0.46.
An analysis of the broader market context shows that the support trendline for XRP, established since March 2020, has effectively helped stabilize the price and mitigate deeper corrections. Recently, with a resurgence of investor interest, the XRP rebounded from $0.46, achieving a 7.56% increase to its current trading price of $0.492.
In a recent report by CoinShares, digital asset fund flows for week 24 of 2024 reveal a total outflow of $600 million across various digital assets. Bitcoin faced the largest outflows, amounting to $621 million, while Ethereum and XRP stood out with positive inflows.
Digital Asset Fund Flows by Asset for week 24!
* Total outflows of $ 600 Mio.
* Largest outflows in #Bitcoin with $ 621 Mio.
* Largest inflows in #Ethereum with $ 13,1 Mio.
* Other Altcoins: #XRP with largest inflows of $ 1,1 Mio. pic.twitter.com/TRwk1ztn1Z— Lucky177654 (@sigi_gauner) June 18, 2024
Ethereum led the inflow charts with $13.1 million, and XRP followed suit with notable inflows of $1.1 million, the highest among other altcoins. This influx of capital into XRP funds signifies a growing optimism among investors.
Also Read: XRP Price Faces Turbulence Near $0.5 As Whales Shuffle 80M Coins, What’s Next?
The market sentiment surrounding the Ripple vs. SEC lawsuit has seen a significant shift, driven by the SEC’s recent decision to lower its proposed settlement offer from $2 billion to $102.6 million. This development has sparked optimism among investors and the broader crypto community, as it suggests a potential resolution may be closer than anticipated.
Amid recent positive changes, the price of XRP is hovering above a crucial multi-year support level defined by a triangle pattern. This positioning increases the potential for a major market reversal.
A breakout above the overhead resistance (marked by a black trendline) could potentially trigger a 30% upswing, targeting the key resistance level marked by a blue trendline.
Escaping the triangle pattern will end XRP’s 5-year-long accumulation and bolster buyers to lead a rally above $2.
Related Articles
According to the latest data, the Bitcoin exchange traded funds (ETFs) experienced outflows of $566 million in last week. Analysts are attributing the sell-off by the institutional investors to a hawkish FOMC statement and uncertain economic conditions in the US.
The 4H BTC/USD chart depicts a very bearish picture. The price seems to have gained acceptance below the critical $66,800 support which was the previous range high. As a result, bears are now targeting the demand zone which lies below $66,700. If the falling wedge pattern fails to break toward the upside in the next few days, Bitcoin price might also retest the range lows around $60,650.
According to the latest crypto news, the SEC might grant the much-anticipated S-1 approval for spot Ethereum ETF on 2nd July. If this happens, the Ethereum price prediction could become very bullish once the ETF goes live on traditional exchanges. However, the smart contract digital asset needs to break out of the local bearish trend first. This would mean a reclaim of the $3,500 support level, as shown in the following 4H chart.
With a retest of the $127 support on Tuesday morning, Solana price prediction is looking extremely bearish. The price is hanging by a thread as it is trading below the daily support of $137.5. A daily closure below this level would break the bullish market structure which started after its bottom in May.
Disclaimer: Analytics Insight does not provide financial advice or guidance. Also note that the cryptocurrencies mentioned/listed on the website could potentially be scams, i.e. designed to induce you to invest financial resources that may be lost forever and not be recoverable once investments are made. You are responsible for conducting your own research (DYOR) before making any investments. Read more here.
DOGE price was previously trending inside a giant descending triangle. The base of the triangle provides robust support for DOGE but prevailing bearish market conditions created by Bitcoin may render it useless. The support has been tested three times before and investors are hoping it will hold water now. Descending triangles are generally not bullish, but if they resolve upwards, it’s usually explosive.
The price of DOGE is trending below the 50-day and 200-day simple moving averages (SMA), which is not bullish for the asset price. Should a bounce happen at this price point, DOGE may break out of the current market structure and make for $0.237. On its way up, the dog-themed meme coin may encounter resistance around $0.182 and $0.206. On the flip side, in a downward scenario, the DOGE price may find further support around $0.096 and $0.072.
The Relative Strength Index (RSI) has dipped to 29 and is officially in the oversold (OS) region. Overbought (OB) and oversold (OS) regions are characterized by extreme price action momentum. Due to this, the price of DOGE may witness some non-bullish price action volatility in the coming days. Nevertheless, RSI (14) at 29 is an indicator that DOGE has officially bottomed and accumulation may begin from this point onward.
The crash of DOGE’s price was part of a market-wide crash instigated by Bitcoin. The king of cryptos slid below a crucial support level late on Monday evening, causing the entire crypto market to drop. The total market cap of the crypto industry is down 3% in the last 24 hours, per CoinGecko.
Despite these numbers, the Bitcoin Fear & Greed Index remains at 74 (Greed). This has the crypto community questioning whether this important market sentiment analysis tool is rigged.
Bitcoin has an overwhelming effect on the markets, as its market cap dominance has also increased in the last week from 51.5% to 52.1%. Dogecoin investors are keeping a close eye on BTC price action as it will mark the difference between profit and loss for them.
Related Articles
The price of Solana hovered around $137 during European business hours on Tuesday, a 7.5% decrease in the last 24 hours, per CoinGecko.
SOL price had previously been trending inside a symmetrical triangle. This type of market structure can resolve in either direction, but with some influence, has a higher probability of resolving in a given direction. Solana’s preceding trend was to the upside, which may be a major factor in determining how the symmetrical triangle resolves.
Solana’s price action is trending below the 50-day but above the 200-day simple moving averages (SMA), showing there may be some struggle between the bulls and the bears. While the 200-day SMA provides support, the 50-day SMA provides resistance. The former is expected to hold ground since it supports the uptrend.
A break to the upside from the symmetrical triangle may result in a 63% rally to $292. We can expect some resistance at the 50-day SMA ($157), $196, $228, and $267. On the flip side, a downward scenario may find robust support around $126. Fairly strong support levels also exist around $87 and $56.
Despite the prevailing market conditions, the 24-hour trading volume of Solana skyrocketed by 153%, showing increased investor interest and a potential price surge soon.
This burst of activity on the network is supported by statistics, as the number of active addresses on the network hit an all-time high of 41.65 million in May. As of June 18, 2024, active addresses are already halfway to those of the previous month, per
The Block.Coinalyze shows that the aggregated Solana Open Interest (OI) has been falling since June 4, 2024, indicating that money has been flowing out of the asset. This metric is synonymous with the entire crypto industry, which has been experiencing a general drop in value. Nevertheless, SOL OI shows strong support around the $1.36B level, from which point money may begin flowing back into the asset once more.
Meanwhile, crypto users remain with question marks as the Bitcoin Fear & Greed Index indicates ‘Greed’ for over a month now, despite falling crypto prices.
Solana price has showcased impressive resilience in the heat of a general market crash. Despite initially crashing 11%, the asset recovered quickly and maintained its bullish market structure.
Related Articles
Bears keep controlling the situation on the market at the beginning of the week, according to CoinMarketCap.Top coins by CoinMarketCap
The price of Cardano ![]() ADAUSD has fallen by 2.91% over the last 24 hours.Image by TradingView
ADAUSD has fallen by 2.91% over the last 24 hours.Image by TradingView
On the daily chart, the rate of ADA is near the support level of $0.3994.
If the situation does not change by the end of the day, there is a chance to see a breakout, followed by a move to the $0.38-$0.39 zone soon.
ADA is trading at $0.4043 at press time.
Binance Coin (BNB) is less of a loser, going down by 1.05%.Image by TradingView
From the technical point of view, the rate of BNB is rather more bearish than bullish. If the decline continues to the support of $591.3, the accumulated energy might be enough for a dump to $580.
BNB is trading at $603.2 at press time.
In 2013, the cryptocurrency landscape was dominated by Bitcoin, which had a focus on payments only. Vitalik Buterin, a young programmer, proposed a new platform that would revolutionize the blockchain world in many ways. Ethereum was born, offering not just a digital currency but a decentralized platform for smart contracts and decentralized applications (dApps).
Ethereum faced a slow start in the market. Its price hovered around $0.30 per ETH at its ICO and for most of 2014, with limited trading volume and investor interest. Despite the skepticism from some quarters, the Ethereum team continued to develop the platform, laying the groundwork for future growth. Initially, one ETH was equivalent to about 2000 BTC. This is now closer to 20.
2015 marked a significant turning point for Ethereum. The platform’s developers released the Frontier network, allowing users to mine and trade ETH. Prices remained relatively stable throughout the year, ranging between $0.50 and $3.00 per ETH. The focus was on building a robust ecosystem and attracting developers to create innovative applications on the platform.
As Ethereum gained traction, its price began to climb steadily. In early 2016, ETH was trading at around $1.00, but by the end of the year, it had surged to over $8.00 per token. Growing investor confidence in Ethereum’s potential to disrupt traditional industries and enable new forms of digital interaction fueled investor sentiment. 2016 also saw a huge split with the collapse of the DAO, resulting in Ethereum Classic.
The year 2017 saw Ethereum catapulted into the spotlight as the platform of choice for ICOs, and it really took off. Hundreds of projects launched their tokens on the Ethereum blockchain, driving up demand for ETH. Prices skyrocketed initially but tumbled soon thereafter, with ETH falling below $100 by the end of the year. It started a “Crypto Winter” and people had to reevaluate their strategies.
In 2018, the price of Ethereum experienced significant volatility, mirroring the broader cryptocurrency market. ETH reached an all-time high of over $1,400 in January before undergoing a sharp correction, falling below $400 by April. Regulatory uncertainty, security concerns, and the bursting of the ICO bubble influenced market sentiment. In spite of a harsh reality check for many, development continued and Ethereum moved forward.
Developers focused on improving the platform’s scalability and usability, laying the foundation for future growth. Prices remained relatively stable throughout 2019, fluctuating between $100 and $300 per ETH. This period of consolidation allowed the Ethereum community to regroup and prepare for the next phase of development. This was also the start of a wider COVID-19 pandemic which triggered wider economic collapse.
In 2020, Ethereum emerged as the backbone of the decentralized finance (DeFi) movement. A wave of projects leveraging smart contracts and decentralized exchanges proliferated, driving demand for ETH. Prices surged once again, reaching over $600 per token by the end of the year. The explosive growth of DeFi highlighted Ethereum’s potential to disrupt traditional finance and usher in a new era of decentralized applications.
The year 2021 witnessed another boom in Ethereum’s price, fueled in part by the rise of non-fungible tokens (NFTs). Artists, creators, and collectors flocked to Ethereum’s blockchain to buy, sell, and trade digital assets, pushing ETH prices to new all-time highs. By May 2021, ETH had surpassed $4,000 per token, propelled by the growing mainstream adoption of NFTs and continued interest in DeFi. Ultimately, the NFT industry would go through a similar boom, bust, and recovery as the ICO model, with multiple scams and overvalued trades taking place.
In 2022, Ethereum faced increased volatility as regulatory uncertainty and macroeconomic factors weighed on the cryptocurrency market. Prices fluctuated between $1,500 and $3,000 per ETH, reflecting the broader instability in global financial markets. Despite the challenges, Ethereum’s underlying fundamentals remained strong, with ongoing development efforts and growing institutional interest supporting its long-term outlook.
By 2023, the cryptocurrency market had matured significantly, with Ethereum firmly established as a leading blockchain platform. Prices stabilized around $2,500 to $3,500 per ETH, reflecting a more balanced market sentiment and investor confidence. Continued innovation in DeFi, NFTs, and other blockchain applications further solidified Ethereum’s position as a key player in the digital economy.
As we look ahead to the future, Ethereum continues to face both opportunities and challenges. Scalability remains a pressing issue, with the upcoming transition to Ethereum 2.0 expected to address these concerns. Institutional adoption of Ethereum is also on the rise, with major corporations and financial institutions exploring the potential of blockchain technology.
Bears keep controlling the situation on the market at the beginning of the week, according to CoinMarketCap.
The price of Cardano (ADA) has fallen by 2.91% over the last 24 hours.
If the situation does not change by the end of the day, there is a chance to see a breakout, followed by a move to the $0.38-$0.39 zone soon.
ADA is trading at $0.4043 at press time.
Binance Coin (BNB) is less of a loser, going down by 1.05%.
BNB is trading at $603.2 at press time.
About the author
Denys Serhiichuk
 As ADA Alternative For 100x Returns In 2024")
 Price Prediction for June 18")


 Price Predictions 2024 2025 2026 – 2030")
