The main tag of cryptocurrency price today Articles.
You can use the search box below to find what you need.
[wd_asp id=1]
The main tag of cryptocurrency price today Articles.
You can use the search box below to find what you need.
[wd_asp id=1]
The Cardano (ADA) price has touched a key weekly support level, a critical point where buyers might step in to prevent further declines.
Following weeks of steady declines, ADA touched the weekly SMA 50 at $0.433. This level has notably held up the ADA price since late October 2023, hence ADA touching here remains significant.
Cryptocurrencies closed the prior week in the red as the market led by Bitcoin moved lower on Friday after the government’s employment data for May came in far higher than predicted, with 272,000 jobs gained.
At the time of writing, ADA was up 0.54% in the last 24 hours to $0.439, slightly higher from the prior day’s low of $0.432. The current price action suggests that ADA sits on a major support where a significant amount of ADA, nearly 3.47 billion coins, are being held by a substantial number of addresses.
If ADA manages to hold above this support level, including its weekly SMA 50 support, and gains upward momentum, it might herald the start of a new bullish trend. Traders and analysts will closely observe Cardano’s price action in the coming days to determine its next moves.
Cardano currently trades in a symmetrical triangle pattern, indicating a battle between bulls and bears. Traders managed to push the ADA price over the daily SMA 50, which was $0.461, on June 7. ADA briefly reached highs of $0.49 before encountering resistance and the price began to fall.
In contrast, if Cardano falls below the daily SMA 50 at $0.461, it may imply that bulls are taking gains, keeping the ADA price trapped inside the triangle for some time.
About the author
Tomiwabold Olajide
Neither bulls nor bears are dominating at the end of the week, according to CoinStats.
The rate of XRP has almost not changed since yesterday.
Such a scenario is relevant until the end of next week.
XRP is trading at $0.4941 at press time.
About the author
Denys Serhiichuk
Ripple-affiliated XRP cryptocurrency has underperformed 90 out of the 100 biggest cryptocurrencies by market capitalization over the past 24 hours. Prominent trader Peter Brandt recently suggested that the price of XRP could end up plummeting to zero against Bitcoin.
That said, this seemingly dismal price action might not be as bad as it looks.
As noted by analyst Bill Morgan, these figures are highly skewed by the massive rally that the token experienced following Ripple’s partial win against the U.S. Securities and Exchange Commission last July.
While XRP’s price performance might not be that atrocious, the analyst is still puzzled by XRP’s complete failure to sustain its momentum following the July court ruling.
“The better question is not why XRP price is underperforming other top 100 coins but why the post summary judgment price rise impact was not sustained and almost entirely lost and why XRP is still trading at prices visited in 2018,” Morgan said in a post on the X social media network.
After U.S. District Judge Analisa Torres ruled that XRP is a security only when Ripple would sell it to institutional buyers, the price of the controversial token experienced a major rally.
XRP surged to a 2023 peak of $0.94 on the Bitstamp exchange following the ruling. However, this renewed excitement surrounding XRP was very short-lived, with the token collapsing 57% since the post-ruling peak.
At press time, XRP is trading at $0.49 on the Bitstamp exchange. For comparison, the token peaked at roughly $0.71 in July 2018 despite the fact that cryptocurrencies were in the middle of a bear market.
While some community members have expressed concerns about Ripple potentially artificially suppressing the price of the XRP token with its artificial sales, Morgan is convinced that this is not the case.
As reported by U.Today, Morgan has pointed out that Ripple offers no discounts to on-demand liquidity (ODL) customers, which means that the company’s ODL sales have neutral impact on the company’s price.
About the author
Alex Dovbnya
XRP has been rangebound over the last ten months. It formed a smaller range over the past two months and did not show signs of breaking out of this range at press time. In fact, the technical indicators suggested that a price bounce from $0.514 might happen.
Alas, this did not come to pass. XRP fell by 14.6% on 7 June, and it did so after bouncing by 10% from its lows, signaling a news-driven impulse move. What can traders expect from the altcoin next?

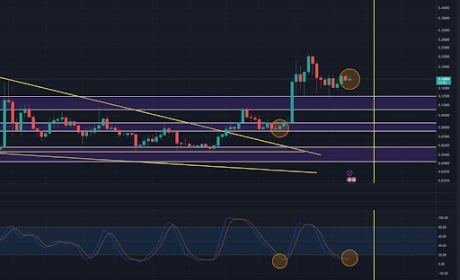
Source: XRP/USDT on TradingView
The two-month range (yellow) extended from $0.47 to $0.56. The mid-range level at $0.514 served as support earlier this week, but Friday’s Bitcoin [BTC] crash dragged XRP down. This flipped the lower timeframe structure bearishly.
The OBV has been on a downtrend since April. It tried to recover in May, but over the past ten days set lower lows. This revealed that even though XRP was above the short-term range’s mid-level, buying pressure remained weak.
The RSI on the daily chart was also below neutral 50, signaling a downtrend in progress. This, combined with the loss of the psychological $0.5 zone, could see XRP drop as low as $0.45.
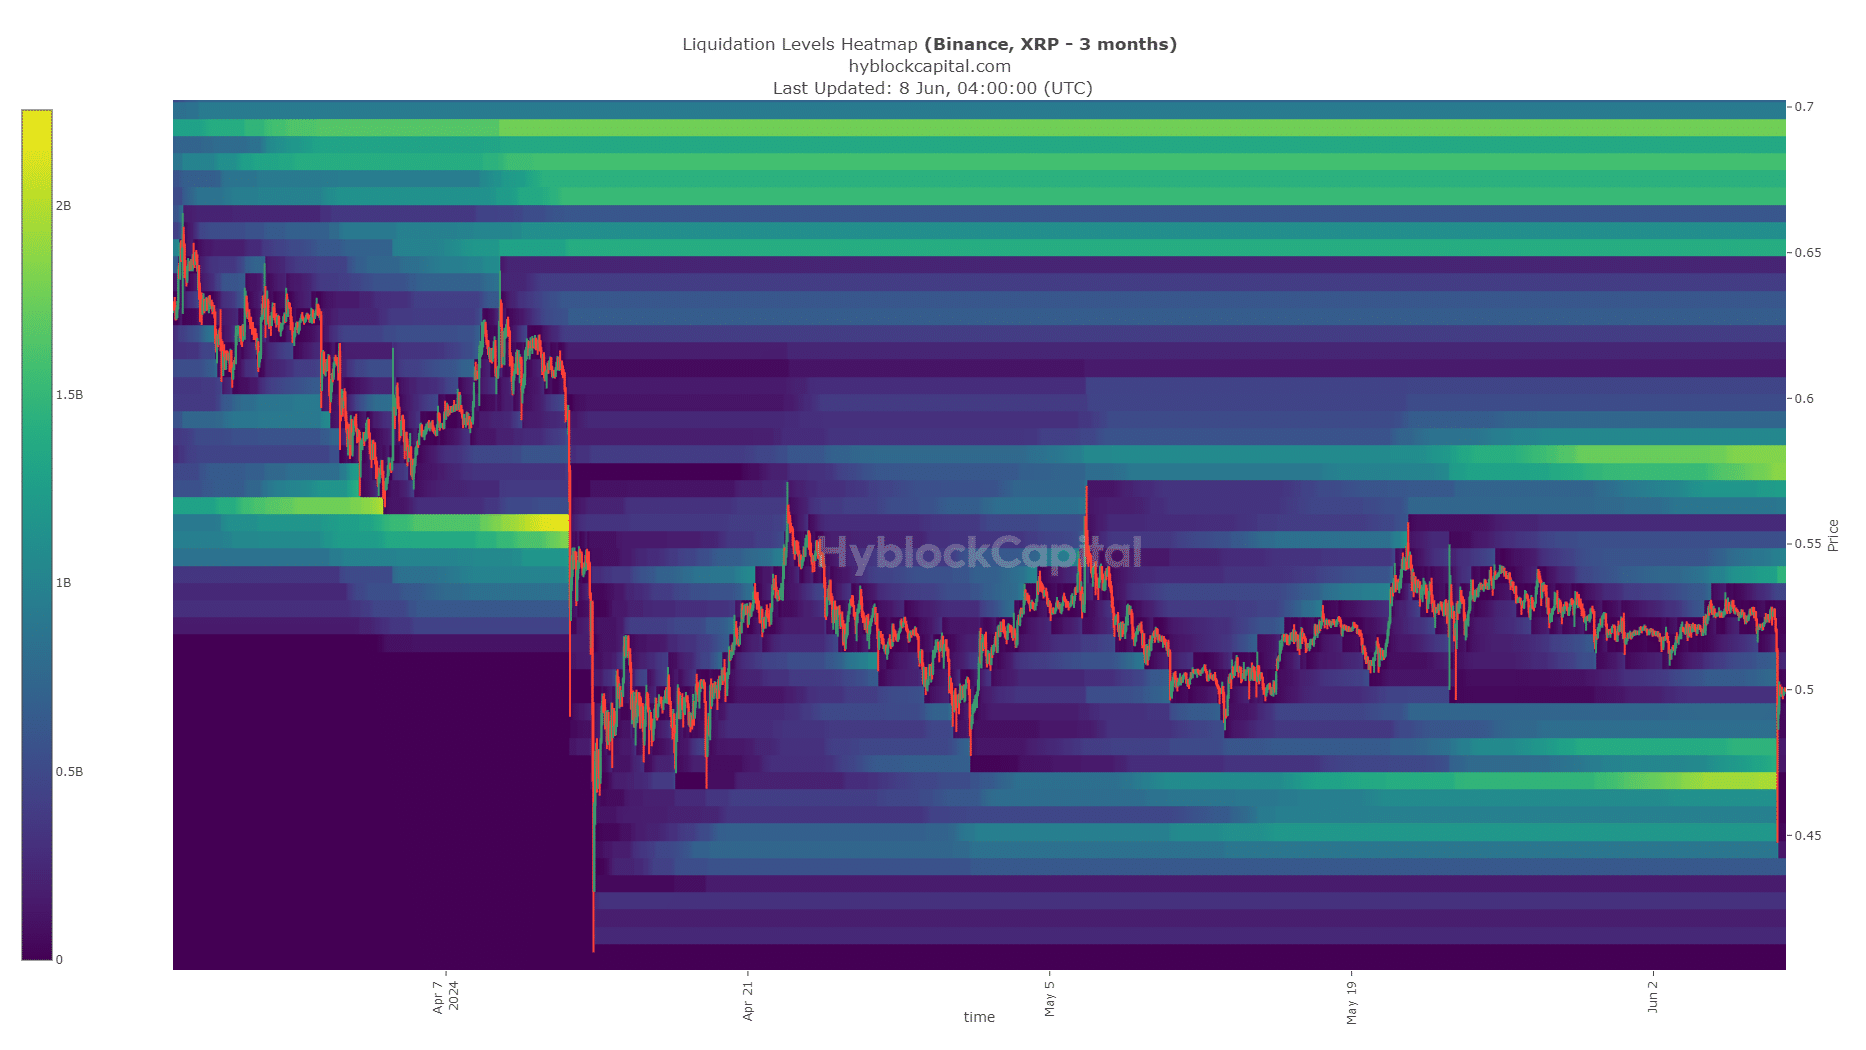
Source: Hyblock
The price action chart and the technical indicators signalled bearishness. On the other hand, the liquidations chart revealed that traders might want to counter-trade the downtrend. The liquidity pockets down to $0.45 have been swept too.
Is your portfolio green? Check the Ripple Profit Calculator
The next large cluster of liquidity lies at $0.58, which is the mid-range level of the 10-month range. Therefore, though it would be counterintuitive, it seemed likely that XRP might surge towards $0.58 in June before another rejection.
Disclaimer: The information presented does not constitute financial, investment, trading, or other types of advice and is solely the writer’s opinion.
XRP has been rangebound over the last ten months. It formed a smaller range over the past two months and did not show signs of breaking out of this range at press time. In fact, the technical indicators suggested that a price bounce from $0.514 might happen.
Alas, this did not come to pass. XRP fell by 14.6% on 7 June, and it did so after bouncing by 10% from its lows, signaling a news-driven impulse move. What can traders expect from the altcoin next?
Source: XRP/USDT on TradingView
The two-month range (yellow) extended from $0.47 to $0.56. The mid-range level at $0.514 served as support earlier this week, but Friday’s Bitcoin [BTC] crash dragged XRP down. This flipped the lower timeframe structure bearishly.
The OBV has been on a downtrend since April. It tried to recover in May, but over the past ten days set lower lows. This revealed that even though XRP was above the short-term range’s mid-level, buying pressure remained weak.
The RSI on the daily chart was also below neutral 50, signaling a downtrend in progress. This, combined with the loss of the psychological $0.5 zone, could see XRP drop as low as $0.45.
Source: Hyblock
The price action chart and the technical indicators signalled bearishness. On the other hand, the liquidations chart revealed that traders might want to counter-trade the downtrend. The liquidity pockets down to $0.45 have been swept too.
Is your portfolio green? Check the Ripple Profit Calculator
The next large cluster of liquidity lies at $0.58, which is the mid-range level of the 10-month range. Therefore, though it would be counterintuitive, it seemed likely that XRP might surge towards $0.58 in June before another rejection.
Disclaimer: The information presented does not constitute financial, investment, trading, or other types of advice and is solely the writer’s opinion.
Marks shared a chart on his X (formerly Twitter) platform in which he predicted Dogecoin could enjoy a 21,700% price gain and rise to $17. The analyst made this forecast based on Dogecoin’s historical breakout trend, in which the meme coin has had larger runs in every subsequent bull run.

During the 2017 bull run, Dogecoin is known to have enjoyed a price gain of over 7,100%, while the meme coin made a price move of 22,800% in the 2021 bull run. As such, Marks believes Dogecoin will make a larger run in this bull run than the one in 2021, making the rise to $17 feasible.
However, some of his followers believe that it is unlikely that Dogecoin will rise to such heights since, based on its current circulating supply, that would give the meme coin a market cap of over 2 trillion. As such, that has put a question mark on Marks’ ambitious price prediction, given how much the crypto market will need to explode before DOGE can have such a market cap.
However, other crypto analysts like Kevin (formerly Yomi OG) have shared bullish price predictions for Dogecoin, although nothing compared to Marks’. Kevin predicts that the foremost meme coin could rally to over $3 in this market cycle. He made this prediction while alluding to Dogecoin’s price action in previous cycles.
The analyst claimed that Dogecoin has never failed to meet or surpass the 1.618 Macro FIB extension measured from previous bull market highs to bear market lows—Dogecoin’s current 1.1618 FIB level is said to be at $3.80, meaning that it could rise to this price level in this bull run.
Kevin revealed in a recent X post that Dogecoin is creating “massive bullish divergence on the weekly Stoch RSI (Relative Strength Index).” He also noted that Dogecoin is currently forming a higher low and added that the last time DOGE was at $0.08, the last time it crossed bullish. Based on this, he claims big moves are on the horizon for the foremost meme coin.
Crypto analyst Crypto Kaleo also recently predicted that Dogecoin will outperform Bitcoin in this market cycle. He further remarked that this is a meme supercycle and that the “king of memes” would not be left behind. In another X post, he claimed that Dogecoin looks ready for that parabolic move to the upside.

Featured image created with Dall.E, chart from Tradingview.com
Furthermore, top tokens have recorded a significant correction in their respective portfolios, with the market leaders Bitcoin and Ethereum tokens plunging below their important support levels, highlighting a negative outlook for these tokens during the coming time.
With the rising price volatility in the cryptocurrency market, will Bitcoin (BTC), Ethereum (ETH), and Ripple (XRP) tokens record a strong bullish bounceback in their respective portfolios during the upcoming week?
Despite increased price volatility in the crypto market, Bitcoin price continues to trade in a closed range between $67,775 and $73,750, indicating a weak price action. However, BTC has jumped 10.34% within the past 30 days and has a YTD return of 64.20%, indicating a long-term positive influence.
The Simple Moving Average (SMA) displays a high possibility of a bearish crossover in the 1D time frame, suggesting increased negative influence for the BTC token in the crypto space.
The technical indicator, MACD, shows a constant flatline in the chart, indicating a weak price action for the BTC price in the market. Moreover, the averages display a neutral trend, highlighting a mixed sentiment.
If the market holds the Bitcoin price above the support level of $67,775, the bulls will regain momentum and prepare to retest its ATH in the coming time. However, bearish price action could pull the BTC coin price toward its lower support level of $60,000 this month.
After holding its price above its important support level of $3,730 for about three weeks, the ETH price has lost momentum due to increased bearish sentiment in the crypto space and has recorded a correction of 3.5% within the past day and 2.26% over the past seven days.
The Relative Strength Index (RSI) fails to breach the overbought range, resulting in it recording a sharp plunge toward the mid-point. Furthermore, the average shows a bearish curve, suggesting a negative outlook for the Ethereum price in the coming time.
If the market pushes the ETH coin price above the resistance level of $3,370, the bulls will regain momentum and prepare to test its upper resistance level of $4,100 during the upcoming weeks. Conversely, if the bears continue to dominate the market, it will test its low of $3,400 this month.
The Ripple token continues to display a weak price action by trading under a bearish influence. The XRP price has recorded a correction of 4.28% within the past day and 3.71% over the past week. Moreover, the Ripple price has lost 4.12% within the past month and has a YTD return of -20.64%.
The RSI displays a sharp fall toward its oversold range after failing to hold above the neutral point, highlighting increased selling pressure in the crypto space. On the other hand, the average displays a bearish convergence, suggesting a negative outlook for the XRP token in the coming time.
If the bulls regain power, the Ripple price will prepare to retest its resistance level of $0.5340 during the upcoming weeks. Negatively, if the bears continue to dominate the market, the XRP coin price will plunge toward its crucial support level of $0.480.
With the increased price fluctuations in the cryptocurrency space, top altcoins continue to record mixed sentiments. However, the market is predicted to display a strong bullish reversal during the upcoming weeks.
Moreover, Bitcoin price is expected to make a strong comeback with a high potential to record a new all-time high (ATH) in the coming time. This could further lead to Ethereum, and XRP tokens following in their footsteps by experiencing a similar price action and adding significant value to their respective portfolios.
Bears are not stepping back, according to CoinStats.BTC chart by CoinStats
The price of Bitcoin ![]() BTCUSD has declined by 2.73% over the last 24 hours.Image by TradingView
BTCUSD has declined by 2.73% over the last 24 hours.Image by TradingView
On the hourly chart, the rate of BTC is in the middle of the narrow channel. Buyers may start thinking about an upward move only if they restore the price to the $69,500 zone. In this case, there is a chance of a resistance breakout.Image by TradingView
On the daily time frame, the situation has not changed since yesterday. Neither bulls nor bears are dominating, which means sharp moves are unlikely to happen soon.
All in all, ongoing sideways trading around the $69,000 mark is the more likely scenario.Image by TradingView
From the midterm point of view, the price of BTC has once again failed to fix above the $70,000 zone. While the rate is below that mark, one can expect a correction to the $66,000 range.
Bitcoin is trading at $69,349 at press time.
MATIC is the native token of Polygon, a blockchain platform that aims to create a multi-chain system compatible with Ethereum. Polygon supports decentralized applications (dApps) like DeFi, DAOs and NFTs.
Originally launched as Matic Network in 2017, it rebranded to Polygon in February 2021 to expand from a single Layer 2 scaling solution to a comprehensive platform integrating multiple Layer 2 solutions and standalone blockchains. Polygon uses a proof-of-stake consensus mechanism, similar to Ethereum, and the MATIC token is ERC-20 compatible. Polygon Labs operates it.
MATIC reached a peak of $2.92 in December 2021 but has since declined to $0.71 as of June 7, a nearly 76% drop. This decline is notable given the recent bullish trends in the broader crypto market.
Over the past two months, MATIC has consistently traded below the EMA 100, indicating a bearish trend. The last significant attempt to break above the EMA 100 was on April 9. A breakout could see the price ascend to higher resistance levels, including the 0.5 Fibonacci level between $0.78 and $0.80.
MATIC is considered a “sleeping giant” by holders who see strong growth potential. Many users stake their tokens to earn passive income, with staking yields around 3%. Polygon’s recent Napoli upgrade aims to enhance scalability and performance, which could positively impact MATIC’s price.
The MVRV ratio, using a 365-day moving average, has shown a buy signal with a value of -12.58%. This ratio compares MATIC’s current market price to the average acquisition price of all tokens.
According to the “State of Polygon Q1 2024” report by Messari, Polygon’s gaming activity surged in Q1, 2024, with daily gaming addresses increasing by 1,615% to 207,000 and daily gaming transactions rising by 469% to 734,000, driven mainly by MATR1X FIRE.
Key developments in Polygon’s gaming ecosystem include the launch of the $100 million Inevitable Games Fund by Immutable, King River Capital and Polygon Labs, and Square Enix’s collaboration with Animoca Brands for the NFT game Symbiogenesis.
Other growth metrics include:
Overall, these developments indicate strong performance for Polygon in the upcoming months, though the exact scale and longevity of a potential rally remain uncertain.
About the author
Dan Burgin
Sellers continue their pressure at the beginning of the weekend, according to CoinMarketCap.
DOGE has lost a lot of value today, falling by 8.21%.
DOGE is trading at $0.1474 at press time.
About the author
Denys Serhiichuk


 Price Might Skyrocket")
