The main tag of cryptocurrency price today Articles.
You can use the search box below to find what you need.
[wd_asp id=1]
The main tag of cryptocurrency price today Articles.
You can use the search box below to find what you need.
[wd_asp id=1]

Dogecoin (DOGE) is currently trading at $0.1522, down 1.77% in the last 24 hours, with a 24-hour trading volume of $819 million. Ranking #9 on CoinMarketCap, Dogecoin has a market cap of $22 billion and a circulating supply of 144 billion DOGE coins.
This Dogecoin price prediction explores the next potential targets for DOGE as it hovers around the $0.15 level.
On the 4-hour chart, DOGE highlights the pivot point at $0.15100, suggesting a bullish Dogecoin price prediction. Immediate resistance is identified at $0.15950, followed by $0.16980 and $0.18440.
On the downside, immediate support is found at $0.14270, with further support levels at $0.13240 and $0.12030. The Relative Strength Index (RSI) is currently at 53, indicating neutral conditions. The 50-day Exponential Moving Average (EMA) is positioned at $0.15130, suggesting that the market is maintaining a bullish bias above this level.
Dogecoin has formed a symmetrical triangle pattern, presenting a significant hurdle around the $0.1545 mark. Simultaneously, support persists around the $0.1513 level, reinforced by the 50-day EMA.
The current market price above the 50 EMA indicates a bullish bias, but Dogecoin must break above the $0.1595 resistance level to confirm a continuation of the upward trend. The RSI supporting a buying trend, given its position above 50, further strengthens this outlook.
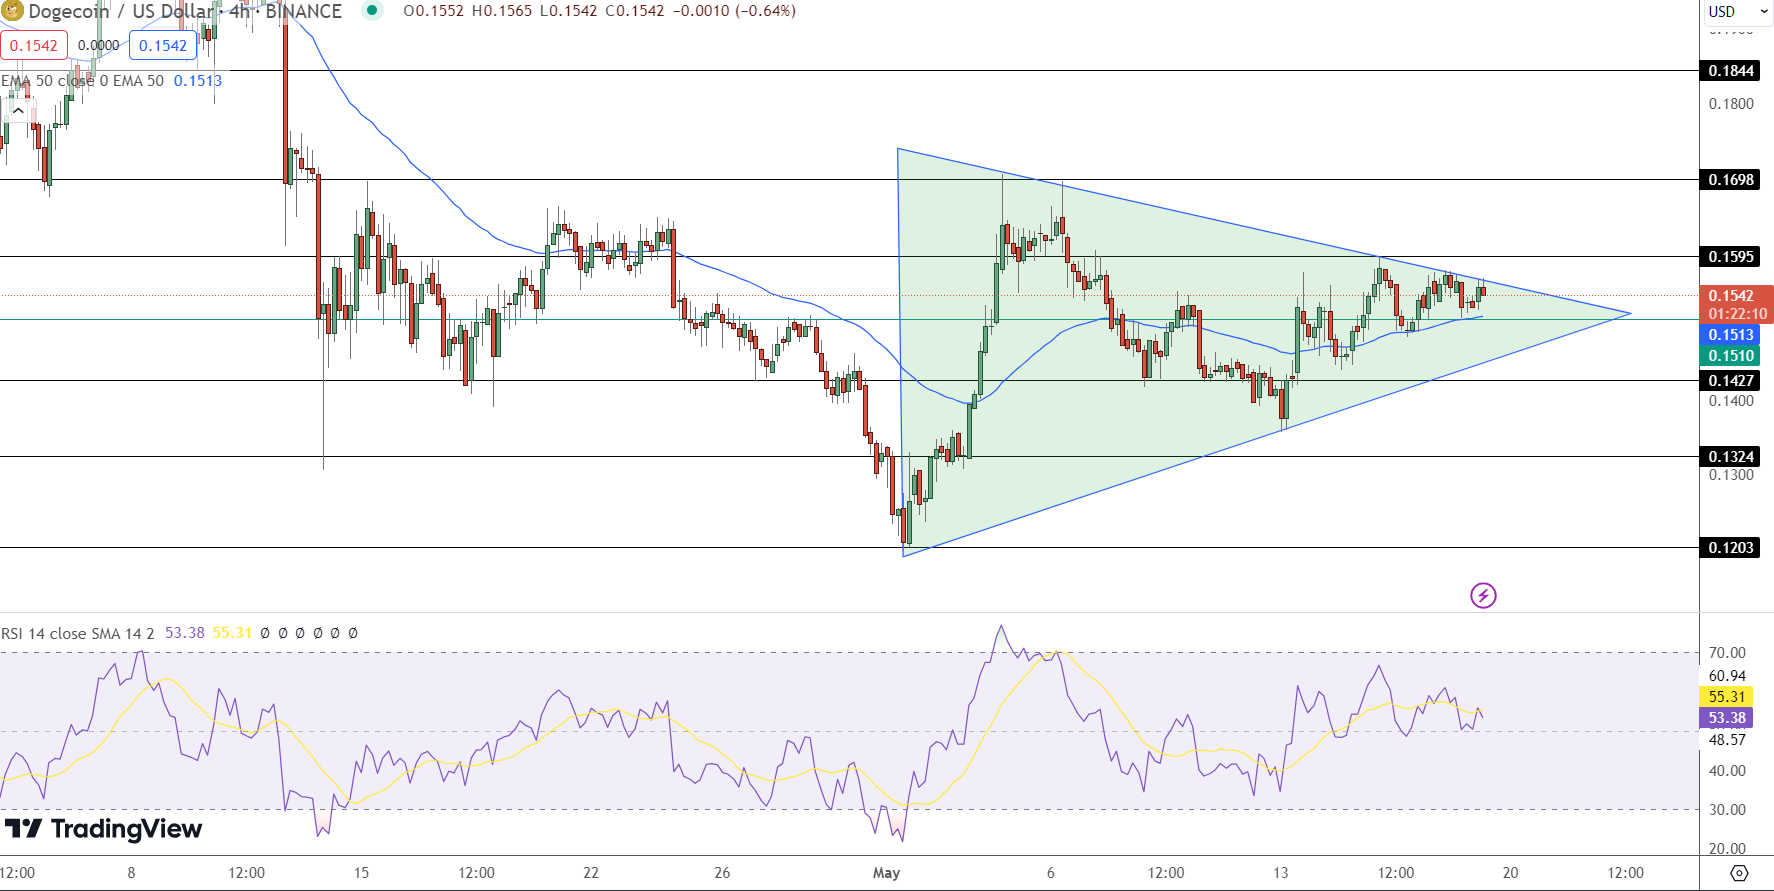
Dogecoin Price PredictionShould Dogecoin maintain its position above the $0.15100 pivot point, it could drive prices higher toward the resistance levels at $0.15950, $0.16980, and $0.18440.
However, a break below this pivot point could trigger a sharp selling trend, pushing the price towards the support levels at $0.14270, $0.13240, and $0.12030. The market’s response to these key levels will be crucial in determining Dogecoin’s near-term direction.
In conclusion, Dogecoin’s technical outlook remains bullish above the $0.15100 pivot point. The immediate resistance at $0.15950 will be the first hurdle to overcome, followed by $0.16980 and $0.18440.
The RSI’s current level suggests room for further gains, although caution is warranted if Dogecoin falls below the pivot point. The 50-day EMA at $0.15130 provides a solid base for the ongoing uptrend.
Dogeverse, the rapidly expanding meme coin network that spans multiple blockchains, including Ethereum, BNB Smart Chain, Polygon, and soon Solana, Base, and Avalanche, has made a notable splash in the cryptocurrency world.
The project has successfully raised over $15 million, surpassing its initial goal of just under $13 million. Currently priced at $0.00031, Dogeverse is set for a price increase in less than a day.

This broad expansion aims to blend the popular Doge appeal with superior blockchain capabilities, promising greater utility and wider adoption. With the launch imminent, this is your last chance to invest in Dogeverse at the current rate.
For more updates and to engage with the community, follow Dogeverse’s official channels on Twitter and Telegram.
Disclaimer: Crypto is a high-risk asset class. This article is provided for informational purposes and does not constitute investment advice. You could lose all of your capital.
The prices of most coins are falling again, according to CoinStats.
The rate of Solana (SOL) has dropped by 2.52% over the last day.
If buyers cannot seize the initiative by the end of the day and the bar closes near its low, there is a possibility of a test of the $160-$165 area next week.
SOL is trading at $169 at press time.
About the author
Denys Serhiichuk

Solana (SOL) is trading at $172.84, down 0.53% in the last 24 hours, with a 24-hour trading volume of $2.19 billion. Ranked #5, Solana has a market cap of $77.59 billion and a circulating supply of 448.92 million SOL coins.
This Solana price prediction examines whether SOL can maintain its push toward $170 and potentially reach $1,000 by June.
Solana‘s 4-hour chart highlights the pivot point at $171.79, which is critical for Solana’s near-term price action. Immediate resistance is identified at $176.66, followed by $183.26 and $188.53.
On the downside, immediate support is found at $165.72, with further support levels at $156.75 and $151.08. The Relative Strength Index (RSI) stands at 73, indicating overbought conditions.
The 50-day Exponential Moving Average (EMA) is positioned at $155.79, supporting the overall uptrend.
The upward channel supports the current bullish trend, but resistance is emerging around the $175 mark. The trendline extending through this level indicates a potential barrier to further price gains.
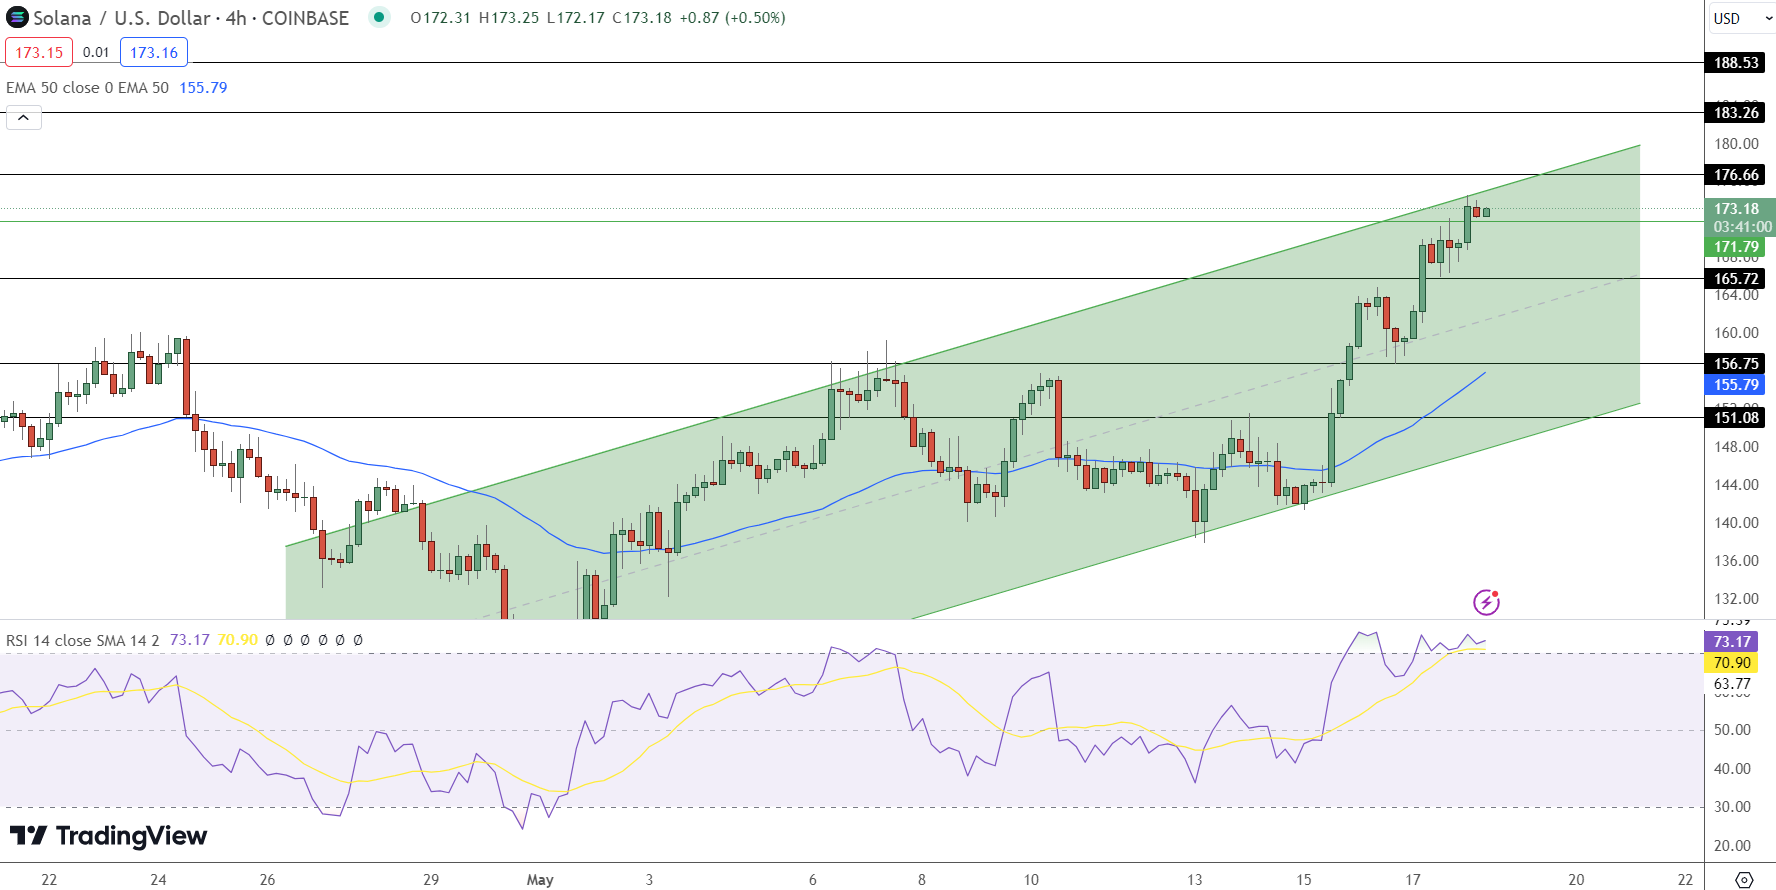
On the lower side, the $171.79 pivot point is crucial, acting as immediate support. If Solana maintains its position above this pivot point, it could support continued upward momentum.
However, a break below $171.79 could trigger a sharp selling trend, pushing the price towards the next support levels at $165.72, $156.75, and $151.08. The market’s reaction to these key levels will be vital in determining the near-term direction of Solana’s price.
In conclusion, Solana’s technical outlook remains bullish as long as it stays above the $171.79 pivot point. The immediate resistance at $176.66 will be the first hurdle to overcome, followed by $183.26 and $188.53.
The RSI’s high value suggests caution, as overbought conditions may lead to a pullback. The 50-day EMA at $155.79 provides a solid base for the ongoing uptrend.
Meet Sealana, the chubby seal who’s made a splash in the Solana Sea. Whaled at his PC and expanding daily, Sealana has traded his youthful figure for a diet of chips and tinned tuna.
This adorable seal is completely engrossed in the degen market, tirelessly searching for the next big Solana meme coin. His relentless pursuit keeps his flippers busy, and his living room is a delightful mess.
Join the excitement and be part of the Sealana journey. The presale offers a chance to buy $SEAL at just $0.022 per token. With a current raise of $1.77 million, the Sealana presale is gaining impressive traction.
Don’t miss out on this opportunity to dive into the Solana ecosystem with Sealana.
Disclaimer: Crypto is a high-risk asset class. This article is provided for informational purposes and does not constitute investment advice. You could lose all of your capital.
Since last month, Matic has been finding it difficult to regain momentum as the price remained trapped under $0.8. Although the crypto has found support above the $0.6 level but there’s not enough volume inflow to bring the market out of the wood.
Looking at the market structure, which looks more like an accumulation phase on the daily chart, the price is likely to explode soon. Where will it go next is yet unknown. But considering the last 72-hour surge that brought some recovery in the market, we can say the bulls are in control.
However, this recovery is not significant enough to validate a shift in the market structure as the price continues to trade in a tight range daily.
The key indicator to pay attention to for bullish lies in the broadening wedge pattern, which has been forming since last November. As shown on the daily chart, Matic is ranging at the wedge’s lower boundary.
A surge above $0.8 should validate an upward shift in the trend. And if that happens, we can expect a rally to the upper boundary of the wedge in the coming months. The only condition for bearish right now lies in a breakdown of this wedge.
While surging towards last week’s $0.77 resistance, higher levels to watch for an increase is $0.853, followed by the $0.95 resistance.
The current surge is supported by the weekly $0.645 support. A crack below this level could dip the price to $0.60 and potentially $0.55.
Key Resistance Levels: $0.77, $0.853, $0.95
Key Support Levels: $0.645, $0.60, $0.55
Disclosure: This is not trading or investment advice. Always do your research before buying any cryptocurrency or investing in any services.
Follow us on Twitter @nulltxnews to stay updated with the latest Crypto, NFT, AI, Cybersecurity, Distributed Computing, and Metaverse news!
Image Source: benedak/123RF // Image Effects by Colorcinch
The weekend has started neutrally for the cryptocurrency market, according to CoinMarketCap.
The price of Cardano (ADA) has dropped by 1% over the last 24 hours.
In this case, there is still a chance of a correction to the $0.46-$0.47 area next week.
ADA is trading at $0.4779 at press time.
About the author
Denys Serhiichuk
Despite ongoing legal troubles, blockchain firm Ripple recorded impressive growth in the first quarter of 2024, hitting several milestones.
According to the results report released by Ripple on May 17, XRP spot volumes surged 40% from Q4 2023 to reach $865 million in Q1 2024. Daily average XRP derivatives open interest also increased, rising to $500 million from $460 million in Q4 2023.
On-chain transactions grew by 108%, climbing to 251,397,881 from 121,031,713 recorded the previous quarter. Additionally, XRP burned for transaction fees rose by 101%, from 317,271 in Q4 2023 to 636,184 in the first quarter of 2024.
These results potentially highlight the strength of Ripple’s underlying business despite the company’s legal battle with the Securities and Exchange Commission (SEC). These positive metrics are likely to influence XRP’s valuation, potentially impacting its price trajectory.
Currently, XRP is holding the $0.50 support zone, largely remaining in a consolidation zone below $0.60. Investors are keenly watching for catalysts that could help the token rally to the coveted $1 mark.
In examining the XRP price prediction, Finbold consulted the CoinCodex tool, which uses AI-powered machine-learning algorithms for price projection.
According to data retrieved on May 18, the tool projected that XRP is likely to experience bullish momentum and trade at $0.66 by May 31, representing an upside of over 26% from XRP’s current price.

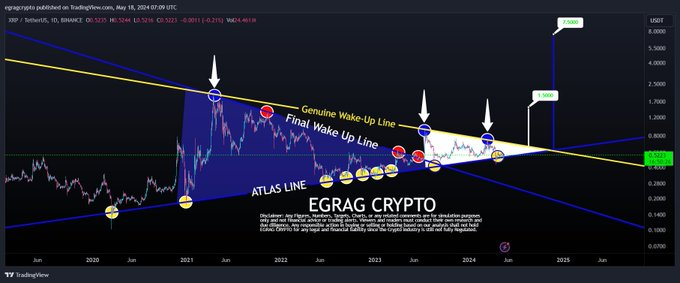
Meanwhile, crypto analyst Egrag Crypto noted in a May 18 X post that XRP is poised for sustained bullish momentum in the coming days. According to the analyst, XRP is facing the “final wake-up line,” which saw the token break out in July 2023 but failed to reach the anticipated heights.
The trading expert highlighted a new development: a white triangle pattern incorporating highs from 2021, introducing the “genuine wake-up line.” Consequently, the expert predicted a breakout around $1.50, with a more ambitious target of $7.50.
In the short term, XRP is experiencing bearish sentiments, having corrected by almost 1% in the last 24 hours to trade at $0.52 at press time. However, on the weekly chart, XRP is up 3%.

Overall, XRP can sustain the bullish projection if it holds above the $0.50 support zone.
Disclaimer: The content on this site should not be considered investment advice. Investing is speculative. When investing, your capital is at risk.
The market capitalization of Solana stands at approximately $77 billion, placing it at the 5th position among cryptocurrencies. Despite a 20.21% decrease in 24-hour trading volume to $2.7 billion.
Over the past week, Solana’s value has surged from $138 to over $174, marking a notable rise of over 20%. This consistent upward trend highlights Solana as one of the market’s top performers, reflecting strong investor confidence.
In the past month, Solana has seen a 30% increase, fluctuating between $120 and $170. This pattern indicates a bullish outlook, with the coin poised for higher valuations.
The broader cryptocurrency market has also experienced significant gains, with Bitcoin rallying above $67,000 and Ethereum surpassing $3,100. These increases have spurred growth in altcoins like Solana. The ongoing upward trends suggest sustained interest and positive sentiment in the cryptocurrency market.
Solana has significantly benefited from the surge in meme coin trading. The heightened network activity from increased trading volumes often boosts Solana’s price. Experts are optimistic about this rally’s continuation, driven by growing interest in Solana meme coins like BONK, BOME, and MEW.
Solana’s ecosystem is thriving with strong DeFi activity and substantial stablecoin volumes. One of the most anticipated developments is Firedancer, a secondary chain client by Jump Crypto.
A recent CoinGecko report highlights Solana as the world’s fastest blockchain, utilizing only 1% of its capacity while being 46 times faster than Ethereum. The report also revealed that Solana boasts the highest daily average transactions per second (TPS) among blockchains.
This combination of increased meme coin trading, robust DeFi activity, and upcoming network upgrades suggests a promising future for Solana.
Solana is on a notable rise, signaling a potential bullish phase. If this upward trend continues, SOL might surpass the $180 resistance barrier. With ongoing momentum, its value could reach $200 and potentially $250 soon.
Conversely, if market sentiment turns negative, SOL price might stabilize around $170, its nearest support level. A further decline could push it down to $150, highlighting the cryptocurrency market’s volatility.
The 24-hour technical indicators for Solana show a notable increase in price. The Moving Average Convergence Divergence (MACD) indicator shows a bullish crossover with the MACD line at 3.73 above the signal line at 3.62, indicating potential continued upward movement.
The Awesome Oscillator (AO) also supports this bullish sentiment, with a positive value of 13.58, further suggesting increasing buying pressure.
The Relative Strength Index (RSI), currently at 65.06, suggests that Solana is approaching overbought territory, signaling strong buying pressure. Additionally, the Average Directional Index (ADX) at 20.53 indicates that the trend is moderately strong.
Related Articles
Despite a 14.18% decrease in trading volume over the past 24 hours, with $1.01 billion traded, DOGE’s volume-to-market cap ratio stands at 4.62%. The circulating supply of Dogecoin remains at 144.34 billion DOGE, with the total and maximum supply also at the same figure.
The meme coin Dogecoin has recently seen a price resurgence following a prolonged period of minimal activity. In recent trading, Dogecoin’s price fluctuated significantly, ranging from $0.1364 to $0.1587. This volatility resulted in an 8% surge in its value over the past week.
Despite struggling to gain momentum over the past month, Dogecoin experienced a bullish trend with a more than 10% increase, indicating a potential shift towards a sustained positive trajectory.
Dogecoin saw significant movement today as an unknown whale transferred 120 million DOGE tokens to Robinhood, according to Whale Alert. The on-chain data indicated the tokens, valued at $18.55 million, were dumped by the address DDuXG.
This transfer aligns with a recent rise in DOGE’s price, hinting at potential profit-taking by the wallet owner. Additionally, investigations revealed that this same address had previously accumulated 226 million DOGE from Robinhood last month. The substantial transfer underscores active trading and significant liquidity movements in the DOGE market.
If Dogecoin surpasses $0.16, it might face its next major resistance at $0.2, potentially breaking its long-standing trading pattern. Maintaining above this critical level could pave the way for DOGE to target a more ambitious resistance at $0.5.
Conversely, if the DOGE price drops below $0.15, it could retract to the descending support trendline at $0.14. A bearish market sentiment might further pressure Dogecoin, leading to a decline toward a lower support level of $0.13.
The daily technical indicators for the DOGE/USD suggest a period of relative stability with minor price fluctuations. The Moving Average Convergence Divergence (MACD) indicator shows a minor bullish crossover. The MACD line is slightly above the signal line, indicating potential upward momentum.
However, the MACD histogram shows marginal red bars, suggesting that bullish momentum is weak and that there may be some consolidation before a decisive move. The Awesome Oscillator (AO) indicator shows varying market momentum, with green bars indicating a bullish trend. The Relative Strength Index (RSI) stands at 52.41, close to the neutral 50 level, which indicates that DOGE is neither overbought nor oversold.
Related Articles
In a Thursday interview with Bloomberg, Ripple CEO Brad Garlinghouse sounded the alarm on potentially dire repercussions for the entire crypto industry should U.S. Securities and Exchange Commission prevail in its lawsuit against him and his company surrounding their sale of XRP.
In the interview, Garlinghouse stated, “The SEC bringing the case against Ripple was not really just a case about Ripple or about XRP — It’s really about the industry.” He eluded to the fact that the SEC is taking a proactive stance and aggressively targeting the entire crypto industry.
He cautioned that if the SEC is successful in its case against XRP, more actions will be taken by authorities toward crypto businesses. Recently, the financial regulator took disciplinary measures against Kraken for its staking program and Paxos regarding the release of their Binance USD (BUSD) stablecoin.
Highlighting the fact that crypto companies are expanding abroad, Garlinghouse expressed that the US, on the whole, is already behind some other countries, such as the UK, Japan, and Australia, with regulation causing an even large gap to be formed between the countries.
As most of the crypto market battles a bearish wave, Polygon (MATIC) is no exception. Unfortunately, gloomy predictions from AI suggest that MATIC’s downward trajectory may continue into 2023 unless something changes course soon. With this uncertain future comes maligned anticipation and pessimism amongst cryptocurrency enthusiasts everywhere.
CoinCodex’s machine self-learning platform has predicted that Polygon is likely to be trading at $0.463660 by December 31, 2023 – a decrease of 58.6% from its current price point. Finbold retrieved this data on March 6th, so make sure you keep an eye out for the fluctuations in price as we get closer to the date.
The world of finance is undergoing a major revolution as cryptocurrency meets derivatives trading. Revolutionary platforms like the TMS Network (TMSN) are paving the way for creating new and exciting opportunities for investors of all levels.
Powered by blockchain and intelligent algorithms, TMSN provides features such as portfolio management, arbitrage trading signals, non-custodial transactions, and commission revenue sharing. Investors seeking to explore this new frontier of trading can find out more about these unique investment opportunities by downloading the TMS Network (TMSN) whitepaper.
With advanced analytics, advanced research, price aggregation, and social trading, it has never been easier or more exciting to get involved in cryptocurrency derivatives trading. And that’s why seasoned investors are getting in on the TMS Network (TMSN) presale.
Presale: https://presale.tmsnetwork.io
Whitepaper: https://tmsnetwork.io/whitepaper.pdf
Website: https://tmsnetwork.io
Telegram: https://t.me/tmsnetworkio
Discord: https://discord.gg/njA95e7au6
Twitter: https://twitter.com/tmsnetworkio
Not many would expect that development activity would have an impact on Dogecoin’s [DOGE] price. Funnily enough, however, AMBCrypto found that assertion to be untrue.
We realized this after examining the metric in question. At press time, development activity on the network was flat. This has been the case since 24 April. However, DOGE has also been consistently consolidating between $0.13 and $0.16 during this very period.
Development activity measures the rate at which engineers publicly improve a project’s network. Looking back, the metric jumped from 0.39 to 16.24 back in February.
At the time, DOGE’s price skyrocketed from $0.08 to $0.14 to correspond with the aforementioned uptick. Something similar transpired between October and November 2023 too, with both the price and development activity moving hand in hand on the charts.

Source: Santiment
Therefore, it might not be out of place to assume that a hike in the metric might offer a price hike too. Also, if development activity falls, so will Dogecoin’s price.
Now, DOGE could face a hard time reproducing its performance in February and March. Still, it is important to assess other metrics too. This would tell if the prediction is valid or not.
One indicator AMBCrypto looked at was the liquidation levels. This indicator shows estimated price levels where liquidation events might occur.
A liquidation event occurs when a trader’s open position is forcefully closed. Most times, this happens because the trader can no longer meet the requirements of keeping the position open.
At press time, we noticed that the only possible liquidation points between $0.15 and $0.16 were scanty. This lack of liquidity could put DOGE’s price at risk.
This could be the case because Dogecoin’s price might not move to the upside as the zone is not magnetic. Hence, a possible move for DOGE could be a potential sideways movement.
In a worst-case scenario, the price might drop to $0.12. Apart from this indicator, AMBCrypto looked at Dogecoin’s Cumulative Liquidation Levels Delta (CLLD) as well.
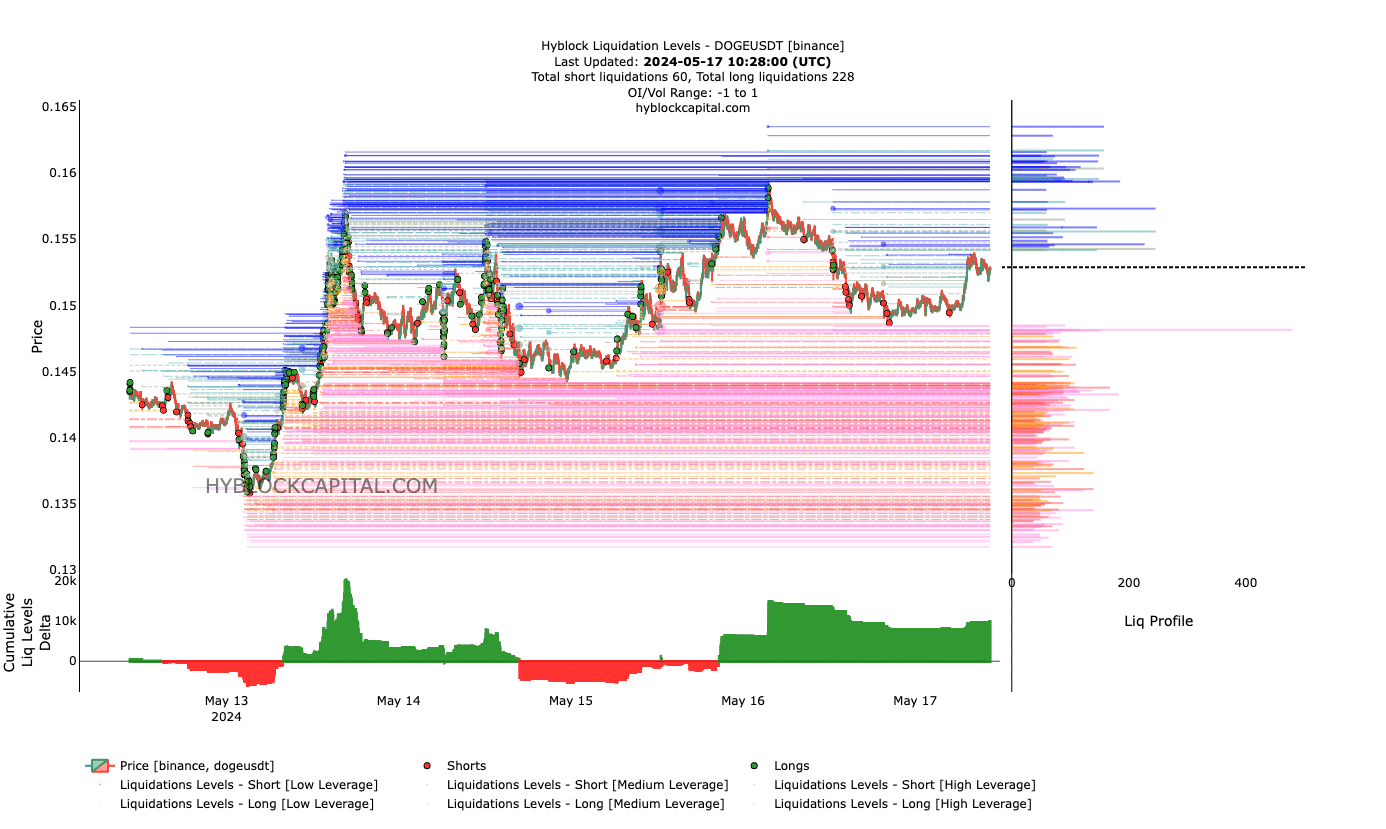
Source: Hyblock
Positive values of the CLLD indicate more long liquidations. On the other hand, Negative values suggest that there are more short liquidations.
At press time, the CCLD was positive. From a price perspective, the reading indicates that Dogecoin might undergo a full retrace. If this remains the case, the $0.12 bearish prediction might be validated.
In addition to the analysis above, AMBCrypto also evaluated active addresses. At the time of writing, DOGE’s 24-hour active addresses were 54,600.
Three months ago, this same figure was over 250,000. Simply put, the decline was proof of decreasing network activity. Beyond that, the one-day circulation was 325.94 million as well.
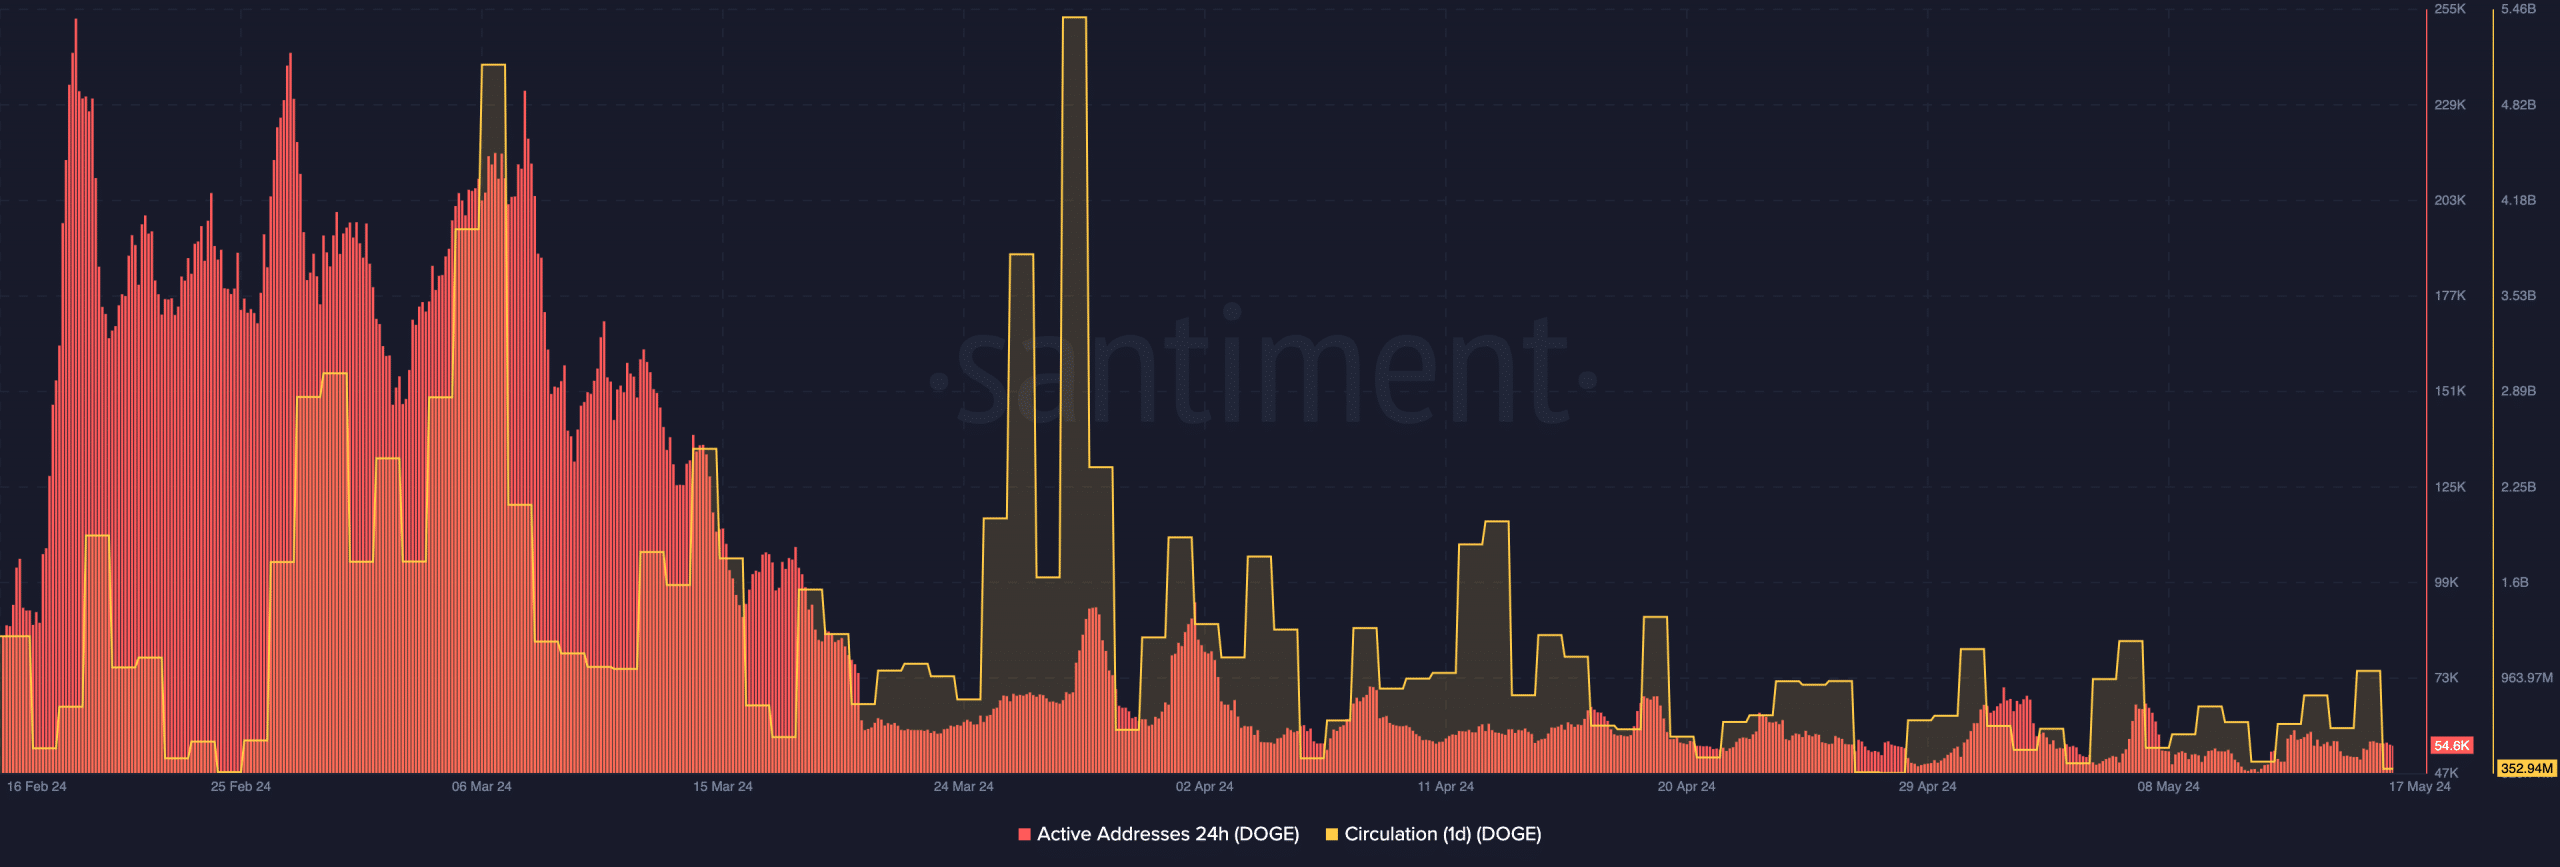
Source: Santiment
Is your portfolio green? Check the Dogecoin Profit Calculator
Concerning the price, this fall in activity could stop DOGE from exponential growth on the charts. However, if things change for the better, DOGE might make a move towards $0.12.
 Price Prediction for May 19")
 – Matic Continues To Range At This Wedge’s Support, Incoming Big Move")
 Price Prediction for May 18")


