The main tag of cryptocurrency price today Articles.
You can use the search box below to find what you need.
[wd_asp id=1]
The main tag of cryptocurrency price today Articles.
You can use the search box below to find what you need.
[wd_asp id=1]
During the recent global crypto market crash, XRP has experienced a decline in performance. In the last month, the token has experienced a 17.84% drop, raising uncertainty about its future path. This decline raises an important question: Is XRP price capable of making a comeback despite current market obstacles? In this article, we delve into the complex environment surrounding XRP to uncover the possibilities of its resurgence in 2024.

The XRP market has experienced fluctuations over the past few days, with a price of $0.507 showing a decrease of 3.12% in the last 24 hours. Over a week, the price has dropped by 5.75% and a decrease of 17.84% over the past month.
The token boasts of a market capitalization of approximately $28 billion, taking its position as the 7th largest cryptocurrency, according to CoinMarketCap.
XRP has experienced a surge in its trading volume by 20.84% in the past 24 hours, totaling $723.35 million, with a circulating supply of 55.24 billion tokens. The token recorded an all-time high of $3.84 on January 4, 2018, although showing a decline of 86.79% since then.
Various factors could influence the price recovery of XRP as discussed next.
The global crypto market has been struggling in its performance with multiple crashes and slow downs before and after the just ended fourth Bitcoin Halving. The recovery of the market is crucial for the price recovery of XRP due to various factors. Market sentiment plays a significant role as positive sentiment can lead to increased buying pressure and demand for XRP.
The price recovery of XRP is influenced by Bitcoin dominance, as a rebound in BTC can boost investor confidence to invest in altcoins such as XRP. Increased investor trust and willingness to take risks in the market rebound could drive up the demand for XRP.
Market dynamics play a role as well, with correlations between cryptocurrencies weakening during recovery, potentially benefiting projects like XRP perceived as undervalued or strong. Additionally, bullish technical signals and patterns during market recovery can attract technical traders to XRP, further boosting investor confidence in its price resurgence.
Despite a 17% increase in XRP’s price over the past 10 days, the trading volume is still on the rise. The continuation of the upward trend will rely on the presence of enough demand to uphold it.
A substantial rise in trading volume indicates increased activity and interest in XRP. Increased levels of trading activity can enhance liquidity and aid in determining prices, simplifying the process of matching buy and sell orders in the market. In case the rising volume comes with purchasing pressure, it may signal a boost in investor trust and aid in the recovery of prices.
Ripple continues to face a major obstacle in its legal conflict with the SEC. The result of this situation is predicted to greatly affect the price of XRP. If XRP is considered a security, uncertainty regarding its regulatory status could result in limitations and reduced investor trust.. Market perception may worsen, deterring new investors and businesses.
Legal challenges could also hinder partnerships and adoption of Ripple’s technology. This could limit XRP’s utility and ecosystem growth, affecting its price recovery. Additionally, market volatility and speculation may increase due to legal proceedings, causing sharp price fluctuations in XRP.
Investors must consider the risks and opportunities presented by these legal issues. A positive resolution could boost market sentiment and aid in the recovery of XRP’s price.
On June 13, 2023, US judge Analisa Torres ruled in favor of Ripple Labs Inc., stating they did not violate federal securities law with XRP sales. This legal win caused XRP value to surge 75% by late afternoon. This victory is significant as it is the first for a crypto firm against the SEC, although the SEC did secure a partial win in the case.
The acknowledgement by the European Corporate Governance Institute (ECGI) that XRP is a utility token is a major advancement that has the potential to enhance its price recovery through different means. Initially, the clarification offers regulatory certainty, alleviating investor concerns and possibly boosting demand for XRP. Als
Additionally, acknowledging the utility of XRP enhances its position in aiding cross-border transactions, attracting banks and financial firms, and potentially increasing its popularity. Favorable updates from popular organizations such as the ECGI, also have the potential to influence market sentiment and draw in fresh investors, therefore boosting XRP’s value.
Finally, categorizing XRP as a utility token differentiates it from securities, mitigating regulatory uncertainties and attracting risk-averse investors.
Furthermore, the on-chain lending proposal from RippleX has the potential to revolutionize XRP. This loan system is expected to make it easier for digital assets to be lent and borrowed directly on the XRP Ledger, potentially boosting the usefulness and worth of the XRP token.
1/ Today, devs @aanchalmalhotre and Vito Tumas introduced a proposal for a Native Lending Protocol on the XRP Ledger that would further expand its DeFi capabilities. Let’s break down what this means for the ecosystem 🧵
— RippleX (@RippleXDev) April 12, 2024
Although XRP may face obstacles and uncertainties in the future, there are positive indicators indicating a possible increase in its value. XRP is ready to recover from recent obstacles, with its utility token status confirmed by the ECGI and changes in trading volume and regulations. Nevertheless, it is important for investors to stay alert and knowledgeable, taking into account the potential risks and opportunities that come with market conditions and external factors.

The XRP price is trading at $0.5031 as of 3:30 am EST, down 5% over the last 24 hours.
The price of the remittance token is down 20% over the last 30 days and 20% year-to-date. The altcoin has been weighed down by legal challenges since the United States Securities and Exchange Commission (SEC) sued Ripple Labs and its top executives in 2020 for selling XRP as an unregistered security.
Though Ripple secured a partial victory in the case on July 13, 2023, when Judge Analisa Torres ruled in favour of Ripple, the lawsuit took further steps subsequently.
The XRP community is currently awaiting the SEC’s response to Ripple’s Motion to Strike expert testimony. XRP advocate James K. Filan shared an X post on April 23 highlighting Ripple’s Motion to Strike.
#XRPCommunity #SECGov v. #Ripple #XRP @Ripple has filed a Motion to Strike new expert materials the SEC submitted in support of its Motion for Remedies and Entry of Final Judgment.https://t.co/k8M84DxDiz
— James K. Filan 🇺🇸🇮🇪 (@FilanLaw) April 22, 2024
In the court filing, Ripple requested the court to dismiss the SEC’s new submissions supporting its opening brief.
The crypto payments firm claimed:
“The parties engaged in more than three months of remedies discovery. During that time, Ripple served a supplemental expert report on disgorgement and the SEC deposed Ripple’s disgorgement expert. The SEC waited until the filing of its remedies motion to submit the Fox Declaration setting forth its remedies theories and calculations.”
The SEC argued in the opening brief that Ripple continued to break U.S. securities laws even after the agency sued the company. In response, Ripple argued that the regulators did not disclose the expert witness’ identity or testimony during the discovery.
XRP price action has formed an inverted V-shaped pattern on the daily chart. The cross-border payments cryptocurrency was sitting on immediate support from the $0.50 psychological level. A daily candlestick close below this level would see the price drop to complete the V-shaped pattern at $0.4787
Breaching this level would see sellers pull XRP lower, collecting the demand side liquidity below that toward the $0.4277 swing low. Such a move would represent a 15% decline from the current price.

TradingView chart: XRP/USD
This grim outlook was supported by the downward-facing Relative Strength Index (RSI). The price strength at 37 suggested that the bears fully controlled XRP.
The flagship crypto was also facing stiff resistance in its recovery path. If the XRP price were to rise from its current level, it would meet the first roadblock around the $0.55 supply zone and later the $0.56 to $0.5714 supplier congestion area, embraced by all the major moving averages.
Note that the 100-day exponential moving average (EMA) and the 200-day EMA were about to send a call to sell XRP. This will happen once the 100-day EMA crosses below the 200-day EMA, reinforcing the negative narrative for XRP.
Additional psychological barriers lie at $0.60 and $0.65. Rising higher would bring the $0.70 swing high into the picture.


However, as the prominent market gurus expect the rate cuts delayed to December, the uptrend could struggle to gain momentum. Nevertheless, the price action displays promising support levels known for strong bullish reversals.
So, will the crypto market take a bullish turnaround as bulls desire a comeback this week?
Let’s find out more in our BTC, ETH, and XRP price analysis.
Last week’s bearish move caused BTC’s valuation to drop by 2.85%. The correction led to a support trendline breakdown. With this, the crypto warns of a retest of the $60,000 support zone.
Despite multiple bouncebacks from the $60,000 psychological zone, the recent increase in supply warns of a breakdown. Currently, the biggest crypto sustains the flag pattern position in the 1D chart, keeping the hopes alive of HODLers.
Further, the MACD lines are intertwined and falling, but the daily RSI shows a bullish divergence. This divergence increases the possibility of a double-bottom reversal.
If the buyers manage another comeback, the BTC price could shoot to $68,283 or the 23.60% trend-based Fib level.
Despite the weakness in Bitcoin, the second biggest crypto, Ethereum, managed to regain a 3.64% valuation. The recovery marks a bull cycle within a triangle pattern in the 1D chart.
Currently, the positive cycle takes resistance from the overhead trendline and an evening star looms. As the ETH price fluctuates near the 50% Fibonacci level, the volatile move keeps the crypto balanced on the knife’s end.
A breakout rally powered by the broader market recovery could spring the ETH price to the $4,093 peak. However, a downfall under the support trendline will test the 78.60% Fib level at $2,618.
With a massive consolidation range, Ripple’s native token, XRP, fails to give any meaningful bullish last week. As the altcoin drops by 2.76%, it reverts to the psychological mark of $0.50. With this drop, the sellers could soon test the $0.46 support zone.
With the correction wave, the XRP price is headed for a potential double bottom. The daily RSI line projects a bullish divergence and bolsters the upcycle chances.
With a rise in demand, the crypto could hit the $0.74 ceiling, with heightened chances of a breakout.
Following the bearish week, the chances of recovery are improving for the broader market. However, as Bitcoin and altcoins are close to crucial support levels, sideline traders can find bullish entry opportunities.
Further, the breakout chances bolster the possibility of an uptrend and the crypto market recovery.
BNB (BNB), previously also known as Binance Coin (BNB), is a cryptocurrency coin created and issued by the cryptocurrency exchange Binance. Initially created on the Ethereum blockchain as an ERC-20 token in July 2017, BNB was migrated over to BNB Smart Chain in February 2019 and became the native coin of the Binance Chain.
BNB can be used to pay for fees when trading on Binance, and usually at a discounted rate. Due to the primary utility, BNB has seen massive growth in interest throughout the years . Several rounds of token burn events have appreciated BNB price and pushed it up as one of the top-10 cryptocurrencies by market capitalization.
Binance is the cryptocurrency exchange founded by Changpeng Zhao and He Yi in July 2017. Binance started with an Initial Coin Offering (ICO) and has since grown into one of the largest global cryptocurrency exchanges, both in terms of volume traded and market share by web traffic. The Binance exchange is separated into the Spot market, Futures market, as well as the decentralized exchange, Binance DEX.
BNB was initially created as part of the Binance exchange through its ICO. In its whitepaper, Binance states that BNB was designed to be used to pay discounted fees on the Binance platform and also function as the native token powering the Binance Chain.
In addition to the initial use cases, BNB has added other cases both on and outside of the Binance platforms. Here’s an overview of BNB use cases:
There may be more ways to use BNB that have not been covered here, but generally BNB can be used like any other cryptocurrencies to pay for goods and services as long as the merchant accepts it.
BNB (BNB) is designed with token burn in mind to induce scarcity and drive up the value of the token. In its v1.1 whitepaper (archived copy), Binance stated that 20% of Binance’s profits will be used to purchase BNB and subsequently destroyed in every quarter. In 2019, Binance updated its whitepaper to v1.2. In the updated whitepaper, it is stated that BNB burns will now be based on its exchanges’ trading volume.
Since Binance began burning BNB in Oct 2017, 10 rounds of token burns have taken place, with about 16.7 million BNB worth approximately $208 million burned up till January 2020.
BNB (BNB) is supported by various hardware and software wallet providers. The choice between hardware and software wallets is mostly a balancing act between convenience and security to the user. We’ll provide a quick rundown on them in this section.
Generally, hardware wallets (e.g. Ledger) are non-custodial wallets which keep private keys of a wallet offline and only the owner knows it. This is arguably the safest option for storage as the user has full ownership of the coins, but is likely the least convenient as it requires the user to operate additional hardware to spend/use the cryptocurrency.
Non-custodial software wallets (e.g. Trust Wallet, Atomic Wallet) is the next option in terms of safety compared to hardware wallets, although they are likely more convenient. The private keys are also owned by the user, but since the wallet is kept on an online device (eg. the phone), there is a higher risk of losing the funds as hackers can access devices which are connected to the internet.
Lastly, arguably the most convenient yet risky storage method would be storing funds on custodial wallets (eg. on a centralized exchange such as Binance) as users do not own the private keys to the funds. A hack on the storage location can potentially cause users to lose their funds, much like what happened during the infamous 2014 Mt. Gox hack which recorded a massive loss of 850,000 BTC, most of which are customer funds.
Check out the full list of wallets which supports BNB on Binance’s own updated list here.
Yes, if you are looking to enter a long or short BNB position, both perpetual swaps and futures are available for BNB. Perpetual swap trading pairs are available across several platforms, including on Binance’s very own derivative exchange, Binance Futures with the BNBUSDT perpetual swap pair.
Check out the full list of derivative products or derivative exchanges listed on CoinGecko.
BNB tokens can be traded on centralized crypto exchanges. The most popular exchange to buy and trade BNB is WEEX, where the most active trading pair BNB/USDT has a trading volume of $1,985,480.50 in the last 24 hours. Other popular options include Binance and BingX.
The trading volume of BNB (BNB) is $776,316,585.60 in the last 24 hours, representing a 14.80% increase from one day ago and signalling a recent rise in market activity.
The highest price paid for BNB (BNB) is BTC0.01917, which was recorded on May 10, 2021 (almost 3 years). Comparatively, the current price is -13.40% lower than the all-time high price.
The lowest price paid for BNB (BNB) is BTC0.056990, which was recorded on Oct 19, 2017 (over 6 years). Comparatively, the current price is 1,493,039.00% higher than the all-time low price.
Market capitalization of BNB (BNB) is BTC1,458,497.3745 and is ranked #4 on CoinGecko today. Market cap is measured by multiplying token price with the circulating supply of BNB tokens (150 Million tokens are tradable on the market today).
The fully diluted valuation (FDV) of BNB (BNB) is BTC1,458,497.3745. This is a statistical representation of the maximum market cap, assuming the maximum number of 200 Million BNB tokens are in circulation today. Depending on how the emission schedule of BNB tokens are designed, it might take multiple years before FDV is realized.
With a price increase of 1.60% in the last 7 days, BNB (BNB) is outperforming the global cryptocurrency market which is down -5.10%, while underperforming when compared to similar FTX Holdings cryptocurrencies which are up 11.40%.
Bulls are trying to be back in the game at the end of the week, according to CoinStats.
The rate of DOGE has increased by 2.63% since yesterday. Over the last week, the price has fallen by 5.62%.
DOGE is trading at $0.1501 at press time.
About the author
Denys Serhiichuk
Cardano [ADA] saw its DeFi and NFT sectors decline in value last month. User activity was also in a downtrend alongside the price of ADA. The token formed a range between the $0.45 and$0.685 levels.
The Cardano price prediction from AMBCrypto was bearishly biased. There is a good chance of a short-term range formation over the next week or two around the $0.5 mark.
Until $0.568 is flipped to support, the bulls have little power in the market.

Source: ADA/USDT on TradingView
On the one-day chart, the range formation of the past five months was evident. The chances of ADA trending higher in Q2 2024 were shot down when the price fell below the critical $0.568 support level.
This is the same level that marks the mid-range value. At press time, the price was near the range lows once again after facing rejection at the imbalance (white zone).
The RSI has been below neutral 50 for nearly six weeks now.
It indicated firm downward momentum. Additionally, the OBV also slipped below a key support level (dotted white) and signaled strong selling pressure.
Taking these factors together, the Cardano price prediction is more downside, with $0.4 likely to be a key demand zone.
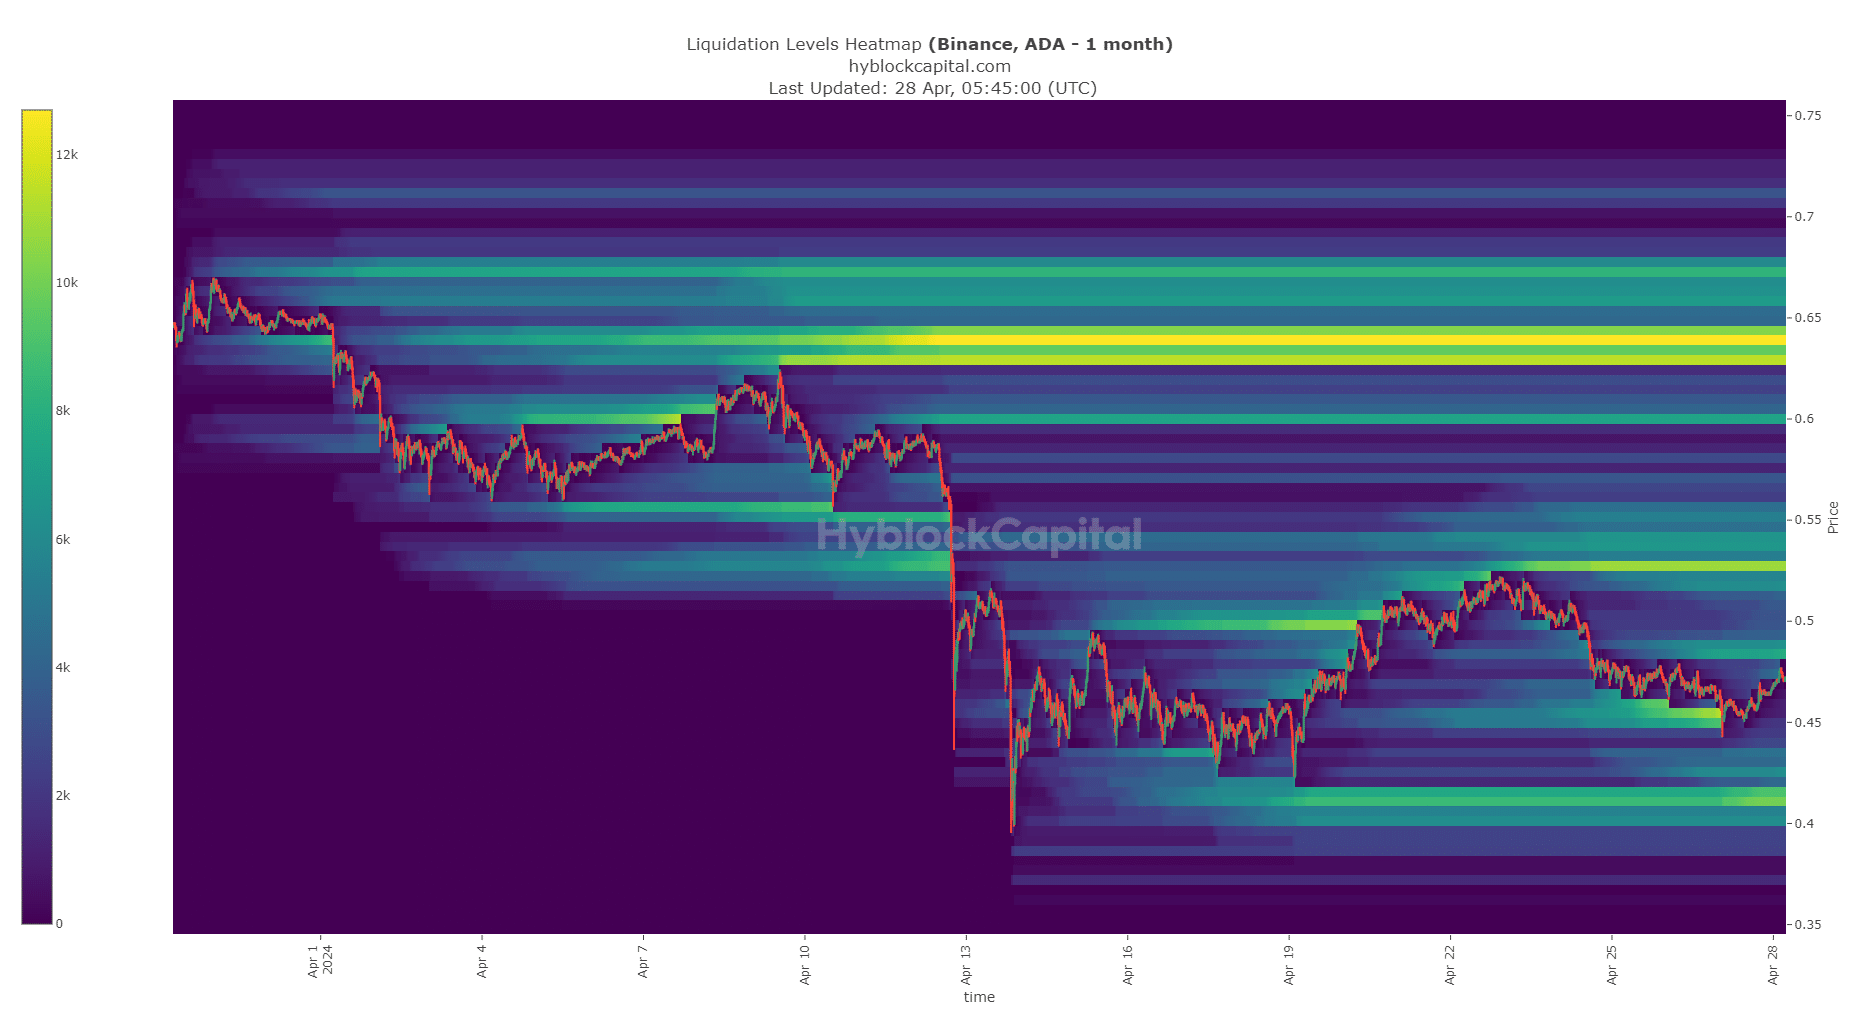
Source: Hyblock
Is your portfolio green? Check out the ADA Profit Calculator
The liquidation heatmap showed that the $0.483 and $0.527 were the next areas of interest. Now that the liquidity at $0.45 was taken, a move toward the $0.5-$0.52 region appeared likely.
To the south, the $0.41 level also possessed a considerable concentration of liquidation levels. Therefore, the $0.41-$0.51 levels would likely be the ones within which Cardano is likely to trade this week.
Disclaimer: The information presented does not constitute financial, investment, trading, or other types of advice and is solely the writer’s opinion.
The Ripple-affiliated XRP cryptocurrency is currently on track to record its ninth consecutive month in the red against Bitcoin, the flagship cryptocurrency.
XRP is now down 72% against the crypto king since Ripple managed to score a partial legal victory against the U.S. Securities and Exchange Commission last July.
The token reached its current all-time high of 0.00025 BTC all the way back in May 2017. Currently, it is down a shocking 97% from that peak.
As reported by U.Today, U.S. District Court Judge Analisa Torres partially sided with the San Francisco-based company, ruling that the secondary sales of the highly controversial token do not constitute a securities offering. The ruling triggered a substantial XRP price rally, but it ended up being short-lived.
In October, Ripple’s top lawyer Stuart Alderoty touted XRP’s unique status in the US since it is the only cryptocurrency that boasts regulatory clarity in the US (apart from Bitcoin).
Ripple is also not off the hook for now. Last year, Judge Torres also ruled that Ripple violated securities offering with its institutional XRP sales. As reported by U.Today, the SEC is demanding that Ripple pays a hefty $2 billion fine. However, Ripple wants to trim that gargantuan sum to a mere $10 million, arguing that it did not show reckless disregard for the securities laws since the company was actively engaging with US regulators.
It remains to be seen how upcoming developments in the Ripple case will affect the XRP price. However, so far, the token’s newfound regulatory clarity has not translated into any meaningful price gains.
About the author
Alex Dovbnya
Also Read: Solana Co-Founder Gives Sarcastic Jib on Meme Coin Situation
With the market-wide recovery taking baby steps, the Solana price showcases an underlying shift in sentiments, teasing a bullish reversal. The altcoin shows lower price rejection from a support trend line, which increases the possibility of a bull cycle.
With a symmetrical triangle visible in the daily chart, the pullback phase takes a lateral shift. However, the sideways shift between the 50D EMA and the 100D leads to a double-bottom formation. This projects a potential bullish turnaround in the SOL price.
Further, the recent gains offer a possibility of a morning star pattern, which is known for kickstarting a bullish reversal. Currently, the SOL price trades at $142.49 with a bullish intraday candle as it reverts from the bottom support trendline.
With the neckline of the double bottom pattern at $160, the ongoing recovery offers a strong possibility of a breakout rally, setting a bullish chain reaction. In such a case, the bull run could surpass the psychological mark of $200.
With multiple breakout events lining up for Solana, the underlying demand increases with the growing attention of sideline traders. Hence, the daily chart offers multiple entry spots and increases the bull run possibility to $250.
Conversely, if a bullish failure leads to a drop under $130, the SOL token could nosedive to $100.
Related Articles
Most coins are facing a bounce back on the last day of the week, according to CoinMarketCap.Top coins by CoinMarketCap
The price of Ethereum ![]() ETHUSD has increased by 4.72% over the last 24 hours.Image by TradingView
ETHUSD has increased by 4.72% over the last 24 hours.Image by TradingView
On the hourly chart, the rate of ETH is returning to the recently formed resistance level of $3,327. If the daily bar closes near it, the accumulated energy might be enough for a breakout to the $3,400 range.Image by TradingView
Bulls are also powerful on the bigger time frame. At the moment, one should focus on the daily bar.
If the candle closes around the current prices and with no long wicks, there is a chance to see a further upward move to the $3,400-$3,500 zone.Image by TradingView
From the midterm point of view, it is too early to think about a bull run even if the weekly bar closes above the previous candle peak. In this case, sideways trading in the zone of $3,300-$3,500 is the more likely scenario for the next week.
Ethereum is trading at $3,310 at press time.


