The main tag of cryptocurrency price today Articles.
You can use the search box below to find what you need.
[wd_asp id=1]
The main tag of cryptocurrency price today Articles.
You can use the search box below to find what you need.
[wd_asp id=1]
Polygon (MATIC), the native token of the Polygon network, has been experiencing a roller coaster ride in terms of price performance over the past year. While much of the cryptocurrency market rallied to new yearly highs, MATIC struggled to keep pace, leaving many investors in the red.
However, recent analysis by a crypto analyst known as Bixley suggests that there may be a light at the end of the tunnel for Polygon investors.
In a detailed analysis posted on the TradingView website, Bixley outlined a bullish case for the MATIC price. According to the analyst, the Polygon price is currently on a trend line just above the $0.7 mark, where the altcoin is currently trading.
For a breakout to occur, this trend line needs to be broken. While a failure to break the trend line could be bearish for the coin’s price, Bixley is optimistic that Polygon will succeed in breaking through, leading to a significant upward movement.
Bixley also drew comparisons between Polygon’s price performance and that of Ethereum in its early days. If this comparison holds true, the MATIC price could be poised for a substantial increase, particularly if it manages to break the trend line.
The crypto analyst outlined multiple price targets for Polygon once the breakout occurs. The first target is set at $1.2, which would represent a 70% increase from the current price level. Beyond that, Bixley expects the price to continue rising, with another target set at $5.4, representing a potential 650% increase. The most ambitious target is placed at $55, which would constitute an astonishing 7,800% price increase.
While Bixley’s analysis paints a highly optimistic picture for Polygon, another crypto analyst has pointed out a worrying trend in response.
This analyst shared a chart highlighting the formation of a death cross on the weekly chart for MATIC, which could indicate a bearish outlook for the price. The death cross, a technical pattern that occurs when a short-term moving average crosses below a long-term moving average, is often seen as a signal of a potential downtrend.
According to this contrasting analysis, the MATIC price could be headed for a steep decline, potentially dropping by as much as 70% from its current level. If this scenario plays out, Polygon investors could face even greater losses.
Despite the conflicting analyses, the recent price action of MATIC has shown some promising signs. In the last 24 hours, the Polygon price experienced a downtrend, followed by a consolidation phase around the $0.71 support level.
Subsequently, the price rallied sharply, surpassing the initial starting point of $0.7282 and moving into a clear uptrend characterized by higher highs and higher lows.
Technical indicators, such as the Alligator Indicator and the Fibonacci Retracement tool, suggest a potential trend reversal and bullish momentum for MATIC. Resistance levels have been identified at $0.738, $0.766, and $0.794, which could act as hurdles for further upside movement. However, the Money Flow Index (MFI) remains neutral, reflecting a balance between buying and selling pressures.
On the other hand, the Bollinger Bands Width (BBW), Chaikin Money Flow (CMF), and Rate of Change (ROC) indicators paint a different picture. The BBW indicates low volatility and a tight trading range, while the positive CMF suggests dominant buying pressure. The ROC, however, signifies minimal momentum in either direction, portraying a stable price movement.

ADA was last changing hands just above $0.50, down close to 3% on the day. After ADA failed to push back above its 21DMA in the $0.52s, sell pressure has picked up.
As per CoinGecko, ADA’s market cap was last around $17.8 billion. That ranks it as the 11th largest by market cap, behind Toncoin (TON) and Dogecoin (DOGE).
Both of these cryptos have market caps of $19.8 and $23.2 billion respectively.
Despite Tuesday’s decline, ADA is still up 25% versus recent lows. The crypto is still down over 20% monthly and more than 15% yearly, however.
Indeed, Cardano has fallen behind other major cryptos in recent months.
While the Cardano price is down 15% in the past 90 days, Bitcoin (BTC) is up 57%. Ether (ETH), BNB (BNB) and Solana (SOL), meanwhile, are up between 40-100% over the same time period.
All of this is probably explained by the fact that Cardano is struggling to achieve real-world adoption.
So, should investors dump all their holdings and switch to other cryptocurrencies?
On-chain metrics demonstrate how Cardano is failing to attract a real base of crypto users.
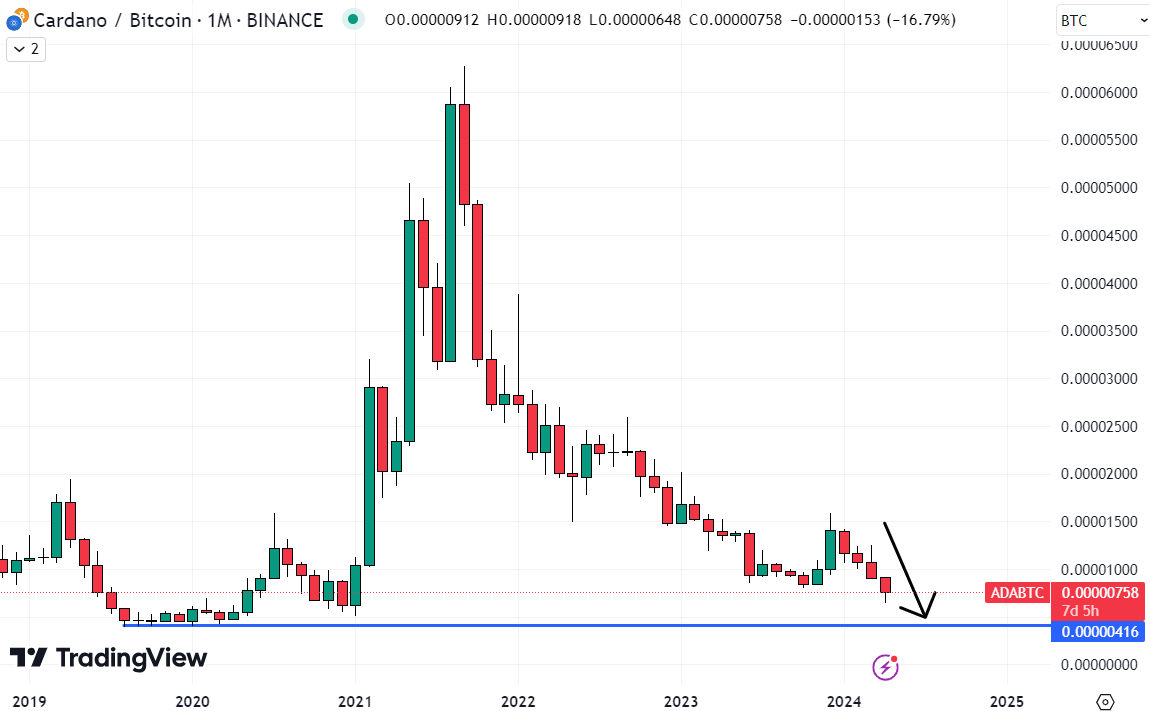
The blockchain has just $416 million in total value locked (TVL), as per DeFi Llama.
That compares to well over $10 billion locked on the Solana blockchain, one of its major competitors.
Indeed, despite ranking as the 11th largest crypto by market cap, Cardano ranks as the 24th by TVL.
Moreover, comparisons of daily transaction counts paint an equally grim picture.
According to Messari data, Cardano rarely sees over 100,000 transactions on a given day. On the other hand, Bitcoin has seen between 300,000 and 750,000 daily transactions in the past year, according to Ycharts.
Cardano is a smart-contract-enabled blockchain that is attempting to house a vibrant web3 ecosystem. So, better comparisons would likely be made with Ethereum or Solana.
Based on this comparison, Cardano fares are even worse. Ethereum normally sees over 1 million daily transactions, as per Ycharts. Solana, meanwhile, typically sees 15-30 million.
It’s no wonder that Cardano’s critics continue to refer to it as a “ghost chain.”
Same repetitive but useless slogan of Cardanzos: DYOR
I did.
50K active users daily max
4.4M wallets
350M TVL
88M transactions
200M liquidity in USDM
… this is RIDICULOUSTell me something I don’t know and that changes my mind. Cardano is a ghost chain.
— Hossa 182 (@182Hossa) April 18, 2024
As long as this narrative of failure to attract adoption persists, Cardano is likely to continue struggling to keep pace with its major peers.
Bitcoin could be on course to hit $100,000 this year, amid slower supply growth post-halving and continued ETF demand.
The ADA/BTC exchange rate could soon fall back to its late 2019/202 lows around 0.000004.
That’s not to say the ADA price will continue to fall in USD. But without faster adoption, it may struggle to push back above $1 in this bull market.
All that being said, the blockchain has dozens of ambitious projects vying to attract users. If any of these projects should at some point start to catch on, Cardano’s fortunes could change.
🧵1/6 – It’s confirmed. Cardano is a ghost chain 👻
Exchange
– @MinswapDEX
– @DexHunterIO
– @axotrade
– @spectrumxnet
– @VyFiOfficial
– @wingriderscom
– @SundaeSwap
– @MuesliSwapTeam
– @TeddySwap
– @CswapDEX
– @OmuraFinance
– @blueshiftfiDeFi
– @LinkageFinance
-… pic.twitter.com/LQKbHEUfmm— CardanoThor (@CardanoThor) January 18, 2024
Crypto investors looking for investments with greater upside potential should look into presale investing.
Web3 projects and protocols often sell their native tokens at an early bird discount to raise funds for development.
If they can find a good project that gains traction in the market, presale investors can book gains of as much as 10x or more.
One such project that analysts at Cryptonews are a big fan of is Mega Dice Casino.
This already well-established crypto casino has launched a presale of its utility token DICE.
Spin your way to big wins and unlock epic bonuses in our #NewGame release #CashCrew by @hacksawgaming at Mega Dice Casino 💸
Do you have what it takes to be part of the crew? 😏
🔗 https://t.co/fawORyTnCC pic.twitter.com/IIV1GaPLaZ
— Mega Dice Casino (@megadice) April 23, 2024
DICE holders get big cashback benefits on their wagers and can also generate passive income via DICE staking.
The crypto casino is also running a series of exciting airdrops to reward early presale investors.
The project is already close to having raised $500,000. And potential investors better move quickly, as when the $1 million milestone is hit, the DICE price will rise.
Check Out Mega Dice Casino’s Presale
Disclaimer: Crypto is a high-risk asset class. This article is provided for informational purposes and does not constitute investment advice. You could lose all of your capital.
Also Read: XRP Whales Move 70 Mln Coin Amid Ripple’s Response To SEC, What’s Next?
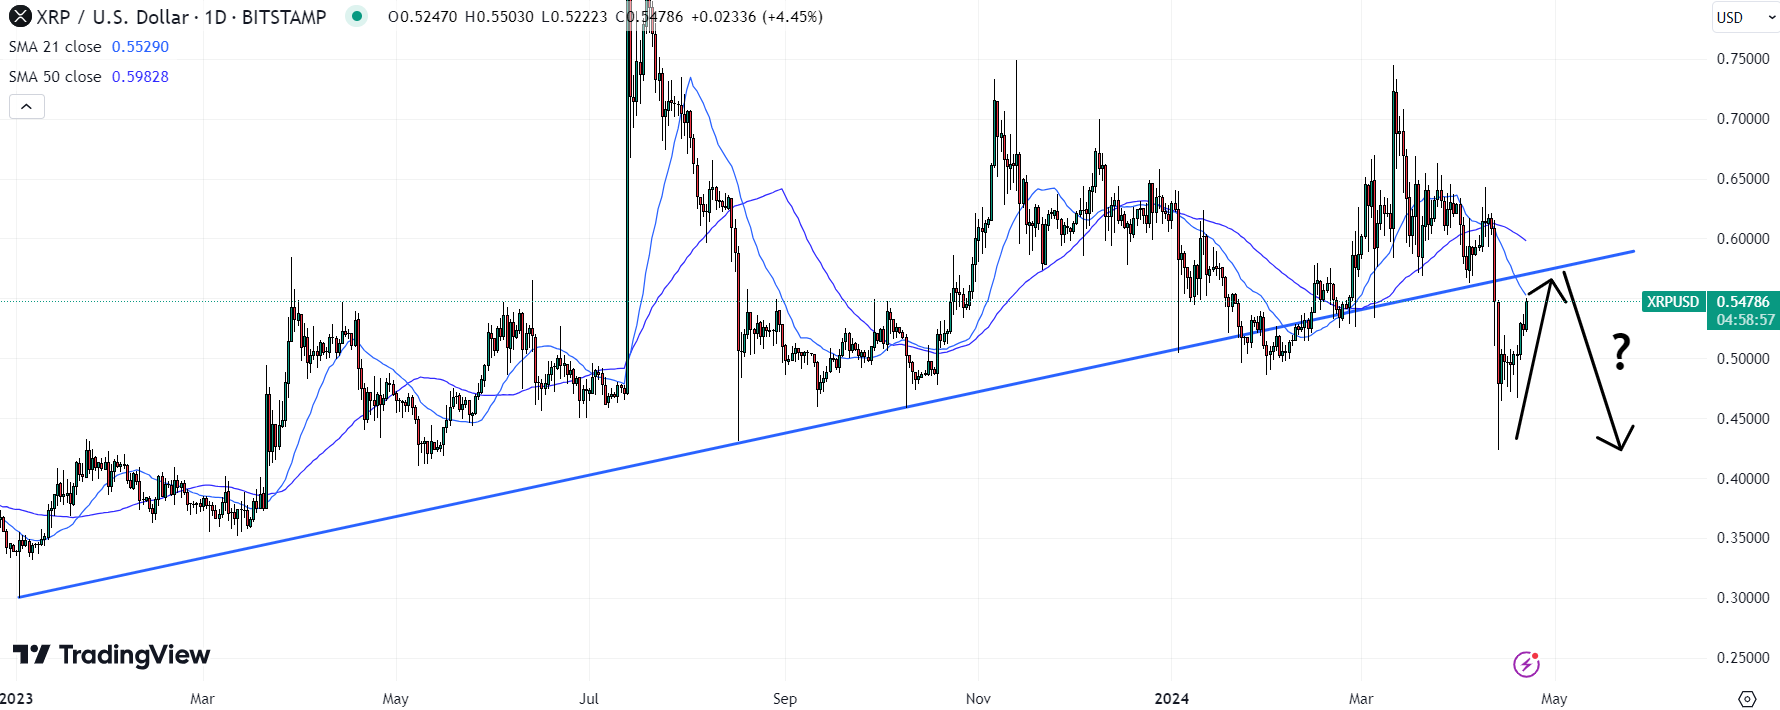
The near-term trend in XRP price is bearish evidenced by the downsloping resistance trendline in the daily chart. This dynamic resistance assisted sellers in a correction from $0.744 to $0.41 low, registering a 43.7% loss.
However, with Bitcoin Halving last week, the XRP price managed to hold above $0.466 and rebound sharply along with the BTC price to $37k.
XRP is currently trading at $0.54, maintaining its stance as the seventh-largest cryptocurrency by market capitalization, which stands at $30.11 billion, according to data from CoinMarketCap.
According to analytics firm Santiment, the recent surge correlates with the growing number of XRP wallets holding over 1 million coins, which has been on the rise for the past six weeks, marking a 3.1% increase.
As of April 22, 2024, the count of such wallets reached 2,013, just one wallet shy of setting a new all-time high. This metric is an essential indicator of substantial holding interest amongst investors and could be a precursor to future price movements for XRP.
However, for buyers to regain control over this asset they must breach the aforementioned trendline. A successful breakout would accelerate the bullish momentum and bolster buyers to retest $0.7 high.
Also Read: Ripple v SEC News: Lawyers Reveal Appeal, Settlement, Fine Aspects in XRP Lawsuit
Related Articles
Bulls are trying to hold the gained initiative, according to CoinStats.
The price of Solana (SOL) has risen by 2.08% since yesterday.
Such a scenario is relevant until the end of the week.
SOL is trading at $157.24 at press time.
About the author
Denys Serhiichuk
The cryptocurrency market is slightly rising, according to CoinMarketCap.Top coins by CoinMarketCap
The rate of Binance Coin ![]() BNB has increased by 2% over the last 24 hours.Image by TradingView
BNB has increased by 2% over the last 24 hours.Image by TradingView
The price of BNB is in the middle of a wide channel, between the support of $599.6 and the resistance of $618.3. From the technical point of view, there are low chances to expect any sharp moves until the end of the day as most of the daily ATR has been passed.
Image by TradingView
On the bigger time frame, neither bulls nor bears are dominating as the rate is far from the key levels. Such a statement is also assumed by the falling volume.
In this case, sideways trading in the zone of $600-$620 is the more likely scenario for the next few days.Image by TradingView
On the weekly chart, one should pay attention to the vital zone of $600. If the candle closes above it, traders may expect a test of the resistance level of $645.2 by the end of the week.
BNB is trading at $607.6 at press time.
The Bitcoin price was up by 0.62% reaching $66,301.95 at the time of writing on Tuesday, April 23. On the other hand, it’s trading volume rose 9.66% to $25.60 billion in the last 24 hours. Whilst, the crypto held a market capitalization of $1.30 trillion.
The Ethereum price dropped 0.80% to $3,179.06 at press time with a market valuation of $380.23 billion. Whilst, ETH saw its trading volume gain 8.91%, reaching $11 billion.
The Solana price sustained above the $150 mark today. The Solana price surged by 2.45%, settling at $154.92. In addition, SOL witnessed a 17.49% hike in trade volume to $2.78 billion in the last 24 hours.
Whilst, the XRP price extended above the $0.54 mark. The XRP price recorded a hike of 2%, reaching $0.5482. On the other hand, XRP’s trading volume skyrocketed 61.38% to $1.62 billion.
Meanwhile, the Cardano crypto price dipped 0.27% to $0.5097 today. Whilst, ADA recorded a gain of 8.87% in its 24-hour trading volume, settling at $383.75 million.
The Dogecoin price slipped 2% to $0.158 while its rival, Shiba Inu price dropped by 3.19% and traded at $0.00002642.
Also Read: Bitwise CEO Dissects IMF Bitcoin Flow Report; Here is What to Know
Also Read: XRP Price Prediction: Is $1 Imminent as Market Recovers, SEC Hurdles Remain
Also Read: How High Will Solana SOL Peak Post-Bitcoin Halving?

With the Bitcoin Halving event now over, the price of SOL is expected to surge and note a significant uptick. According to CoinCodex, a leading crypto analytics platform, the month of May can be dubbed a significant period for SOL as its price may peak to breach $169.
“According to our current Solana price prediction, the price of Solana is predicted to rise by 13.75% and reach $169.27 by May 22, 2024. Per our technical indicators, the current sentiment is bullish, while the Fear & Greed Index is showing 73 (greed). Solana recorded 17/30 (57%) green days with 11.80% price volatility over the last 30 days.”
Similarly, another crypto analytics platform, Changelly, predicts that SOL will reach $168 by the end of May 2024.
“Cryptocurrency experts are ready to announce their forecast for the SOL price in May 2024. The minimum trading cost might be $141.34, while the maximum might reach $168.63 during this month. On average, it is expected that the value of Solana might be around $154.99.”
By the end of 2024, Solana may end up catapulting to gain considerable price momentum. Per Solanafloor, SOL is constantly working on expanding its ecosystem. The network has recorded the highest daily active addresses in the last two months.
Also Read: Cryptocurrency: 3 Coins To Buy Now As Bitcoin Reclaims $65,000
“Solana is forecast to trade within a range of $145.50 and $358.90. If it reaches the upper price target, SOL could increase by 137.29% and reach $358.90.”

24-hour trading volumes were last at $1.32 billion, the highest in three days.
XRP was last trading just under $0.55 and eyeing a test of its 21DMA at $0.5530. If it can break above this level, a retest of 2023 into 2024 uptrend in the $0.57 area.
Around this area, many XRP bears will potentially be looking to add to short positions. After all, XRP’s break below its long-term uptrend was a very bearish sign.
That could mean elevated sell pressure and any recovery back toward $0.57 could be short-lived.
But if XRP can rally back above this long-term uptrend, that would suggest the latest dip was a fake-out.
A rally toward the late 2023 and early 2024 double top around $0.75 would be on the cards.
Given that the broader cryptocurrency market could be shaping up for a rally post-halving, the possibility of XRP upside shouldn’t be dismissed.
Macro headwinds appear to have abated before the release of US Core PCE inflation on Friday. And Bitcoin (BTC) is looking perky after the halving, having pushed back above $66,000.
BREAKING: #bitcoin has reclaimed $66,000
— wallstreetbets (@wallstreetbets) April 22, 2024
XRP bulls will be hoping that the latest XRP price upside marks the start of a comeback for the cryptocurrency.
Indeed, XRP has been sluggish in recent months. While Bitcoin and Ether (ETH) went up 56% and 40% in the past 90 days, XRP dropped 12% in the same timeframe.
Some potential fundamental tailwinds could soon come in to help XRP close this gap.
Firstly, Ripple recently announced plans to launch its own USD stablecoin. The hype surrounding this stablecoin could help pump optimism in XRP.
Secondly, the SEC vs Ripple lawsuit could soon come to a close. The SEC has asked for a $2 billion fine for the company that they claimed issued XRP as a security. That should ease concerns about XRP’s regulatory outlook in the US.
XRP’s underperformance in recent months versus other major cryptocurrencies suggests it could be trading at a cheap valuation.
Indeed, the XRP price could easily double back towards $1.0 this bull market. That would take its market cap from around $30 billion to nearly $60 billion.
XRP investors should be cautious, however. XRP’s lack of innovative use cases beyond Ripple’s business operations and lack of decentralization suggests it may struggle to keep pace with Bitcoin, Ethereum, and Solana in the long run.
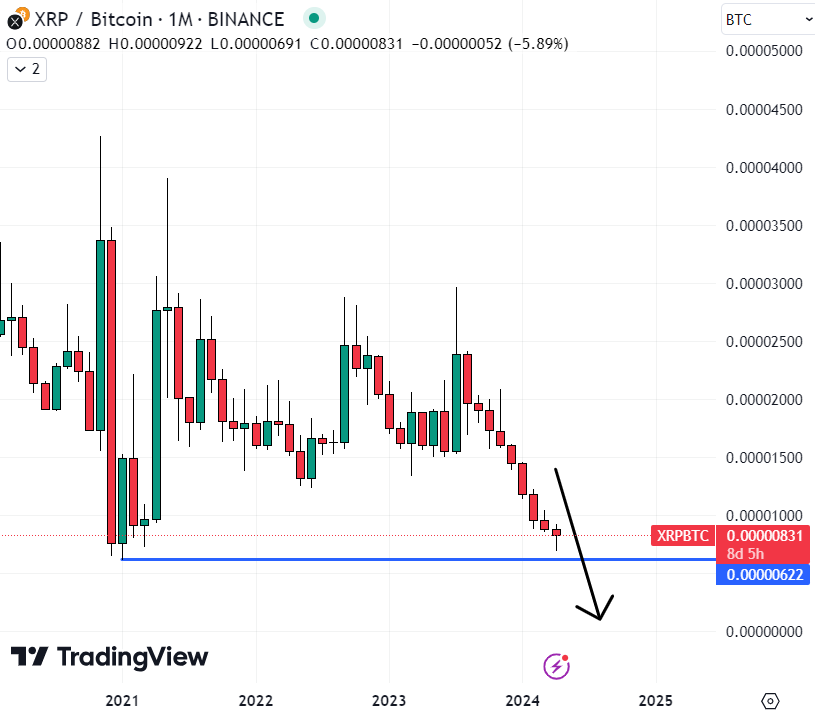
The XRP/BTC exchange rate could soon break below its 2021 lows and continue falling to zero.
Crypto investors looking for investments with greater upside potential should look into presale investing.
Web3 projects and protocols often sell their native tokens at an early bird discount to raise funds for development.
If they can find a good project that gains traction in the market, presale investors can book gains of as much as 10x or more.
One such project that analysts at Cryptonews are a big fan of is Mega Dice Casino.
This already well-established crypto casino has launched a presale of its utility token DICE.
DICE holders get big cashback benefits on their wagers and can also generate passive income via DICE staking.
The crypto casino is also running a series of exciting airdrops to reward early presale investors.
Join the $DICE airdrop and earn your share of the $750,000 airdrop🏆🚀
To stand a chance, wager $5000 or more between 12.04.24 to 03.05.24 – with a maximum airdrop of $37 500 per player! 💸
The more you wager, the bigger your airdrop 🚀
How to qualify & FAQs 🤔👇 pic.twitter.com/Qv8GaxuayC
— Mega Dice Casino (@megadice) April 22, 2024
The project is already close to having raised $500,000. And potential investors better move quickly, as when the $1 million milestone is hit, the DICE price will rise.
Check Out Mega Dice Casino’s Presale
Disclaimer: Crypto is a high-risk asset class. This article is provided for informational purposes and does not constitute investment advice. You could lose all of your capital.
In the week of the fourth Bitcoin Halving, the Dogecoin price bottomed its current correction trend at the confluence of 50% Fibonacci retracement level and $0.14 support. The renewed demand pressure has uplifted the DOGE price by 12.2% within five days to currently trade at $0.158.
If the buying momentum persists, the DOGE price is poised for another 10% surge and challenges the downsloping trendline which led to the current correction trend. A successful breakout above this barrier will signal an end-of-correction trend and bolster buyers for higher rallies.
A post-breakout rally could chase a potential target of $0.2, followed by $0.22.
Also Read: Analysts Back Dogecoin to $1 With Traders Also Bullish On New Dogeverse Meme Coin
Renowned crypto trader Alicharts has shared an intriguing chart pattern for Dogecoin, hinting at its potential trajectory. According to the analysis, Dogecoin has recently broken out of a descending triangle formation, a technical indicator that traders often interpret as a bullish sign.
Based on historical trends, the DOGE price has exhibited this pattern on two previous occasions, each preceding significant bull runs. If these patterns continue to be reliable indicators, Dogecoin might be poised for an aggressive ascent toward the $1 threshold in the forthcoming weeks.
Related Articles
The cryptocurrency’s market capitalization now stands at $68 billion, indicating a growth of 2.60%. This uptick is accompanied by a significant increase in SOL’s trading volume, which has risen to $2.83 billion over the previous 24 hours. This marks an increase of over 12%, highlighting a rising interest and confidence among investors regarding Solana’s future potential.
Over the past week, SOL has registered a 4% uptick and a remarkable 606% surge over the last year, showcasing a strong upward trend. The trading span has fluctuated between $130 and $157 in the past week, indicating some instability yet a predominant growth pattern.
If the trading momentum propels Solana beyond the $180 resistance level, this might indicate a bullish revival, potentially driving the digital currency toward the $190 benchmark. If SOL maintains this trajectory, it could establish a foundation for an ascent to the $200 resistance point in the near future.
Conversely, a trend reversal could lead SOL to regress to the $150 support mark. Sellers’ persisting dominance might further depress the SOL price to a $130 support area, heralding a bearish market phase.
Solana has witnessed a concerning trend within its ecosystem, as highlighted by the investigative efforts of crypto analyst ZachXBT. Utilizing platform X for outreach, ZachXBT brought to light a distressing pattern. In a mere month, a dozen meme coin ventures launched as presales on Solana have ceased operations.
These ventures collectively managed to amass more than 180,650 SOL, translating to an approximate loss of $26.7 million for investors. This revelation underscores the volatility and risks associated with investing in such projects. ZachXBT’s findings serve as a crucial reminder of the precarious nature of meme coin investments on the Solana blockchain.
The four-hour technical indicators for Solana show a dynamic market with recent price movements oscillating within a defined range. The Bollinger Bands are indicating moderate volatility in the price of Solana. The upper Bollinger Band is situated at $1556.69, representing a potential resistance level.
Conversely, the lower Bollinger Band, placed at $141, could serve as a support level where buying interest may intensify. The price is trading closely hugging the 20-period Simple Moving Average (SMA) line at $148.86. The Relative Strength Index (RSI) is at 62.05, hinting at a slightly bullish momentum.
Related Articles
 Price Prediction: Analyst Foresees 7,800% Breakout to")

 Price Prediction for April 23")


