The main tag of cryptocurrency price today Articles.
You can use the search box below to find what you need.
[wd_asp id=1]
The main tag of cryptocurrency price today Articles.
You can use the search box below to find what you need.
[wd_asp id=1]
Jake Claver, a renowned XRP promoter and CEO of Digital Ascension Group, is again leaning into a familiar XRP thesis: behind-the-scenes institutional adoption, NDAs, and “domino” catalysts, only days after analyst Zach Rector publicly criticized Claver’s failed “$100 XRP by end of 2025” prediction as misleading.
$100 XRP Only Delayed, Says Claver
In a post on Jan.1, Claver responded: “Timelines always get extended,” and added: “I should know this by now from all that we’ve built in the past 3 years, working with partners and regulators. I’m sure Ripple and many others have felt and still feel the same way after 13.5 years. The Domino Theory still stands, Real world events will play out, and XRP will become the backbone of markets in the future.”
In a series of posts spanning Dec. 27 through Jan. 1, Claver argued that “real world events will play out, and XRP will become the backbone of markets in the future.” A Jan. 1 post focused on Ripple’s non-disclosure agreements, which Claver described as a signal that large counterparties are already preparing to build with XRP.
“Ripple signing over 1,700 non-disclosure agreements probably isn’t random,” he wrote. “These most likely cover talks with major players—governments, global banks, payment networks, big universities, and Fortune 500 firms—all laying the groundwork to use XRP. The pieces for mass adoption have been falling into place behind the scenes for quite a while.”
Earlier posts pressed the same point with higher conviction. On Dec. 28, Claver claimed: “Major institutions are stacking up XRP behind the scenes while keeping the public in the dark. The current price is merely a shadow of what’s coming. When XRP transforms into the foundation of international finance, today’s hesitation will become tomorrow’s regret. In my opinion, nothing in crypto space offers this level of certainty and potential for massive returns.”
On Dec. 31, he described XRP “as built to upgrade the existing financial system,” while adding that “blockchain isn’t just for storing value, it can power a faster, more open financial system. For that, you need high-performance infrastructure like XRP.”
As reported on Bitcoinist yesterday, Rector’s criticism has been less about making bold forecasts than about the way they are delivered. Rector argued there was “no plausible scenario” for a roughly 5,000% move in the time window implied by the $100 call, and that the messaging leaned on suggestions of privileged insight rather than probabilistic framing.
Rector’s allegations also extended beyond price talk into claims about XRP-focused funds associated with Claver’s orbit. “Jake and his scheme, his business has grown so big they’ve taken in so much XRP from our community,” Rector said. “There’s a massive discrepancy from what he’s saying publicly and what investors are telling me privately.”
At press time, XRP traded at $1.89.
 forecast 2026: Bitcoin price forecast 2026: Will BTC USD rally or crash toward ,000? Analysts break down the bull and bear cases")
After swinging between optimism and caution in late 2025, bitcoin’s outlook for the year ahead hinges on how key forces such as monetary policy, liquidity, regulation, and institutional demand evolve, as per a Yahoo Finance report. Market watchers say these drivers are likely to shape price moves quarter by quarter rather than deliver a single, clear trend.
Some strategists see early signs of support forming. Fabian Dori, chief investment officer at Sygnum Bank, believes the opening months of 2026 could be constructive for bitcoin, helped by improving macro conditions and a gradual easing of fear across crypto markets. He said, “Overall, we see various fundamental, sentiment and regulatory drivers that from a historical perspective should be supportive for bitcoin (BTC-USD) over the next 6–9 months,” as quoted by Yahoo Finance.
Dori highlighted signs of an accelerating business cycle, including improving purchasing managers’ indices and easing liquidity as quantitative tightening winds down and US Treasury account balances return to more normal levels. He also expects crypto market sentiment to stabilise after a period of heightened fear at the end of 2025, potentially encouraging more activity across trading, staking, and decentralised finance, as per the Yahoo Finance report.
Also read: MSFT stock price today: Why Microsoft stock dropped on first trading day of 2026
He pointed out that “if crypto markets remain stable, concerns of the four-year cycle repeating itself decline, further improving sentiment,” as quoted in the report. He also noted that progress on US regulation, particularly the proposed Clarity Act, could bolster confidence by reducing long-standing uncertainty around how digital assets are classified. Still, he warned that near-term risks remain, including the chance that a US government shutdown could spark short-term volatility, as per the Yahoo Finance report.
Not all forecasts point higher. Bloomberg Intelligence senior commodity strategist Mike McGlone has cautioned that a sharp reversal is still possible, suggesting bitcoin could slide back toward $50,000 as part of a broader normalisation across risk assets. In a post on X, McGlone linked his view to shifting macro dynamics, including the possibility of a deflationary adjustment in equities, which could pressure both stocks and digital assets despite longer-term adoption trends.Also read: S&P 500 climbs, Dow Jones today edges higher and Nasdaq surges as tech stocks rebound – why US stock market is up on first trading day of 2026
Others are taking a more measured stance. Bitfinex analysts expect the early part of 2026 to be marked by consolidation rather than a decisive move in either direction. Bitfinex analysts said, “Q1 2026 is likely to be a consolidation phase for bitcoin (BTC-USD) as markets digest late 2025 volatility and rebalance portfolios,” as quoted by Yahoo Finance.
While price action may remain range-bound, they believe liquidity conditions should slowly improve. Bitfinex also highlighted refinancing as a potential tailwind, arguing that lower or stable policy rates could ease financial conditions by freeing up cash flow for governments and companies, even without new stimulus, as per the Yahoo Finance report.
What factors will shape Bitcoin’s price in 2026?
Monetary policy, liquidity conditions, regulation, and institutional demand are seen as the main drivers.
Why do some analysts see early support for Bitcoin?
Improving macro conditions and easing fear across crypto markets could help stabilize prices.
1: What is the current price range of Dogecoin?
Dogecoin trades around the $0.12 to $0.13 range after a short-term rebound at the start of 2026.
2: Can Dogecoin reach $1 next year?
DOGE can reach $1 only in a strong bull market with heavy retail hype and high liquidity, but this scenario remains less likely.
3: What factors influence Dogecoin price the most?
Social sentiment, overall crypto market trends, liquidity conditions, and sudden news drive Dogecoin price movements.
4: Is Dogecoin a long-term investment?
Dogecoin suits short- to medium-term trading more than long-term holding due to high volatility and limited fundamentals.
5: What is the biggest risk for DOGE in 2026?
Falling market confidence, reduced liquidity, and loss of social interest pose the biggest risks for Dogecoin.
The XRP price has been put back in the spotlight as a crypto analyst has forecasted an even more ambitious target than the widely circulated $100 projections currently gaining traction in the market. According to the analyst, XRP has just reached a critical trendline that could trigger a surge toward a Pi Cycle Top. He has shared a detailed chart outlining a roadmap for this bullish price outlook.
Analyst Shares Bold $300 XRP Price Prediction
A crypto analyst known on X as @Cryptobilbuwoo0 has released a fresh update on XRP, examining its long-term cycle behaviour in 2026. He predicts that the XRP price could surge dramatically, potentially rising from its current low below $2 to as high as $300.
Backing his bold forecast, the analyst noted that XRP recently touched a major green support line on its chart and is now showing early signs of a bullish reversal. He explained that this interaction with support has raised the question of whether the price action is repositioning for a new Pi Cycle Top, a signal typically associated with extreme market peaks.
Notably, the chart shared alongside the analysis shows XRP price data stretching from 2014 into future projections beyond 2026. Price action is contained within a rising channel defined by white parallel trendlines, with the green line marking the lower boundary of the long-term support. Previously, whenever XRP reached this green support line, a breakout phase followed shortly. These breakouts often triggered explosive rallies that climbed through the rising channel and peaked near Pi Cycle top markers placed at earlier highs.
On the right side of the chart, the crypto expert has highlighted several price targets, including $20, $100, $300, and $1000. The $300 level is near the top of the rising channel, indicating where a future Pi Cycle top could form if XRP follows its historical path. The momentum indicator at the bottom of the chart also shows upward oscillations, with the analyst’s projections for XRP extending deep into 2026 and beyond.
Why A $300 XRP Price Might Not Be Feasible
While the possibility of XRP reaching $300 is supported by @Cryptobilbuwoo0’s technical analysis, the cryptocurrency is currently trading at $1.83–more than 99% below the projected target. For XRP to achieve such an explosive surge, favorable market conditions would need to align, including stronger investment sentiment and sustained buying pressure.
At present, however, XRP’s price structure appears weak. Its value has been declining and consolidating at lower levels for several months, while overall market sentiment has turned negative. This is reflected in XRP’s Fear and Greed Index, which currently indicates more fear than confidence among investors.
Even analysts like Nick, a known crypto crusader and researcher, have stated that XRP is unlikely to reach $100 by the end of 2026. Based on his assessment, a $300 price projection appears even less attainable.
Solana is priced near $125.69 with a live market cap around $70,780,655,373 and a 24-hour volume near $2,306,325,895, ranking #7 on CoinMarketCap with roughly 563,155,830 SOL in circulating supply. In the broader tape, Bitcoin is near $88,485.13 with a market cap of about $1,767,069,049,489, while Ethereum is near $2,993.90 with a market cap of about $361,347,912,973.
That macro backdrop matters because when BTC and ETH stabilize, capital often rotates into high-beta majors like SOL before it later chases smaller narratives.
Solana sits in the sweet spot where liquidity is deep enough for large flows, yet narrative momentum can still move price faster than the slowest large caps.
Why Solana Demand Keeps Returning
Solana remains one of the most used consumer-oriented chains because its throughput and low fees make on-chain activity feel instant. That user experience is a real moat in cycles where traders want speed, cheap execution, and a constant stream of new launches. When meme and NFT activity heats up, Solana often benefits because it can absorb high transaction bursts without pricing out smaller users.
This is why SOL tends to respond quickly when risk appetite returns. Still, it is important to separate network popularity from price multiples. At a ten of billions valuation, SOL can trend strongly, but it is less likely to deliver the life-changing percentage jumps that micro caps can produce.
Technical Indicator View Using Classic Signals
A disciplined 2026 outlook uses confirmation instead of wishful forecasting. Start with the 200-day moving average because it often acts like the market’s long-term trend line. When SOL holds above the 200-day average for weeks, the market is usually signaling that demand is absorbing supply. Next, watch the 50-day moving average for trend acceleration. If the 50-day line is rising and price respects it on pullbacks, momentum is typically constructive.
Then check RSI. Readings in the 50 to 60 zone often indicate healthy momentum with room to run, while repeated failures to hold 50 can warn that rallies are being sold. MACD is your trend change detector. A bullish cross that stays supported by steady volume is more meaningful than a one-day pop.
Finally, use simple support and resistance planning. Solana often builds a base, tests the ceiling multiple times, then breaks when volume expands. A confirmed breakout usually includes a daily close above resistance and a successful retest that turns that level into support.
Solana Price Prediction Scenarios for 2026
Base case. SOL continues a grind higher as the market normalizes, with pullbacks that find buyers at key moving averages. In this scenario, traders look for higher lows on the weekly chart, an RSI staying above 50, and a steady slope in the 50-day moving average.
Bull case. A strong risk-on year pushes users and liquidity back into high-activity chains. If Solana keeps attracting launches and on-chain flows, the price can trend into new ranges, especially if BTC remains firm and ETH sentiment stays positive.
Bear case. If macro conditions tighten or liquidity dries up, SOL can consolidate for longer and sweep downside support zones before recovering. That does not break the long-term thesis, but it can delay the breakout timing and raise opportunity cost.
Pepeto Micro Cap Rotation Built on Ethereum
Solana can be a strong major, yet the biggest percentage moves in crypto usually happen at the micro-cap layer when retail attention concentrates. Pepeto is positioned for that lane on Ethereum mainnet, combining meme culture with real utility so the story is both simple and usable.
Pepeto (https://pepeto.io/) ecosystem includes PepetoSwap, positioned as a zero-fee swap; Pepeto Bridge for cross-chain movement; and Pepeto Exchange, a verified meme exchange where all volume routes through $PEPETO. That routed volume design is the demand engine. The goal is for swap, bridge, and exchange activity to continuously pull usage through the token rather than relying on a single hype moment.
Pepeto supply is fixed at 420T tokens (https://pepeto.io/#tokenomics) . Staking APY is marketed around 216% , which can tighten circulating supply and reduce future sell pressure if early buyers choose yield. Security posture is supported by audits from SolidProof and Coinsult.
The community is presented as more than 100,000 members, adding social gravity that often attracts liquidity in meme cycles.
The live presale snapshot shows 1 PEPETO equals $0.000000175 with $7.14M raised. For traders hunting the best crypto to buy now, Pepeto is framed as the next 100x meme coin style asymmetry because the starting valuation is small and the participation path is straightforward.
How to Buy Pepeto
Use a direct, clean process. Go to (https://pepeto.io/) and confirm you are on the official site before connecting anything. Connect a Web3 wallet, choose payment in ETH, USDT, BNB, or a bank card via Web3Payments, then enter your amount and approve the transaction.
Right after buying, you can stake from the same flow to start earning the high APY before launch (https://pepeto.io/en/staking). The official site also advertises a $700,000 giveaway, so treat copycat links as a red flag and type the domain manually.
Solana’s 2026 outlook is strongest when classic indicators confirm the trend and the market stays risk-on, but its large valuation naturally moderates extreme multiples. Pepeto is positioned as the faster retail rotation bet on Ethereum, with routed ecosystem demand, staking-driven supply tightening, and audited infrastructure layered onto a meme narrative, positioning it as a Best Crypto Presale.
In every cycle, the window with the best risk reward usually appears before the next price step and before the crowd arrives.
To stay ahead of key updates, listings, and announcements, follow Pepeto on its official channels only:
Website: https://pepeto.io
X (Twitter): https://x.com/Pepetocoin
Telegram: https://t.me/pepeto_channel
Instagram: https://www.instagram.com/pepetocoin/
Windows like this belong to those who secure position before momentum ignites, because once participation explodes, this entire access channel collapses.
Contact: Dani Bonocci
Website: https://www.tokenwire.io
Phone: +971586738991
SOURCE: Pepeto
Press release distribution
This release was published on openPR.
Key Takeaways
YoungHoon Kim, who claims to hold the world’s highest IQ, has predicted Bitcoin could reach $276,000 by February 2026.
Several of his past Bitcoin price forecasts have failed to materialise.
Analysts say Bitcoin is nearing a potential breakout zone.
The self-proclaimed world’s smartest man has once again made a bold prediction about the future price of Bitcoin (BTC), saying the world’s largest crypto could surge over $270,000 in just a month.
Kim, who claims to hold an IQ of 276, has made a new claim that Bitcoin’s price could surge to $276,000 by February 2026.
The social media predictor reportedly highlighted increased and weakening fiat currencies as reasons for his bullish outlook.
Bitcoin has historically shown large price swings and remains increasingly sensitive to shifts in global macroeconomic factors.
Kim’s latest forecast follows a series of previous Bitcoin predictions that have failed to materialize.
In November, Kim told followers on X that Bitcoin would surge to $220,000 within 45 days, more than doubling from levels at the time.
That rally did not occur.
“I expect Bitcoin is going to $220,000 in the next 45 days,” Kim wrote, adding that he would use all future BTC profits to fund church constructions worldwide.
On top of this prediction, Kim also said he believed “Bitcoin may replace USD by 2026.”
The high IQ holder has continued to tell his followers that Bitcoin’s current low price was just a “temporary discount” caused by market manipulation.
“I think any such manipulation may disappear within a week, and then it could start accelerating toward a new ATH,” he wrote.
Kim has also issued optimistic projections for other cryptocurrencies, including XRP.
He has said XRP could approach $1,000 over the next decade under what he described as specific macroeconomic conditions, including a large-scale shift of capital into digital assets.
“Under the assumption of a large-scale migration of capital into crypto, alongside a significant decline in the dollar’s value and elevated inflation, the scenario cannot be ruled out on a numerical basis,” Kim wrote.
In separate posts, he suggested XRP may be nearing a major cycle peak and could benefit from seasonal price movements, predicting a possible rally around Christmas and a potential all-time high in January 2026.
On Dec. 30, Kim put out a bullish urgent post stating: “Watch XRP. Next 48 hours. $3 level.”
At the time of reporting, XRP is trading at $1.89, up just 1% in the last week.
Despite optimism from bullish predictions, analysts are pointing to technical signals that suggest Bitcoin is nearing a decisive move but lacks confirmation of a sustained upside breakout.
Rongchai Wang
Jan 02, 2026 12:31
MATIC price prediction shows potential 37% upside to $0.52 if bulls break $0.58 resistance, while technical analysis reveals neutral RSI and oversold conditions setting up recovery.
Polygon (MATIC) sits at a critical juncture as we enter 2026, with the token trading at $0.38 and facing a decisive test at the $0.58 resistance level. Our comprehensive MATIC price prediction analysis reveals a cautiously optimistic outlook, supported by upcoming technical catalysts and oversold conditions that could fuel a recovery rally.
• MATIC short-term target (1 week): $0.42 (+10.5%) – targeting the 20-day SMA resistance
• Polygon medium-term forecast (1 month): $0.45-$0.52 range – aligning with analyst consensus
• Key level to break for bullish continuation: $0.58 – critical resistance that unlocks higher targets
• Critical support if bearish: $0.35 – immediate support before deeper correction to $0.33
The latest MATIC price prediction landscape shows a clear divide between short-term caution and long-term optimism. CoinCodex maintains a conservative stance with a $0.1065 target, reflecting current bearish momentum, while CoinLore presents an aggressive $3.66 long-term forecast based on historical crypto cycle analysis.
The analyst consensus gravitates toward the $0.45-$0.52 range for medium-term targets, with Blockchain.News and MEXC News both highlighting this zone as achievable if MATIC can overcome the critical $0.58 resistance. Coinbase’s modest $0.14 five-year projection appears overly conservative given Polygon’s technological developments and ecosystem growth.
The most compelling Polygon forecast comes from CoinMarketCap’s analysis of the AggLayer v0.3 upgrade launching this January, which could significantly boost demand for POL tokens by unifying liquidity across Polygon chains. This technical catalyst provides fundamental support for bullish price predictions.
Current Polygon technical analysis reveals MATIC is positioned in oversold territory with an RSI of 38.00, creating conditions ripe for a bounce. The token trades below all major moving averages, with the 20-day SMA at $0.43 serving as immediate resistance and the 200-day SMA at $0.69 highlighting the longer-term bearish trend.
The MACD histogram at -0.0045 confirms bearish momentum remains intact, but the relatively shallow reading suggests selling pressure may be waning. MATIC’s position within the Bollinger Bands at 0.29 indicates the token is trading in the lower portion of its recent range, often a precursor to mean reversion moves.
Trading volume of $1.07 million on Binance appears subdued, which could work in MATIC’s favor if buying interest emerges, as thin liquidity often amplifies price movements. The daily ATR of $0.03 suggests moderate volatility, providing reasonable risk-reward ratios for position traders.
Our bullish MATIC price prediction centers on a break above $0.58 resistance, which would invalidate the current bearish structure and open the door to the $0.45-$0.52 target zone. The first MATIC price target sits at $0.45, coinciding with the 50-day moving average and representing an 18% gain from current levels.
A sustained move above $0.45 would target the analyst consensus range of $0.52, offering 37% upside potential. This level aligns with the upper Bollinger Band projection and previous support-turned-resistance from late 2025. Technical confirmation would require RSI breaking above 50 and MACD turning positive.
The AggLayer v0.3 upgrade serves as a fundamental catalyst that could drive institutional interest and ecosystem adoption, supporting higher price targets throughout Q1 2026.
The bearish scenario for our MATIC price prediction involves a breakdown below $0.35 immediate support, which would target the strong support zone at $0.33. This level represents the 52-week low and a critical test of investor confidence in Polygon’s long-term prospects.
A break below $0.33 would signal a deeper correction, potentially targeting the $0.28-$0.30 zone based on Fibonacci extensions from the 2025 high. Such a move would require a broader crypto market selloff or negative developments specific to Polygon’s ecosystem.
Risk factors include delayed AggLayer implementation, competitive pressure from alternative L2 solutions, or broader market volatility that could pressure risk assets.
Based on our Polygon technical analysis, the optimal buy or sell MATIC decision involves a tiered approach. Conservative investors should wait for a break above $0.42 (20-day SMA) before initiating positions, targeting the $0.45-$0.52 range with a stop-loss below $0.35.
Aggressive traders can consider accumulating MATIC near current levels around $0.38, using the $0.35 support as a stop-loss level. This approach offers a favorable 3:1 risk-reward ratio targeting $0.45 as the first objective.
Position sizing should reflect the medium confidence level in this Polygon forecast, with exposure limited to 2-3% of portfolio allocation given the technical uncertainties. Dollar-cost averaging into MATIC positions over 2-3 weeks could help mitigate timing risk.
Our comprehensive MATIC price prediction points toward a potential recovery rally targeting the $0.45-$0.52 zone over the next month, contingent on breaking above $0.58 resistance. The combination of oversold technical conditions, upcoming AggLayer upgrade, and analyst consensus supports a cautiously optimistic outlook with medium confidence.
Key indicators to monitor include RSI breaking above 50 for momentum confirmation, MACD turning positive for trend validation, and volume expansion above 2 million to confirm institutional interest. The critical $0.58 resistance level remains the make-or-break point for this Polygon forecast.
Timeline expectations suggest initial moves toward $0.42 within 1-2 weeks, followed by a potential test of $0.45-$0.52 by February 2026 if technical conditions align. Failure to hold $0.35 support would invalidate this bullish thesis and require reassessment of the medium-term outlook.
Image source: Shutterstock
Jakarta, Pintu News – Over the past year, Dogecoin has grown from a meme coin to an increasingly recognized reserve asset. However, going into 2026, a number of indicators suggest that the DOGE price has the potential to continue to weaken and possibly hit a new low.
What are these signals, and what can investors anticipate for DOGE’s movement in 2026?
On January 2, 2026, Dogecoin saw a 7.10% gain over a 24-hour period, with the price rising to $0.1267, or approximately IDR 2,128. During that time, DOGE traded within a range of IDR 1,978 to IDR 2,132.
At the time of writing, Dogecoin holds a market capitalization of around IDR 354.82 trillion, with a 24-hour trading volume of approximately IDR 29.88 trillion.
Read also: 3 Meme Coins to Watch Out for in January 2026, What Happens?
Towards the end of 2025, the price of Dogecoin (DOGE) fell below $0.12, closing the year down more than 70% from its highest peak. Weak buying pressure hampered any potential immediate price recovery. In the early trading days of 2026, the DOGE price remained below $0.12.
The spot Dogecoin ETF launched in the United States at the end of November 2025 appears to be struggling to attract investor interest.
Based on data from SoSoValue, since trading began on November 24, most days have seen zero net inflows into the DOGE ETF. The current total net assets recorded are only around $5.07 million-the lowest of all US-listed crypto ETFs.

This trend reflects the lack of interest from both institutional and retail investors in DOGE. This situation is in stark contrast to the much stronger performance of XRP and SOL ETFs.
With no new fund flows from ETFs, DOGE lost its upward impetus. Continued selling pressure continues to weigh on the price. If this condition persists until 2026, DOGE will likely find it difficult to recover in the near future.
“Weak demand for ETFs as well as declining open interest in futures contracts further reinforces the ongoing selling trend,” said investor Marzell.
The second factor signaling selling pressure is the rising Dogecoin balance on the Binance wallet (address DE5…ToX), which is one of the largest holders of DOGE. This wallet balance rose again in the second half of 2025, indicating potential selling pressure in the near future.
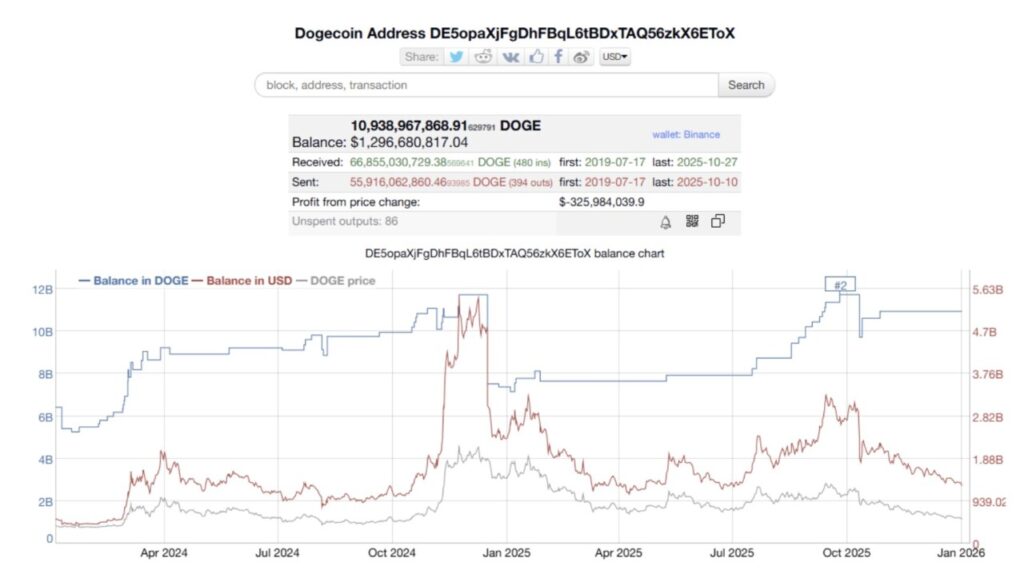
According to data from Bitinfocharts, the amount of DOGE stored in the wallet rose from 7.9 billion to 10.9 billion throughout 2025. Based on historical trends, when the balance exceeds 11 billion DOGE, the price tends to peak.
In strong market conditions, increasing balances on exchanges can support the redistribution of assets to new investors. However, amid low demand, high DOGE reserves on exchanges like Binance create persistent supply-side selling risk.
Read also: Ethereum Struggles to Break $3,000 — Could a 20% Rally Be Ahead?
A third factor adding to the pressure on Dogecoin is the declining interest from retail investors. According to Google Trends data, search interest in Dogecoin is at a five-year low-a trend that is also reflected in many other altcoins.
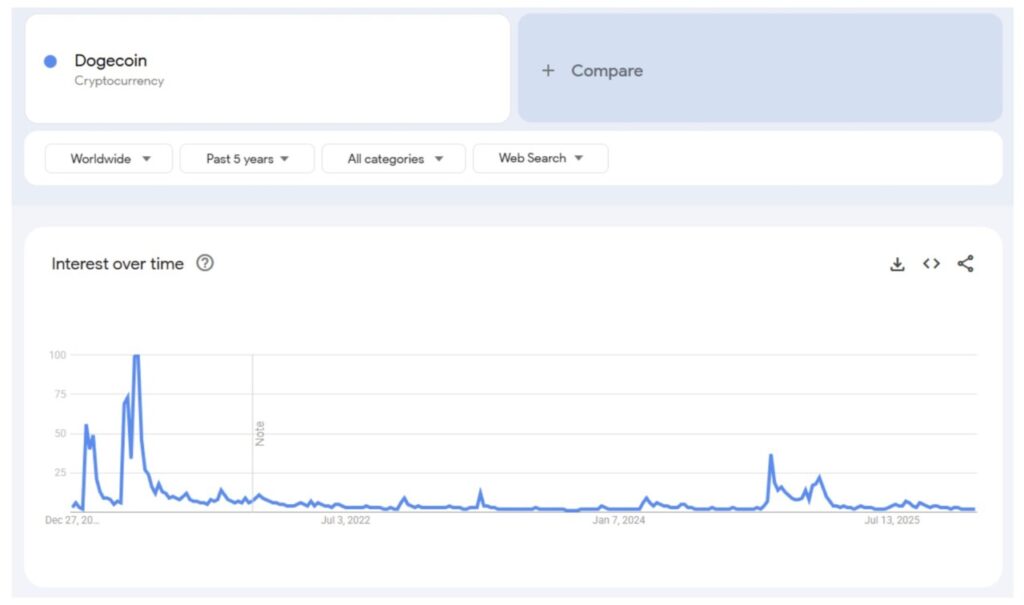
DOGE has been known as a popular coin among retail investors. However, declining interest means fewer new participations. As a result, liquidity has decreased and prices have become more prone to sharp fluctuations.
Some companies such as CleanCore Solutions and BitOrigin are known to hold DOGE as a backup asset. However, current market conditions are putting their positions under pressure.
BitOrigin is known to buy DOGE at a price range of $0.22. Meanwhile, CleanCore Solutions reported on October 6, 2025 that it owned more than 710 million DOGE, with unrealized gains worth more than $20 million at the time. But since October, the price of DOGE has fallen by more than 50%. CleanCore Solutions’ own shares plummeted 90%, suggesting that the strategy of holding DOGE as a backup asset has not convinced investors.
“CleanCore Solutions (ZONE) shares are now down 95% in the last three months. This tarnishes the Dogecoin name,” said investor KrissPax.
Although negative signals continue to emerge, a report from BeInCrypto states that long-term holders are actually starting to show signs of accumulation. For this group, the current price drop is considered a buying opportunity, not a sign of giving up.
That’s the latest information about crypto. Follow us on Google News to get the latest crypto news about crypto projects and blockchain technology. Also, learn crypto from scratch with complete discussion through Pintu Academy and stay up-to-date with the latest crypto market such as bitcoin price today, xrp coin price today, dogecoin and other crypto asset prices through Pintu Market.
Enjoy an easy and secure crypto trading experience by downloading Pintu crypto app via Google Play Store or App Store now. Also, get a web trading experience with various advanced trading tools such as pro charting, various types of order types, and portfolio tracker only at Pintu Pro.
*Disclaimer
This content aims to enrich readers’ information. Pintu collects this information from various relevant sources and is not influenced by outside parties. Note that an asset’s past performance does not determine its projected future performance. Crypto trading activities have high risk and volatility, always do your own research and use cold cash before investing. All activities of buying and selling bitcoin and other crypto asset investments are the responsibility of the reader.
Reference:
 Price Jumps 8% Today as Whales Buy Return")
Cardano (ADA) has started 2026 on a positive note, rising nearly 8% today, moving above the $0.36 level and ranking among the day’s top altcoin gainers. This rise comes after a rough December, when ADA fell nearly 20%, leaving many investors cautious.
So, what’s driving Cardano’s price higher today?
One of the clearest signals behind ADA’s rise comes from CryptoQuant data. Recent on-chain numbers show an increase in activity from large holders, often called whales. Both spot and futures data point to bigger orders entering the market.
When whales begin to buy again, it often signals growing confidence. According to CryptoQuant, market conditions are easing, and buy-side pressure is slowly increasing. This supports the idea that the current move is more than just a random bounce.
Beyond trading data, Cardano’s network is showing real signs of use. Transaction activity and wallet interactions have increased over recent days. This means users are actively using the blockchain, not just holding ADA.
Another positive signal comes from Cardano’s DeFi ecosystem. According to DefiLlama, Cardano’s TVL increased by 4% in the last 24 hours, reaching about $178.9 million. This means more users are putting their funds into Cardano-based DeFi platforms.
When more money flows into DeFi, it usually shows growing trust in the network, which can also increase demand for the ADA token.
For several months, ADA has been moving inside a falling wedge pattern. This happens when the price keeps going down, but selling slowly becomes weaker. As the range gets tighter, it often means a big move is getting close.
Right now, ADA is holding near the $0.35 support level. This area is helping the price stay stable, and buyers are slowly stepping in, showing that selling pressure is easing.
Crypto trader Captain Faibik shared a chart showing ADA near the end of this falling wedge. He believes a breakout could happen if the price moves above the upper trendline.
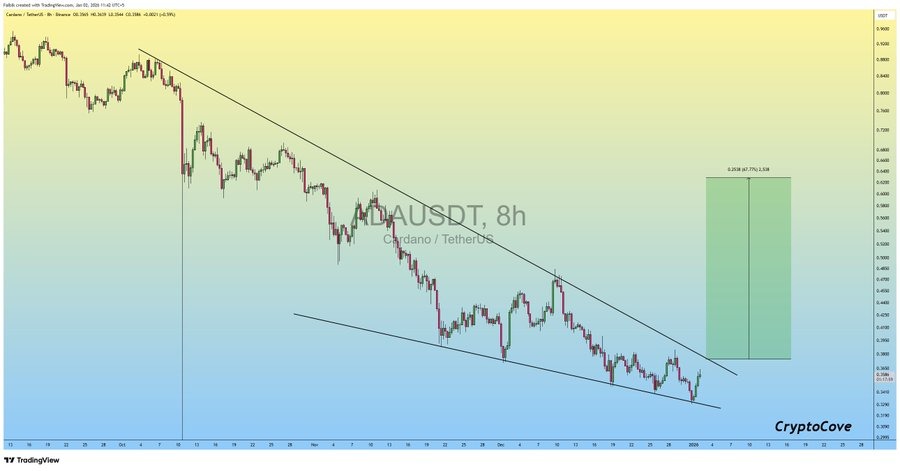
As long as ADA stays above support, the setup remains healthy. If the breakout happens, the price could move toward the $0.52–$0.55 zone, which would mean nearly a 50% rise from current levels.
Stay ahead with breaking news, expert analysis, and real-time updates on the latest trends in Bitcoin, altcoins, DeFi, NFTs, and more.
Rising on-chain activity, improving market conditions, and renewed large-holder interest suggest stronger confidence in ADA’s short-term outlook.
Cardano could trade between $2.75 and $3.25 in 2026 if market sentiment improves, adoption grows, and key support levels hold.
Cardano is considered a long-term project due to its research-driven development, scalability upgrades, and focus on decentralization.
By 2030, Cardano could be valued around $9 to $10 based on long-term growth, network usage, and sustained investor confidence.
CoinPedia has been delivering accurate and timely cryptocurrency and blockchain updates since 2017. All content is created by our expert panel of analysts and journalists, following strict Editorial Guidelines based on E-E-A-T (Experience, Expertise, Authoritativeness, Trustworthiness). Every article is fact-checked against reputable sources to ensure accuracy, transparency, and reliability. Our review policy guarantees unbiased evaluations when recommending exchanges, platforms, or tools. We strive to provide timely updates about everything crypto & blockchain, right from startups to industry majors.
All opinions and insights shared represent the author’s own views on current market conditions. Please do your own research before making investment decisions. Neither the writer nor the publication assumes responsibility for your financial choices.
Sponsored content and affiliate links may appear on our site. Advertisements are marked clearly, and our editorial content remains entirely independent from our ad partners.
XRP, the fifth-largest cryptocurrency by market cap, surged 3% today as the new year rally kicks off. Latest market data shows Ripple’s XRP at $1.88, nearing the crucial $2 threshold that could signal a major breakout in 2026. Despite the short-term uptrend, XRP’s overall market trend remains bearish, with an extended monthly decline of $15.24%. As of January 1 and 2, there has been no big surge at the start of 2026 yet, and the XRP market trend looks sideways to moderately bearish in the short term.
XRP’s price bounce reflects new year rally participation, and the digital asset is one of the highly rated ones in the market. However, reaching $100 in 2026 is highly speculative and unlikely, because the market trend projects a more realistic range of $3.50 to $20 by the end of this year. Despite sluggish market conditions, demand for US XRP-spot ETFs held steady, reaching nearly $500 million in December alone. The U.S. lawmakers have officially set a January 15 markup for the newly imposed Market Structure Bill. Based on the factors like legislative progress with the enhanced ETF momentum, XRP will push above the $3 psychological level soon.
According to the current XRP market data, the XRP price today is $1.88, trading closer to the $2 psychological level. The new year rally is making a difference in the XRP rally, because the digital asset is around 3% higher over the past 24 hours. XRP Ledger’s native cryptocurrency is trading with a 24-hour trading volume of $ 2.05B Market cap of $ 114.02B, and a market dominance of 3.79%. XRP’s market sentiment remains bearish, and it has been trading below its 50-Day SMA ($ 2.05) and 200-Day Simple Moving Average ($ 2.48) for a long period of time. Along with the extended bearish trend, XRP has traded 13/30 (43%) days in green with a market volatility of 5.04%. XRP’s fear and greed index signals 20, which is extreme fear in the market, meaning that traders and investors are cautious.
XRP has long faced criticism over its long-term potential, yet early 2026 sessions suggest the asset is gaining momentum. Veteran trader and crypto investor usernamed @investorie shared his thoughts on XRP and explained his long-term admiration for the virtual asset.
He urged traders to stop crying and pay attention. XRP was still below its descending trendline on the daily chart. He acknowledged that the structure was not bullish yet, but stated that what people were missing was that MACD was forming higher lows, RSI was forming higher lows, and price was compressing, not accelerating downward. He mentioned that that was classic momentum divergence. He noted that this did not mean a reversal was confirmed and that it meant selling pressure was weakening under the surface. He pointed out that markets did not bottom when sentiment felt good, but rather when prices stopped responding to fear.
His post shows traders are still valuing XRP and rating it highly as they enter into the new year with a fresh mindset. He concluded his X post by stating that for XRP, the game only changed on a daily close above the trendline (around $2.05–$2.10). Until then, that was accumulation, not hype, and not moon talk. He advised to ignore emotions, watch structure, and watch momentum.
Currently, XRP is slowly regaining its previous market momentum and is on the verge of outperforming prominent cryptocurrencies such as BTC, ETH, SOL, etc. Today, XRP is consolidating between $1.82–$1.87. Based on the recent market data, crossing above the $2 psychological level could be challenging and difficult even with enhanced spot XRP ETF inflows and short-term resurrection.
Here is the XRP price prediction for the next seven days.
| Date | Min Price | Avg Price | Max Price |
|---|---|---|---|
| Jan 2, 2026 | $1.82 | $1.84 | $1.86 |
| Jan 3, 2026 | $1.81 | $1.83 | $1.85 |
| Jan 4, 2026 | $1.81 | $1.83 | $1.85 |
| Jan 5, 2026 | $1.83 | $1.85 | $1.87 |
| Jan 6, 2026 | $1.86 | $1.88 | $1.90 |
| Jan 7, 2026 | $1.86 | $1.88 | $1.90 |
| Jan 8, 2026 | $1.85 | $1.87 | $1.89 |
| Jan 9, 2026 | $1.84 | $1.86 | $1.88 |
Disclaimer: XRP price prediction is speculative and subject to change based on the changing market scenario.
According to the XRP short-term price prediction, the digital asset is expected to trade at an average maximum price of 1.88 in the next seven days.
For XRP, 2026 could mark a major comeback, as the resolution of its long-standing SEC battle and newfound regulatory clarity are set to boost performance and ignite a bullish rally. Based on the recent data and XRP’s historic trend, Ripple’s native cryptocurrency will not hit $100 in 2026. A $100 price demands substantial growth and a total market value above Bitcoin’s, which is highly unlikely at the moment. Industry experts believe that for that kind of growth, XRP might need to become something like a global reserve or settlement currency that is widely used at a massive scale.


