The main tag of Crypto News Articles.
You can use the search box below to find what you need.
[wd_asp id=1]
9
01, 2026
POL Stabilizes Near $0.15 as Buyers Regain Control
- POL breakout above key EMAs signals trend reversal, though overextension hints at a pause
- Derivatives and spot flows show cautious re-entry, limiting liquidation risk and upside
- Open Money Stack strengthens Polygon payment rails, adding fundamental support to recovery
Polygon’s POL token is drawing renewed attention as price strength, derivatives activity, and infrastructure development converge. Recent chart action shows a decisive recovery phase after weeks of consolidation.
Besides technical momentum, improving spot flows and new ecosystem tools add context to the market’s near-term outlook. Consequently, traders are reassessing risk as POL tests higher levels near the $0.15 zone.
Price Structure Signals a Bullish Shift
POL price action on the four-hour chart reflects a clear upward trend. The market advanced sharply from the $0.118 area toward $0.149. This move followed a prolonged sideways phase, which often precedes stronger directional breaks. Significantly, price now trades above key exponential moving averages across short and long periods.
The EMA alignment shows sustained bullish control. The 20-period average continues to act as dynamic support near $0.131. Hence, dips toward this zone may attract buyers if momentum cools. Fibonacci retracement levels also reinforce this structure. The $0.129 and $0.138 zones remain important buffers during any pullback.
However, the Donchian Channel places price above its upper boundary. That condition often signals near-term exhaustion. Consequently, consolidation or a shallow retracement could emerge before another push higher. Resistance remains concentrated near $0.149, which marks the recent swing high.
Derivatives and Spot Flows Show Cautious Re-Engagement

Futures open interest adds another layer to the narrative. Open interest expanded steadily from mid-summer and peaked near $180 million in early autumn. That phase aligned with stronger speculative appetite. However, October saw rapid deleveraging, which pushed open interest sharply lower.
Since then, derivatives activity stabilized between $55 million and $70 million. Moreover, the recent uptick toward $66 million suggests traders are returning cautiously. Leverage remains restrained compared with previous highs. This structure reduces liquidation risk but also limits explosive upside.
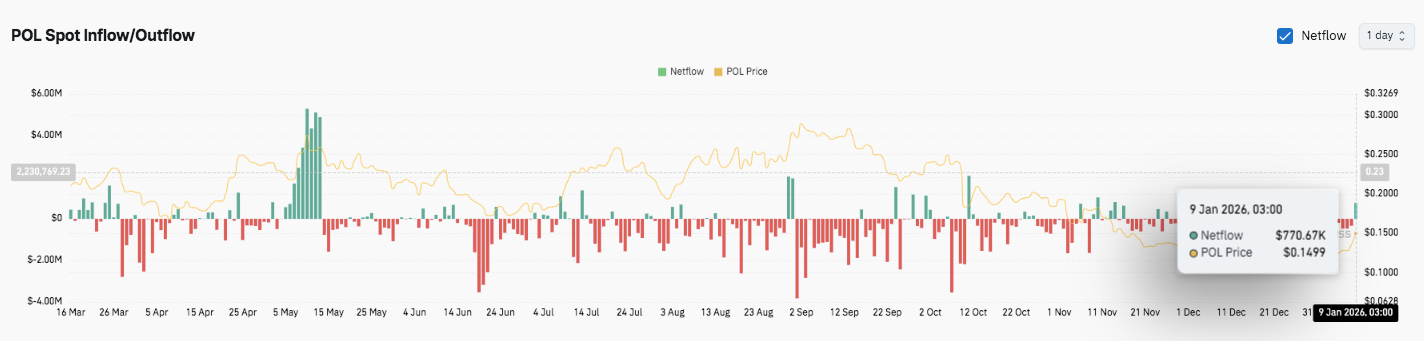
Spot flow data supports this measured shift. Earlier periods showed persistent outflows and sharp sell-side spikes. Additionally, those flows coincided with price weakness. Into late November and December, outflows moderated and netflows moved closer to balance. The latest modest inflow near $770,000 aligns with price stability near $0.15.
Infrastructure Developments Add Fundamental Context
Beyond charts, ecosystem progress continues. Polygon Labs recently introduced the Open Money Stack. The initiative focuses on regulated stablecoin payments and cross-border transfers. It combines compliance, wallets, orchestration, and settlement into a unified framework.
Moreover, the stack aims to connect onchain and offchain systems without sacrificing interoperability. Developers can onboard users and integrate payment and yield features more efficiently. Several components already operate through partners, with further releases planned.
Technical Outlook for Polygon (POL) Price
Polygon’s POL token continues to trade at a technically sensitive zone, where momentum remains constructive but not yet decisive. Price action on the short-term timeframe shows POL attempting to hold above recent breakout levels near $0.145–$0.149. Consequently, traders are closely monitoring whether buyers can sustain control or if consolidation deepens before the next directional move.
- Upside Levels: Immediate resistance sits near $0.149–$0.150, which marks the recent swing high. A clean breakout above this zone could open the door toward $0.158 and $0.165 in the near term. Beyond that, an extension toward $0.180 remains possible if volume expands and momentum accelerates.
- Downside Levels: On the downside, initial support rests near $0.138, aligned with the 0.786 Fibonacci retracement. A deeper pullback could test $0.129–$0.130, where buyers previously stepped in. Below that, $0.123–$0.118 forms the broader demand zone that underpins the current structure.
- Resistance Ceiling: The $0.150 region, near recent highs and short-term volatility bands, remains the key level to flip for sustained bullish continuation. Holding above this ceiling would strengthen the medium-term trend and reduce the risk of range expansion lower.
From a structural standpoint, POL appears to be compressing after a sharp impulse move. EMAs remain positively stacked, supporting the broader uptrend. However, price trading near the upper Donchian boundary signals short-term exhaustion risk. Hence, consolidation or a shallow retracement would remain healthy for trend continuation.
Will Polygon Move Higher?
Polygon’s short-term outlook depends on whether buyers can defend the $0.138–$0.145 area while pressuring the $0.150 resistance. Technical compression suggests volatility expansion may follow.
If bullish momentum builds alongside improving spot flows, POL could target $0.158 and $0.165 next. However, failure to hold $0.138 risks a reset toward $0.129 or lower. For now, POL trades in a pivotal zone where confirmation will shape the next leg.
Disclaimer: The information presented in this article is for informational and educational purposes only. The article does not constitute financial advice or advice of any kind. Coin Edition is not responsible for any losses incurred as a result of the utilization of content, products, or services mentioned. Readers are advised to exercise caution before taking any action related to the company.