BlockDAG is shifting into high gear with its latest move, Beat Vesting is now live. This change lets buyers claim more BDAG at the same price, giving the project a stronger push toward its massive $1 billion launch market cap. It’s more than a small tweak; it shows BlockDAG’s serious plans to hit the market with force. With top talent from Ethereum and Cardano joining the team, and miners already locked in, the project seems ready for its next big leap.
Momentum hasn’t slowed. The presale just hit $438 million, reaching batch 33 with the current BDAG price at $0.0078. That’s a strong indicator that confidence is growing fast. On top of that, the recently launched Keynote 4 – Launch Note gave a deeper look into what’s coming, adding more excitement around BlockDAG’s future.
What’s exciting is how everything is building up at once. The presale ends on February 10, and each passing day brings more traction. With Beat Vesting boosting allocations, buyers now have a chance to secure more BDAG before it hits exchanges. Time is tight, and momentum is clearly on BlockDAG’s side.
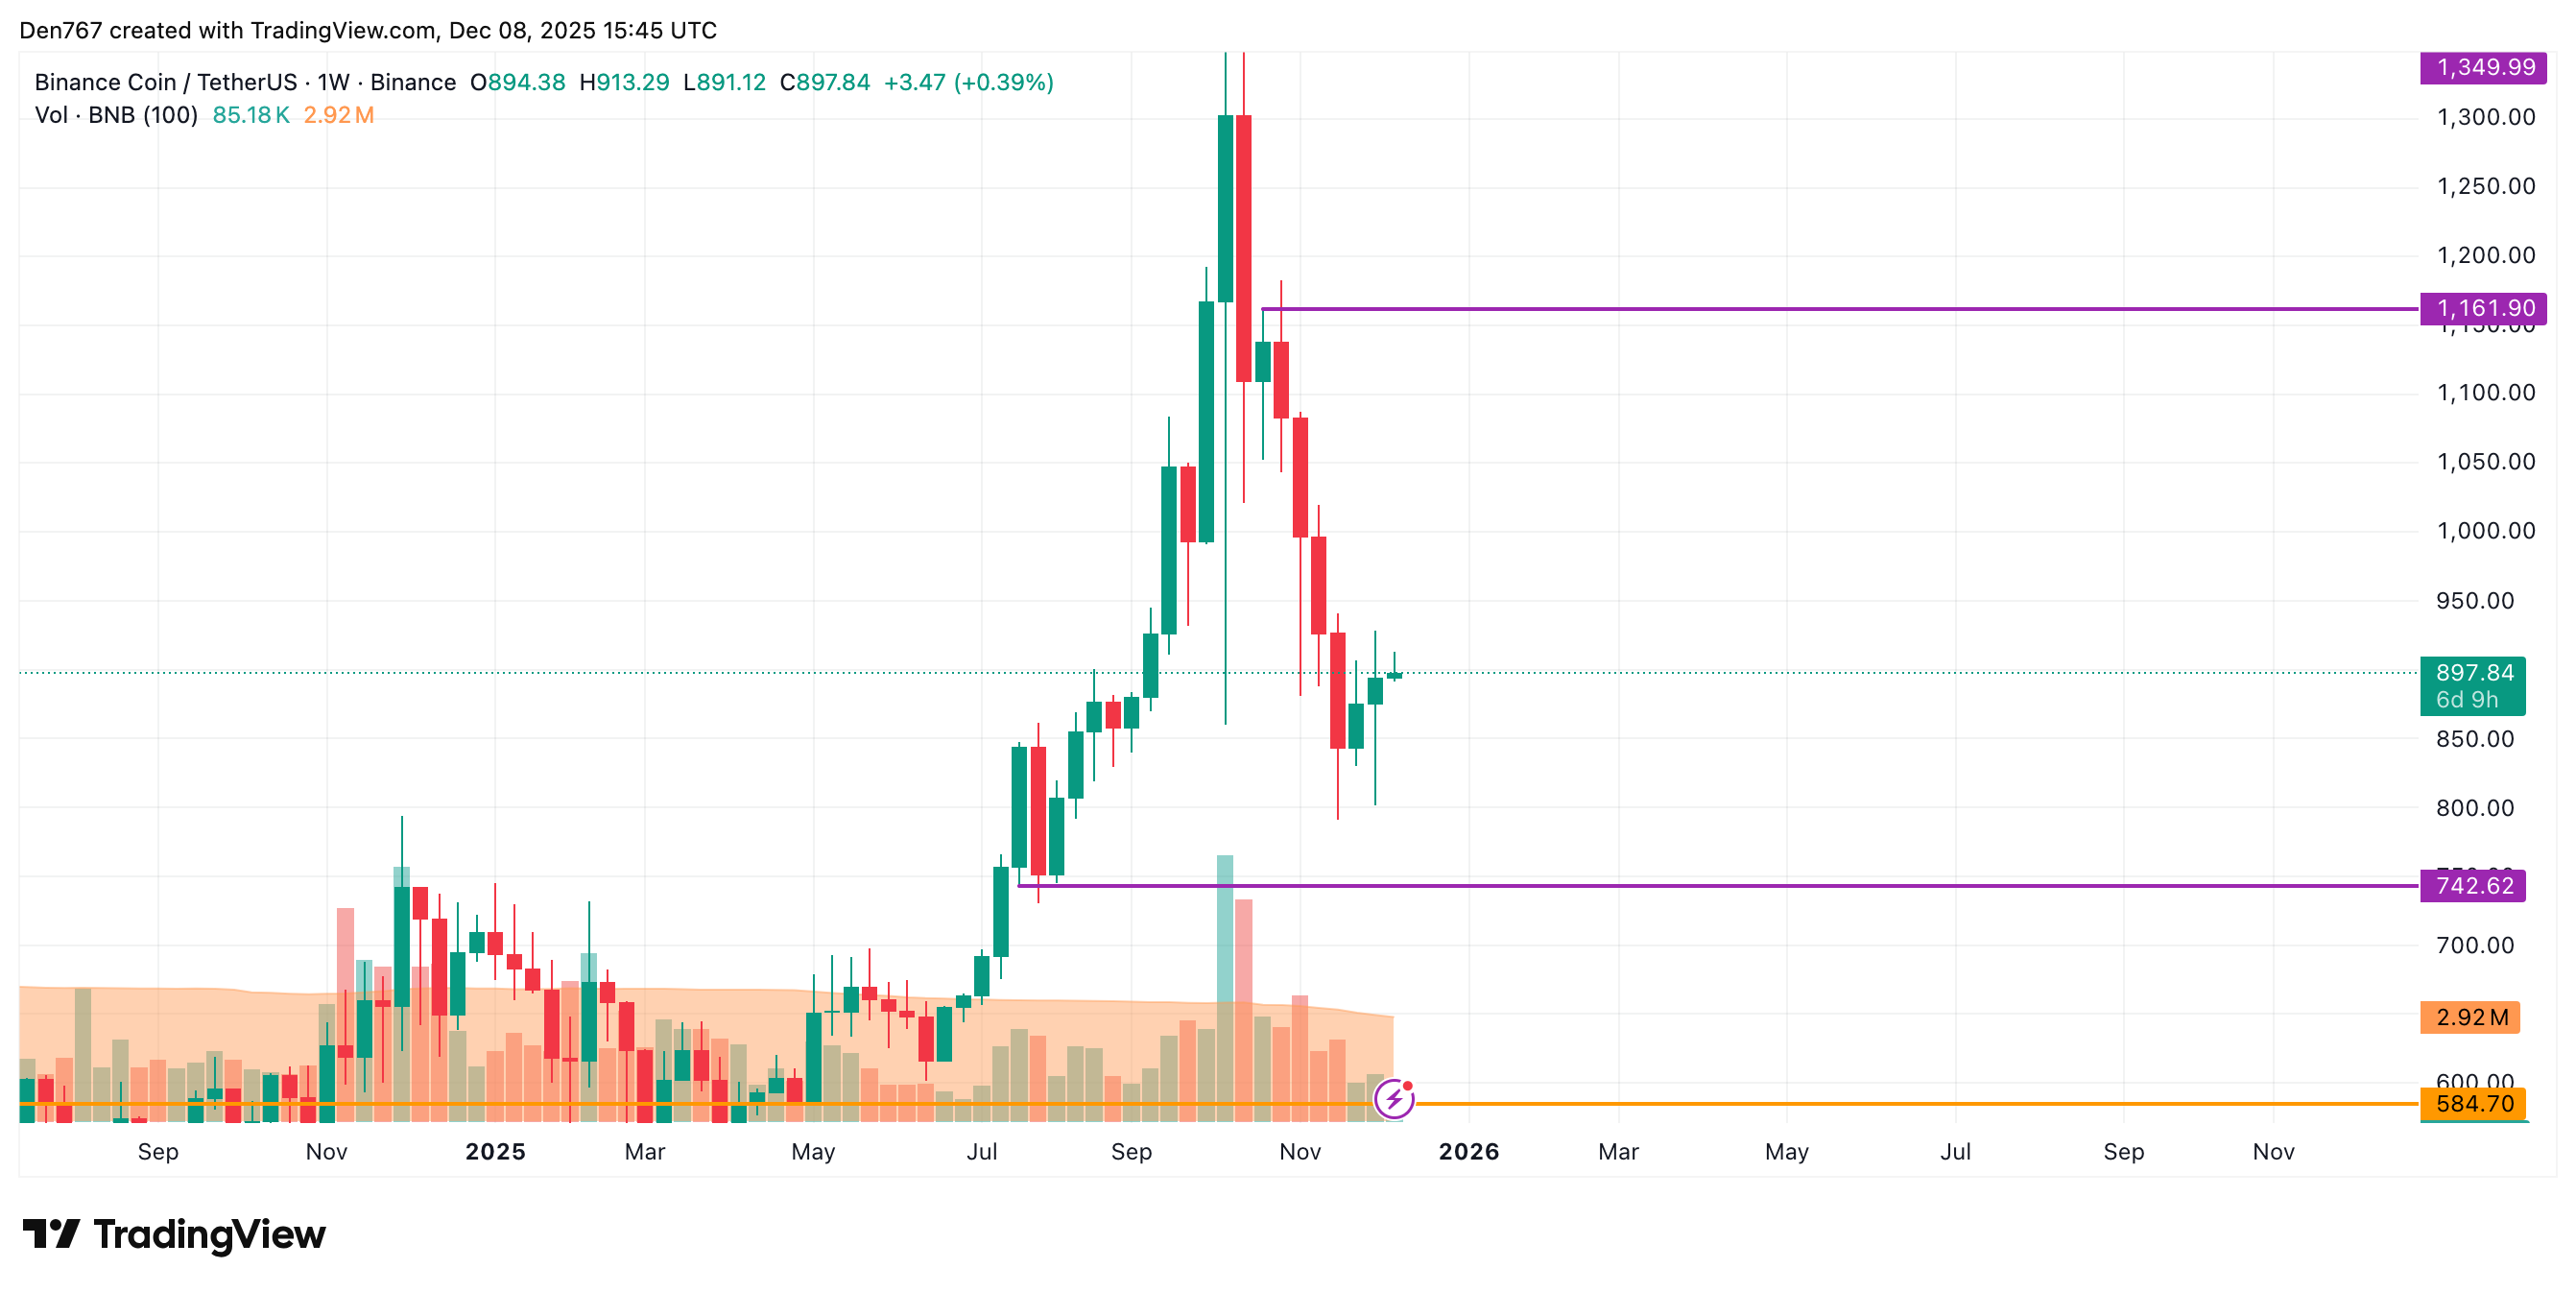
On the hourly chart, the rate of BNB is declining after a false breakout of the local resistance of $912.65. If bulls cannot seize the initiative, one can expect a test of the support by tomorrow.
On the longer time frame, the picture is neutral. As the price of the native exchange coin is far from its key levels, one should focus on the candle’s closure in terms of its bar low or peak.
You Might Also Like
If it happens with a long wick, sellers may again seize the initiative, which may lead to a correction to the $870 range.
From the midterm point of view, the week has just begun, and it is too early to make long-term predictions. However, the volume keeps going down, which means sideways trading around the current prices is the most likely scenario for BNB.
Bitcoin price prediction 2026: Bitcoin (BTC) continues to navigate intense volatility, slipping and recovering in a tight range after weeks of sharp swings and since October 10, BTC has hovered between $82,000 and $90,000, a steep fall from its early-October high of $126,000, as per a report. But despite the turbulence, Ripple CEO Brad Garlinghouse is doubling down on a bullish long-term outlook for Bitcoin and the broader crypto market, as per The Street report.
BTC USD Price Prediction: Brad Garlinghouse Predicts Bitcoin Could Hit $180,000 by 2026
Speaking at Binance Blockchain Week during a panel on the future of crypto, Garlinghouse made a bold prediction that Bitcoin could reach $180,000 by the end of 2026, saying, “I’ll say Bitcoin $180,000 on December 31st or 2026,” as quoted by The Street.
Institutional Interest From Vanguard and Franklin Templeton Seen as Bitcoin Growth Catalyst
While he didn’t break down the specifics behind his forecast, Garlinghouse pointed to ongoing regulatory progress, growing crypto adoption, and major institutions like Vanguard and Franklin Templeton moving into the US ETF space as potential drivers for the market’s next major push, as per the report.
He also highlighted the push for regulatory clarity in the US, referencing the bipartisan CLARITY Act, which aims to create a defined framework for digital assets. Garlinghouse doesn’t expect it to pass this year but believes that “sometime in the first half of next year, we’ll see passage of legislation that will continue to unlock and create more tailwinds for the entire industry,” as quoted by The Street.
Live Events
CLARITY Act Seeks to Define Rules for Digital Assets in the US
What the CLARITY Act aims to do:
Define how cryptocurrencies and tokens are classified
Clarify the roles of the SEC and CFTC
Establish operational standards for exchanges, stablecoins, and other market participants
ADA faces tight compression as resistance near $0.4468 blocks any meaningful upside push.
Elevated open interest shows traders remain active despite cooling leverage conditions.
Persistent spot outflows reveal weak confidence as markets await Hoskinson’s next update.
Cardano is entering a decisive phase as traders monitor key technical levels and shifting derivatives activity while the community anticipates possible updates from founder Charles Hoskinson. ADA trades near $0.43 after months of downward pressure, yet several indicators suggest the market is preparing for a potential shift.
The price remains below major moving averages, but futures interest and on-chain activity continue to signal strong trader engagement. Besides this, market watchers expect fresh direction as sentiment recovers from recent uncertainty.
The
cryptocurrency market is flashing green during Monday’s trading session, 8
December, 2025, prompting investors to ask why crypto is going up today.
Major assets like Bitcoin, Ethereum, XRP, and Dogecoin are posting gains,
driven by a relief bounce from recent lows.
However,
despite today’s optimism, my technical analysis suggests this is likely a
temporary pause before further declines. Below you can find a detailed
breakdown of the charts for Bitcoin, Ethereum, XRP, and Dogecoin.
Why Crypto Is Surging
Today?
The crypto
market is seeing a recovery as volatility begins to normalize. According to
Paul Howard, Director at Wincent, the market is currently establishing a
trading range rather than entering a full-blown bull run.
“We
continue to see cryptocurrency prices closely correlated with global
macro-economic events. Whilst BTC CME volatility has gradually risen the past
few weeks, the return to high 40s is welcome from many traders,” he said.
This week,
investors are focused on the Federal Reserve, which will announce its
interest rate decision on Wednesday.
How does
the technical picture look on the charts? I examine it in the following section
of the analysis.
Bitcoin Price Analysis:
Why I Believe BTC Will Drop to $74,000
BTC Current
Price: $92,000
(+1.8%)
During
Monday’s session, Bitcoin (BTC) is trading around $92,000, marking a
second consecutive day of gains. However, according to my technical analysis,
this sideways movement is merely a pause before a continuation of the downtrend
toward my ultimate target: the
April lows of $74,000.
Currently,
I see Bitcoin trapped below a critical resistance zone of $92,000 – $94,000.
On my chart, the price has already printed bearish sell signals twice at this
height, most recently a bearish engulfing pattern between December 3rd and 4th.
Bitcoin technical analysis. Why BTC price is going up today? Source: Tradingview.com
Furthermore,
I am closely watching the “Death Cross” (50-day EMA crossing below
the 200-day EMA) that
formed on November 16. To me, this is a clear signal that current levels
will not hold. I expect the recent lows to be breached, with Bitcoin eventually
descending to my target of $74,000. Only after flushing out the “weak
hands” at that level do I expect a slow re-accumulation and a eventual
return to All-Time Highs, though almost certainly not this year.
“In my
assessment, it is far too early to pop the champagne and announce that the
worst is over,” Arkadiusz Jóźwiak, Crypto Analyst and Editor-in-Chief at
Comparic.pl, said, backing my outlook. “From a technical point of view,
the downtrend will continue as long as Bitcoin does not break new higher
peaks.”
Please also check
my other articles with Bitcoin price predictions and analyses:
Ethereum Price Technical
Analysis Points to a Fall Below $1,500
ETH Current
Price: ~$3,156
(+3%)
Ethereum
(ETH) is recovering above the psychological $3,000 level, but my
analysis suggests caution. As I observe on the chart, ETH remains stuck in a
month-long consolidation between support at $2,750 and resistance at $3,400.
Similar to
Bitcoin, the moving averages on my chart show a Death Cross, confirming a
dominant downtrend. Consequently, I am betting on a breakdown from this
consolidation rather than a breakout.
Ethereum technical analysis. Why ETH price is going up today? Source: Tradingview.com
XRP Price Forecast: Why I
Am Targeting $1.25?
XRP Current
Price: $2.09
(+2.6%)
XRP is
enjoying a bounce, but I remain skeptical of this rally. My analysis identifies
a local resistance zone starting at $2.00 and extending to $1.90,
where declines halted in late November.
While the
June lows at this level previously triggered a massive rally to $3.60, the
technical situation today is vastly different. I see strong sell signals,
including another Death Cross, which supports the bears. If the current local
support fails, I assume further depreciation for XRP.
What would
change my mind? For me to flip bullish, XRP would need to reclaim the
resistance zone between $2.20 and $2.30. The optimal bullish scenario
would require a breakout above $2.70, but until then, I remain bearish.
XRP technical analysis. Why XRP price is going up today? Source: Tradingview.com
Dogecoin Price Prediction:
DOGE May Crash to $0.10
DOGE Current
Price: $0.1436
(+3.6%)
Dogecoin (DOGE)
is up 3.6% today, but on my chart, the damage has already been done. DOGE
officially broke through the major support zone I had marked based on the lows
of March, April, and June.
On November
21, the price dipped to $0.1332, proving to me that the buying pressure
has evaporated. In my opinion, the fact that the zone widened without a dynamic
rebound is a significant weakness. The pressure remains strongly bearish as
sellers have pushed the price below key technical levels.
Dogecoin technical analysis. Why DOGE price is going up today? Source: Tradingview.com
Breakdown:
On November 21, the price dipped as low as $0.1332, widening the support zone
but failing to trigger a dynamic rebound.
Trend:
Moving averages indicate a downtrend.
Recovery Hurdle: To relieve selling pressure, DOGE must return to at least $0.20
(psychological level + 200-day MA). Only then could a move toward $0.30 be
considered.
For
Dogecoin to relieve this selling pressure, it would need to return to at least $0.20
on my chart. Until that happens, I am treating this as a “hunt for
lows.” If the current fragile support gives way, I
expect a crash toward $0.10, testing the flash-crash levels from
October 10.
FAQ: Common Questions
About Today’s Crypto Market
Why is crypto going up
today?
The crypto
market is rising today due to a relief bounce and stabilizing global macro
sentiment, as noted by Wincent Director Paul Howard. However, despite the green
charts, technical indicators suggest this is a temporary correction within a
broader downtrend rather than the start of a new bull run.
What is the Bitcoin price
prediction for late 2025?
While
Bitcoin has recovered to $92,000, technical analysis predicts a drop to $74,000
in the coming weeks. A “Death Cross” formation and resistance at
$94,000 suggest that Bitcoin will likely revisit its April lows before any
sustainable long-term recovery begins.
Will Ethereum go back up
to $4,000?
No, it is
unlikely in the short term. Ethereum is currently trapped in a bearish
consolidation between $2,750 and $3,400. Technicals point to a high probability
of a breakdown toward $2,100, with a potential ultimate bottom below $1,500
if the bearish trend confirmed by the 50/200 MA cross continues.
Is Dogecoin a good
investment right now?
Yes, but caution
is advised. Despite today’s 3.6% gain, Dogecoin has broken major support levels
from earlier this year. Unless DOGE reclaims the $0.20 level, the chart
favors a “hunt for lows” strategy with a price target of $0.10.
Why is XRP price falling
despite the rally?
Although
XRP is up slightly today, the broader trend is bearish due to a “Death
Cross” signal. Unless XRP breaks above resistance at $2.20-$2.30,
analysts forecast a decline to $1.61 and potentially as low as $1.25.
Risk Warning: this article represents only the author’s views and is for reference only. It does not constitute investment advice or financial guidance, nor does it represent the stance of the Markets.com platform.When considering shares, indices, forex (foreign exchange) and commodities for trading and price predictions, remember that trading CFDs involves a significant degree of risk and could result in capital loss.Past performance is not indicative of any future results. This information is provided for informative purposes only and should not be construed to be investment advice. Trading cryptocurrency CFDs and spread bets is restricted for all UK retail clients.
XRP is maintaining support above $2, navigating short-term market fluctuations, while analysis of Coinglass data suggests hidden liquidity clusters could influence the next directional move.
Despite recent sideways trading, XRP’s stability above this critical floor is attracting attention from both retail and institutional participants. By examining XRP’s spot ETF filings and the Coinglass liquidation heatmap, accumulation may be quietly occurring beneath the surface, potentially setting the stage for a controlled move higher.
Liquidity Clusters Signal Possible Hidden Demand
Analyzing the Coinglass XRP liquidation heatmap as of December 7, 2025, identified significant liquidity clusters around $2.25–$2.30. Historically, these zones have coincided with short-term price bounces, suggesting that leveraged positions in this area could trigger a cascade if approached.
XRP’s liquidation heatmap reveals heavy upside liquidity and strong ETF demand, suggesting a rapid rally once the market stabilizes. Source: @Web3Niels via X
These liquidity “pools” or “magnet zones,” as they are sometimes called, indicate where concentrated long or short positions are at risk of liquidation. In assessment, XRP’s current proximity to this cluster implies that if the price moves toward it, forced liquidations may temporarily increase volatility but also potentially attract buying, creating a short-term support or resistance dynamic.
Diverging Signals: ETF Inflow vs Price Action
Institutional interest in XRP remains notable. Since mid-November 2025, XRP spot ETF filings indicate daily inflows averaging $12–$15 million, making XRP one of the most actively accumulated crypto ETF assets in this period.
However, despite this institutional accumulation, XRP trades around $2.03, roughly 20% below levels from early November. This divergence suggests that while ETFs continue absorbing supply, retail sentiment is subdued, creating a temporary disconnect between price action and fundamental accumulation. This pattern resembles historical setups where ETF accumulation preceded consolidation before breakout attempts.
Technical Structure: Support Holds, But Bulls Need Conviction
From a technical standpoint, XRP has repeatedly defended the $2 support zone on daily charts, indicating a resilient floor. Each bounce off this level coincided with volume spikes, reinforcing the area’s significance.
XRP remains strong above key support, with bulls defending the floor, while a break above the falling channel could trigger a larger upward move. Source: TheSignalyst on TradingView
Still, for a sustained bullish reversal, price would likely need to break the descending channel and surpass recent major highs near $2.35–$2.40. Until then, it weighs short-term scenarios based on support retention:
Support holds: Look for measured long entries near $2.
Support breaks: Prepare for a potential downside toward $1.85–$1.90, which would invalidate the immediate bullish thesis.
What Is a Liquidation Heatmap and Why It Matters for XRP
A liquidation heatmap aggregates leveraged positions across exchanges, highlighting where forced liquidations, either long or short, are probable. On Coinglass, hotter zones (red or yellow) show higher liquidation concentration.
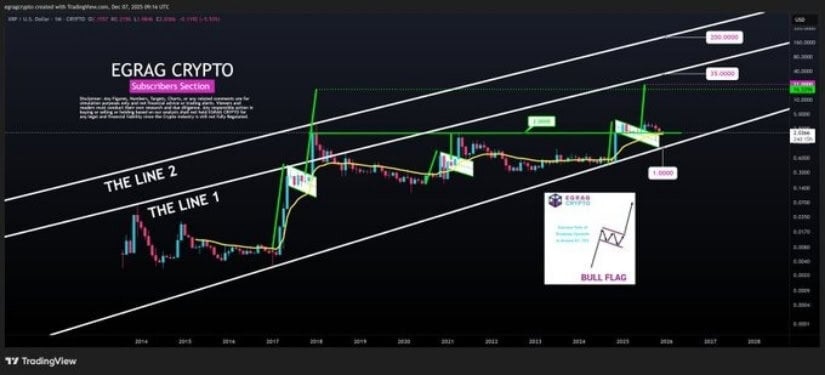
XRP holds above $2 and the 21 EMA, showing a macro bullish setup with potential upside toward key long-term targets. Source: @egragcrypto via X
Based on a review of XRP’s historical patterns, these clusters have reliably indicated short-term reaction zones. Price often “gravitates” toward them, producing either a short squeeze or temporary retracement. However, false signals are possible, particularly in thin liquidity periods or during low-volume holidays, emphasizing the importance of combining heatmap data with structural support analysis.
Applying this concept to XRP, the existing liquidity cluster around $2.25 suggests that if the price moves higher toward that zone, a significant amount of latent liquidity could be unlocked, possibly igniting a strong short-squeeze or rally.
Looking Ahead: Quiet Strength Hidden Beneath the Surface
While XRP may appear flat on surface charts, the combination of ETF inflows, defended support, and nearby liquidity clusters suggests an underlying layer of accumulation. The $2 floor continues to act as a stabilizing base, but traders should monitor the $2.25–$2.30 cluster for potential volatility triggers.
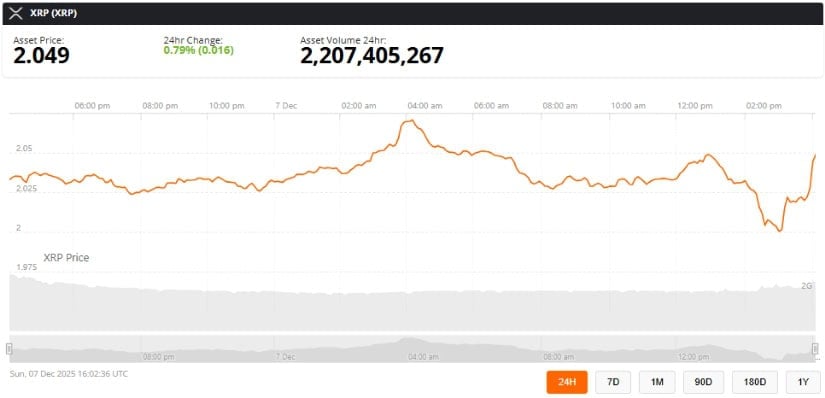
XRP was trading at around 2.04, up 0.79% in the last 24 hours at press time. Source: XRP price via Brave New Coin
The outlook remains conditionally bullish. Sustained upward momentum requires breaching the descending channel and surpassing short-term highs. Conversely, a breakdown below $2 would signal caution and possibly invite retracement. Overall, the analysis indicates that XRP’s market structure is quietly preparing for its next decisive move, with hidden liquidity likely influencing the direction.
Although the Cardano price and the price of Ripple have shown some fluctuations in the past few weeks, many influencers remain optimistic. For instance, Altcoin Piooners and DustyBC claim that massive upswings may come for these “top 10 altcoins to buy” soon. Amid all this, Digitap ($TAP) has been stealing the spotlight with its crypto presale performance.
It has managed to raise over $2 million in record time while also making early investors 188% richer. This is very impressive since the $TAP coin is now in its second presale phase. As it advances, these numbers are projected to skyrocket. In fact, many analysts predict $TAP could experience a 10x surge in 2026 – potentially making it the best crypto to buy before 2025 ends.
Cardano Projected To Reach $5 Soon – How Possible Is It?
Cardano has been going through some turbulence on the price charts recently. CoinMarketCap shows that the Cardano price fell from around $0.55 to nearly $0.40 in the past month alone. In other words, nearly a 20% drop in just a few weeks for ADA.
However, influencer Altcoin Piooners believes Cardano is still one of the good altcoins to buy. According to his X post, ADA will soon see a multi-year downtrend breakout. He claims the Cardano price could go as high as $5 as a full bull market top.
$ADA Multi-Year Downtrend Breakout Loading – Patience Pays Off 🔄🚀
Cardano is quietly printing one of the cleanest multi-year descending wedge retests in crypto. After 4+ years of compression, price is hugging the upper resistance line (~$0.48–$0.50) on the 3W/3W timeframe with… pic.twitter.com/kh1DF6W2QE
But many traders are skeptical of this Cardano price prediction. This could be because to reach $5, its market cap would need to rise to around $230 billion – a big step up from its current one of $15 billion. Thus, the Cardano price may take some time to go as high as $5.
Ripple Hits a High Fear Level, a Potential Rebound Ahead?
Another altcoin that is experiencing volatile price changes is Ripple. For instance, the price of Ripple managed to rebound from a low point of $1.99 to as high as $2.20 on the one-week chart as per CoinMarketCap. But it failed to maintain that bullish momentum and fell to the $2 range again.
Some traders are still optimistic thanks to a bullish Ripple price prediction from influencer DustyBC. In a recent post, DustyBC informed his X community that this altcoin has hit its highest fear level since October. The last time this happened, the price of Ripple soared 22%.
Not only that, TradingView shows some bullish signs for the Ripple crypto. Notably, its momentum indicator and its MACD level are rising. Thus, the price of Ripple could see some gains soon. But, investors are still cautious as the XRP value has dipped nearly 15% on the YTD chart, meaning it could have trouble maintaining a long-term uptrend.
Digitap Soars 188% in Ongoing Crypto Presale – a Hidden Gem?
Digitap is one of the best performers in the crypto market right now. To clarify, the value of the $TAP crypto has gone up by 188%. It is in the second phase of its presale, and almost 140 million $TAP tokens have been sold so far.
This performance shows that even with the rest of the market cooling down, more investors are buying Digitap because the project has real utility and people see its potential.
It is also gaining attention from traders thanks to the launch of its global money app. With the app, users can create Digitap crypto cards backed by Visa. These cards can be physical, virtual, or even customized.
The cards can also be used for local store purchases or online purchases since Digitap has integrated with Apple Pay. This may make Digitap a dominant force in the e-banking space, which Allied Market Research claims will be worth $16 trillion by 2033.
The $TAP crypto is the backbone of this platform and it now costs just $0.0361. But this altcoin price is projected to go up in just a few days. Plus, there has been speculation of a Tier-1 CEX listing $TAP soon. This event may lead to a big price spike as demand rises. Due to all these factors, traders are turning to $TAP as the best crypto to buy this quarter.
Digitap Set To Surge 10x Faster Than Cardano and Ripple?
While Cardano and Ripple are still attempting to maintain their “good altcoins to buy” status, Digitap could have the edge. It boasts a smaller market cap than both of them, which may lead to faster price growth for the $TAP coin with less money needed. Thus, analysts claim $TAP could surge 10x faster in 2026.
Additionally, its expected launch price is $0.14, meaning those who join the $TAP crypto presale today could see a 287% return. This is why people are more drawn to $TAP than its peers at the moment.
Discover the future of crypto cards with Digitap by checking out their live Visa card project here:
The end of the year has been especially harsh for Dogecoin. Most cryptos have suffered, but DOGE has fallen to year lows, and current Dogecoin price predictions are bleak. However, there are still reasons to be hopeful for 2026, as Elon Musk’s help seems to be coming again.
Another meme coin, DeepSnitch AI, is not only hopeful but seems to have an open path to become next year’s big crypto explosion. Its AI-powered tool could change crypto investing for the best, and generate exponential returns in the process.
Is it true that you can pay for Tesla with Dogecoin?
On December 5, a report in The Street claimed that on Tesla’s website, there is a DOGE checkout code (not yet activated) that would allow you to pay for a car with Dogecoin. If confirmed, the development would likely boost Dogecoin price prediction, at least in the short term.
As it will be discussed in the Dogecoin technical analysis section, the current outlook for the dog-themed meme is pretty bearish. It is still to be seen whether, even with Elon Musk’s help (which is a big DOGE price driver), the coin can recover significant ground next year.
At any event, for other meme coins like DeepSnitch AI and MemeCore the forecast is much better, so Dogecoin’s troubles aren’t pervasive across the segment.
3 Best crypto to buy now
1. DeepSnitch AI (DSNT)
DeepSnitch AI is a fascinating combination of sophisticated AI technology with meme cultural appeal. Unlike other memes that simply add a funny character to what are otherwise use cases wholly unrelated to meme culture, DeepSnitch AI prods at the core of what memes represent.
Memes swarmed after the GameStop short squeeze, because the event was perceived by millions as a fight against injustice from powerful financial players. As it happens, DeepSnitch AI’s mission is precisely to empower small investors, leveling the playing field with big whales.
Its meme character, Snitch, a cheeky mouse dressed as a space superhero, is the perfect embodiment of this. And behind this, there is a top-notch system of AI agents that transform crypto data into business intelligence, available for everyone.
DeepSnitch AI’s successful presale confirms its huge potential. More than $680k have been raised in just the second stage, and the low entry price of only $0.02629 allows for huge upside. Additionally, those who buy at least $2,000 will get a 50% bonus, and those who buy $5,000 or more will get a 100% bonus.
But if you want to enjoy returns that would trump even the wildest Dogecoin price prediction, you need to buy now into the presale.
2. Dogecoin (DOGE)
Simply put, Dogecoin’s price prediction is currently bleak because the coin has fallen to its year low. On December 1, in the midst of the so-called “Grand Canyon drop” that affected the whole crypto, DOGE briefly touched a bottom of $0.1326.
What makes this fall more concerning is that it isn’t a solitary event. So far, as Dogecoin chart momentum shows, in the last couple of weeks the coin has fallen 3 times below what was its ultimate hard support this year: $0.14.
The reason why Dogecoin price prediction is still hopeful for 2026 is simply that, in recent history, it has rebounded from deeper troughs. A case in hand: last year it spiked from $0.10 to $0.40 in 3 months. If it has done it recently, it might do it again in 2026.
3. MemeCore (M)
MemeCore’s outlook is better than the current Dogecoin price prediction. The coin has recovered some ground after a sharp fall on November 27, when it fell abruptly from $1.90 to $1.25 in just 5 hours (a 34% drop).
However, since that day low of $1.22 it has risen to $1.38 at a time when most other memes were losing. This is a clear sign of differentiation, which might become more relevant next year.
Conclusion
Dogecoin’s price prediction has a few reasons for being hopeful. For DeepSnitch AI, the outlook is way better. This new crypto project has the potential to change crypto investing in 2026 and generate 100x-like returns.
However, those who wish to be part of that must take advantage of the generous bonuses of 50% (Code: DSNTVIP50) and 100% (Code: DSNTVVIP100). And they need to act quickly, since the bonuses will be valid only until the end of December.
Visit the official website to buy into the DeepSnitch AI presale now, and visit X and Telegram for the latest community updates.
FAQs
Why is Tesla’s checkout code relevant for DOGE?
Dogecoin’s price prediction gets pushed not because many people will actually buy a car with DOGE, but because it signals Elon Musk’s support and commitment towards the coin.
What could be differentiating MemeCore from other memes?
The fact that it has concrete utility, which “pure” memes do not have.
What makes DeepSnitch AI a unique meme coin?
Its deep alignment with the core of meme culture: cheekiness, rebelliousness, and a fight for justice.
Solana is currently testing the critical $130 zone amidst increased selling pressure across the crypto market. With Bitcoin approaching $90,000 and the fear index dominating investor sentiment, will this consolidation signal a mere technical retracement or the start of a deeper correction for Solana in 2025?
Solana’s Key Support Under Pressure
Solana is going through a delicate consolidation phase, with the price of SOL gradually pulling back toward the $130 zone after failing at its recent highs. This level represents a major technical pivot, while declining volumes reflect growing market indecision.
The current structure forms a horizontal range between $120 and $150, which has channeled price action for several weeks. Buyers are attempting to defend the $130 threshold, but selling pressure remains present. However, bearish momentum appears to be weakening, suggesting a possible stabilization ahead.
On the indicator side, the Stochastic RSI sits in an extreme oversold zone and is beginning to recover, while the MACD shows progressive convergence. These signals suggest a possible technical bounce, but it must be confirmed by a return of volume and the recapture of key resistance levels.
Price Scenarios and Bitcoin’s Central Role
The bullish scenario relies on a recovery above $145–$150, a level whose breakout could open the path toward the $200 target in 2025. This scenario assumes, however, that Bitcoin stabilizes above $90,000 and that risk appetite returns to major altcoins.
The intermediate scenario favors a continuation of the range between $120 and $145 over several weeks. This horizontal consolidation phase would offer opportunities for short-term trading, but would primarily reflect the current absence of a strong directional catalyst.
Solana’s trajectory in 2025 remains intrinsically linked to Bitcoin’s movements. This structural correlation limits SOL’s autonomy in a market where BTC is showing signs of weakness. Institutional investors are adopting a wait-and-see approach, favoring liquidity and reducing their exposure to altcoins as long as uncertainty persists. The evolution of market sentiment and Bitcoin’s behavior will constitute the decisive variables in determining whether Solana can actually target $200 this year or whether a prolonged accumulation phase is needed first.
Related content:
DISCLAIMER
This article is for informational purposes only and should not be considered as investment advice. Some of the partners featured on this site may not be regulated in your country. It is your responsibility to verify the compliance of these services with local regulations before using them.

 Price Analysis for December 8")


