The main tag of Crypto News Articles.
You can use the search box below to find what you need.
[wd_asp id=1]
7
12, 2025
XRP Price Today: Will XRP Maintain Its $2 Support as Bullish Supertrend Aligns With CFTC Spot Contract Review?
XRP price today shows the token holding slightly above the $2 level, supported by a resilient long-term trend structure and renewed regulatory momentum that continues to influence overall market sentiment.
XRP is currently trading near $2.03 amid steady liquidity conditions, even as the broader crypto market experiences mixed volatility. Aggregated market data from major exchanges indicates strong 24-hour activity, with analysts pointing to the monthly Supertrend indicator as a key factor in maintaining bullish structure. Meanwhile, the CFTC’s progressing review of a spot XRP contract is adding further attention from institutional and retail participants tracking the latest Ripple XRP news.
XRP Price Chart Today
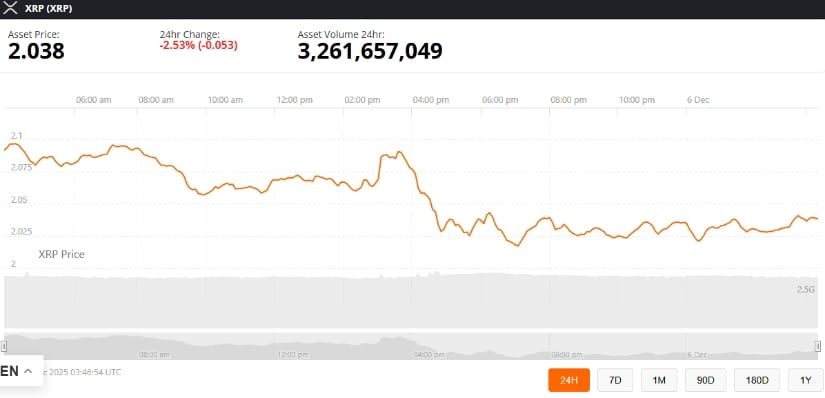
XRP is trading around $2.03, down 2.73% over the past 24 hours, based on aggregated price data from leading exchanges. Despite the slight decline, 24-hour trading volume remains above $3 billion, reflecting continued market engagement across the XRP crypto ecosystem.
XRP was trading at around 2.03, down 2.73% in the last 24 hours at press time. Source: XRP price via Brave New Coin
The asset remains above the $2 psychological threshold, a level closely watched by traders tracking the XRP price chart, liquidity shifts, and short-term momentum. Market participants note that staying above this zone helps preserve a broader upward structure, even as intraday swings persist across the digital asset market.
Supertrend Indicator Remains Bullish
The longer-term outlook for XRP remains stable, supported by the monthly Supertrend indicator—a volatility-based tool used to identify directional trends over extended periods. Independent technical analyst ChartNerd (@ChartNerdTA) commented on X that “XRP’s monthly Supertrend remains bullish. Being above the green Supertrend line indicates a strong, long-term bullish trend.”

XRP’s monthly Supertrend remains bullish, with the price above the green line, signaling continued long-term upward momentum and no immediate bearish trends. Source: @ChartNerdTA via X
The current Supertrend support sits above the $1.30 region, which previously acted as a structural divider between bullish and bearish phases during the 2018 and 2022 market downturns. XRP has maintained its position above major trend markers since early 2024, and analysts note no immediate signs of a reversal based on current readings.
However, market experts emphasize that indicators reflect historical behavior—not guarantees. Broader macro conditions, liquidity trends across the XRP Ledger, and sector-wide risk sentiment will continue to influence future price direction. Community discussions referencing long-term targets or potential ETF developments remain speculative and should be viewed as opinion, not predictive certainty.
CFTC Spot Listing Marks Major Regulatory Milestone
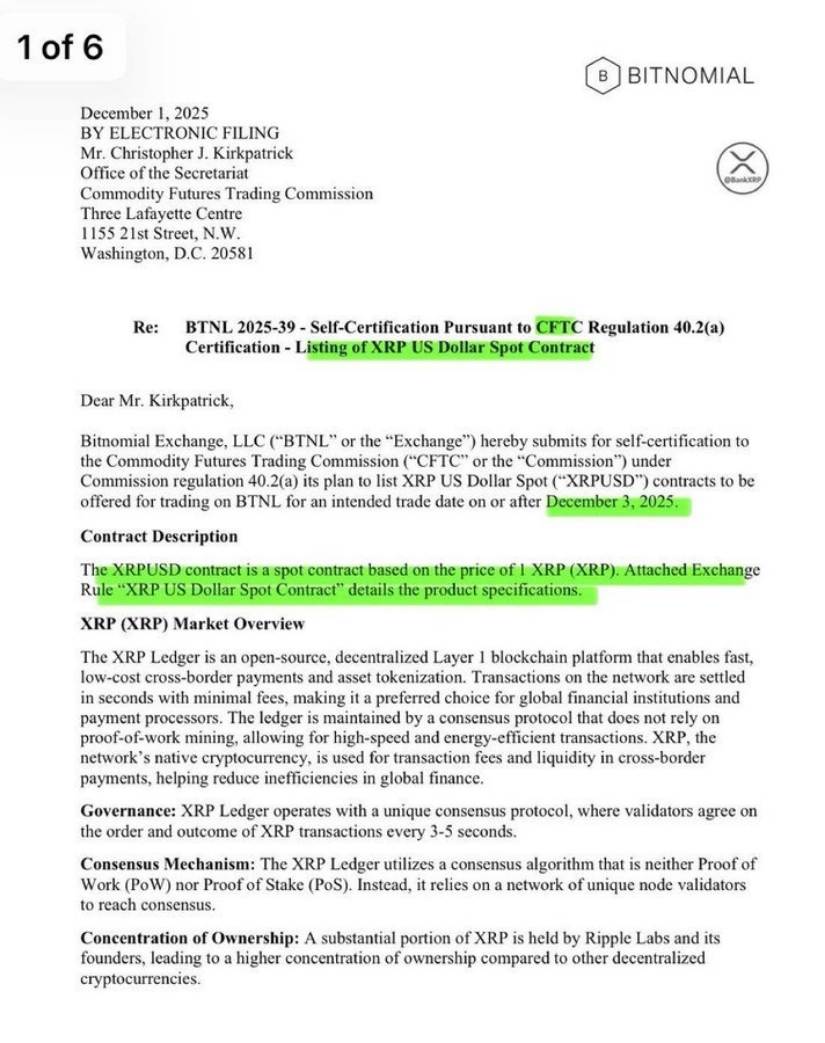
A notable development this week came from the Commodity Futures Trading Commission (CFTC), which is reviewing Bitnomial’s publicly filed self-certification to list an XRP-USD spot contract—the first digital asset proposed for the regulator’s newly developed trading platform.
CFTC’s new crypto platform will debut with Bitnomial’s SPOT XRP contract, marking XRP as the first-ever digital asset featured on the exchange. Source: @Crypt0Senseii via X
Crypto market commentator CryptoSensei (@Crypt0Senseii) described the announcement as significant for market structure, noting its potential impact on regulated access: “The CFTC is set to feature Bitnomial’s spot XRP contract as the first digital asset on its brand-new crypto trading platform.”
The filing, submitted on December 1, 2025, outlines the proposed contract, including technical details of the XRP Ledger, its consensus mechanism, and governance model. The certification aligns with Bitnomial’s expected launch of a regulated retail spot crypto venue scheduled for the week of December 8, 2025, pending applicable reviews.
Analysts note that while the development marks a step toward greater regulatory clarity, timelines and outcomes may still evolve as the CFTC continues its review process.
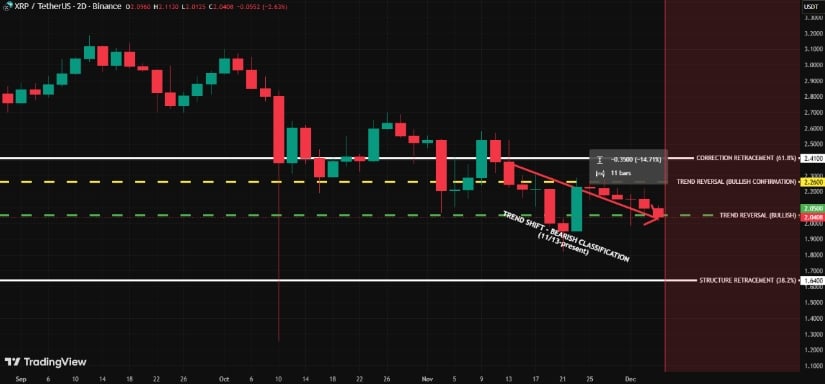
Technical Outlook: Key Levels to Watch
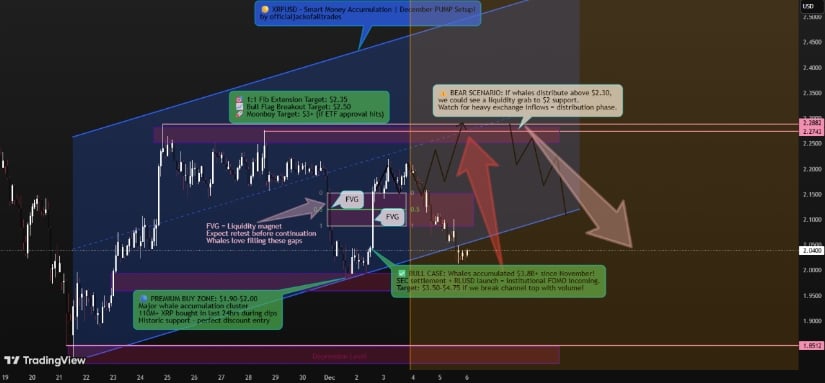
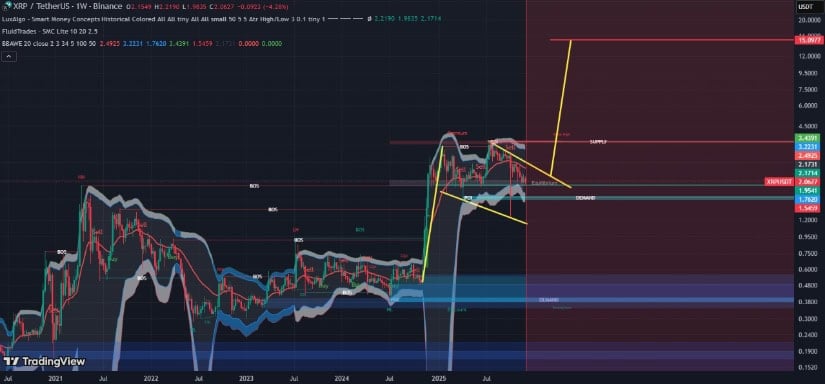
According to an independent TradingView analyst, readCrypto, several price zones may guide XRP’s next directional phase. The analyst suggests the uptrend could strengthen if XRP sustains momentum above the $2.48–$2.60 resistance area—a zone viewed as a potential breakout region rather than a predetermined target.
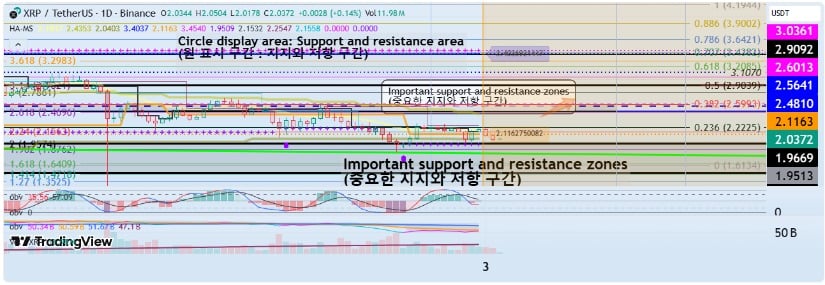
XRP’s bullish outlook strengthens as the price targets a breakout above $2.48–$2.60, while support at $1.82–$1.95 underpins the broader uptrend. Source: readCrypto on TradingView
On the downside, the $1.82–$1.95 range is identified as a key support zone aligned with monthly StochRSI readings, which help assess momentum extremes over longer timeframes. A deeper decline into the $1.50–$1.96 region may introduce the risk of a broader bearish shift, though this scenario depends heavily on overall market conditions, liquidity movements, and macroeconomic factors.
Analysts emphasize that support and resistance levels provide scenarios, not predictions, and should be interpreted within the wider context of market volatility and evolving regulatory developments.
Final Thoughts
XRP continues to trade steadily above the $2 level, supported by a stable long-term Supertrend reading and increased attention following Bitnomial’s self-certification filing with the CFTC for an XRP spot contract. While short-term volatility is expected across the crypto market, XRP’s strong liquidity profile, transparent ledger structure, and expanding institutional focus continue to shape its position within the digital asset landscape.
As traders watch how XRP interacts with the $2.10 region and broader resistance levels, market conditions—not individual indicators—will determine whether momentum can sustain. With regulatory developments progressing and interest in the XRP Ledger ecosystem growing, the XRP price outlook remains a central narrative within ongoing XRP news today, supported by both technical observations and evolving market structure.