The main tag of Crypto News Articles.
You can use the search box below to find what you need.
[wd_asp id=1]

4 12, 2025

XRP Holds Above $2 as ETF Inflows Surge and Vanguard Opens the Door (December 3, 2025)

By |2025-12-04T05:04:02+02:00December 4, 2025|Crypto News, News|0 Comments

Disclaimer: This article is for informational purposes only and does not constitute financial or investment advice. Cryptocurrency investing is highly risky; never invest money you cannot afford to lose.


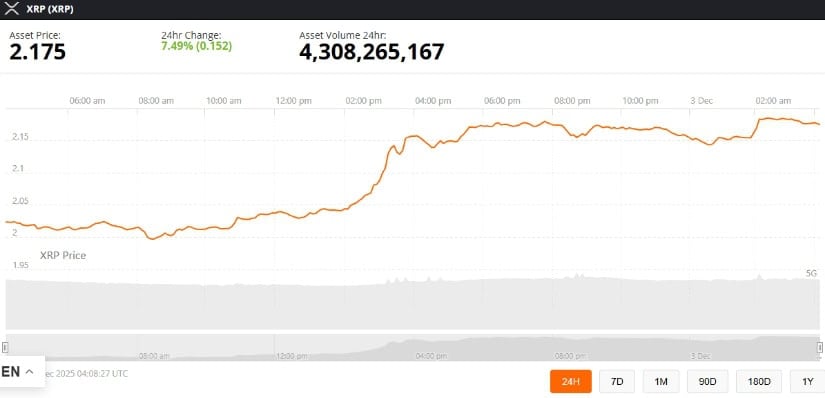
XRP Price Today – Snapshot on December 3, 2025

As of December 3, 2025, XRP is trading around $2.18. Data from Investing.com shows today’s spot price near $2.19, with an intraday range of roughly $2.14–$2.22, and a gain of about 1.6% on the day.  [1]

Market data from Crypto.news puts XRP at roughly $2.16, with a 24‑hour low/high of about $2.06–$2.2124‑hour volume near $4.8 billion, and a market capitalization around $130 billion, keeping XRP firmly in the large‑cap tier (currently ranked fourth by market cap).  [2]

Despite a ~18% drop in November, which saw XRP break below an ascending channel and test key support levels, technical pressure has eased in early December as the token stabilizes above $2.00[3]

Today’s price action sits at the intersection of three major stories:

  1. Record spot XRP ETF inflows,
  2. Vanguard’s shock U‑turn on crypto ETFs, and
  3. A fresh regulatory win for Ripple in Singapore, alongside a 1 billion XRP escrow unlock that the market appears to have digested without panic.  TechStock²+2Ripple+2

Let’s unpack what’s moving XRP right now – and what today’s analysts are saying about where the XRP price might go next.


ETFs Steal the Show: XRP Becomes 2025’s Breakout ETF Trade

Record XRP ETF Inflows

Several of today’s most‑read pieces focus on one big fact: spot XRP ETFs are pulling in huge amounts of capital.

  • A CryptoSlate analysis reports that newly launched U.S. spot XRP ETFs have attracted around $756 million in net inflows over just eleven consecutive trading sessions since mid‑November, even as many Bitcoin and Ethereum products saw net redemptions.  [4]
  • CoinMarketCap’s research team similarly highlights $756 million of cumulative inflows, equivalent to nearly 330 million XRP absorbed by ETF issuers.  [5]
  • Crypto.news cites about $824 million in combined spot XRP ETF inflows, suggesting the complex is closing in on the symbolic $1 billion milestone.  [6]

Even more striking, CryptoSlate notes that XRP ETFs now hold about 0.6% of the token’s total market capitalization, and that while Bitcoin ETFs lost more than $2 billion and Ethereum products nearly $1 billion over the same period, XRP funds continued to print steady inflows.  [7]

Vanguard’s U‑Turn: 50 Million Investors Just Got Access to XRP ETFs

The ETF narrative kicked into a new gear this week with Vanguard’s long‑awaited pivot into crypto:

  • Barron’s reports that Vanguard has lifted its ban on crypto ETFs and mutual funds, allowing its 50‑million‑strong client base to trade third‑party products tied to Bitcoin, Ethereum, XRP and Solana via its brokerage platform.  [8]
  • MarketWatch and InvestmentNews confirm that trading in these ETFs begins this week, describing the move as Vanguard “dipping a toe” into crypto while still refusing to launch its own in‑house products.  [9]
  • CryptoSlate characterizes the decision as Vanguard “caving on crypto to retain clients,” opening a $9.3 trillion platform to spot Bitcoin, Ethereum, XRP and Solana ETFs.  [10]

For XRP specifically, multiple reports note that major issuers such as Bitwise, Franklin Templeton and Grayscale now see their XRP products listed on Vanguard’s platform, significantly broadening potential institutional and retail access.  [11]

In short: even if today’s XRP price sits near $2.18, the flow data tells a different story – large investors are steadily allocating via regulated wrappers.


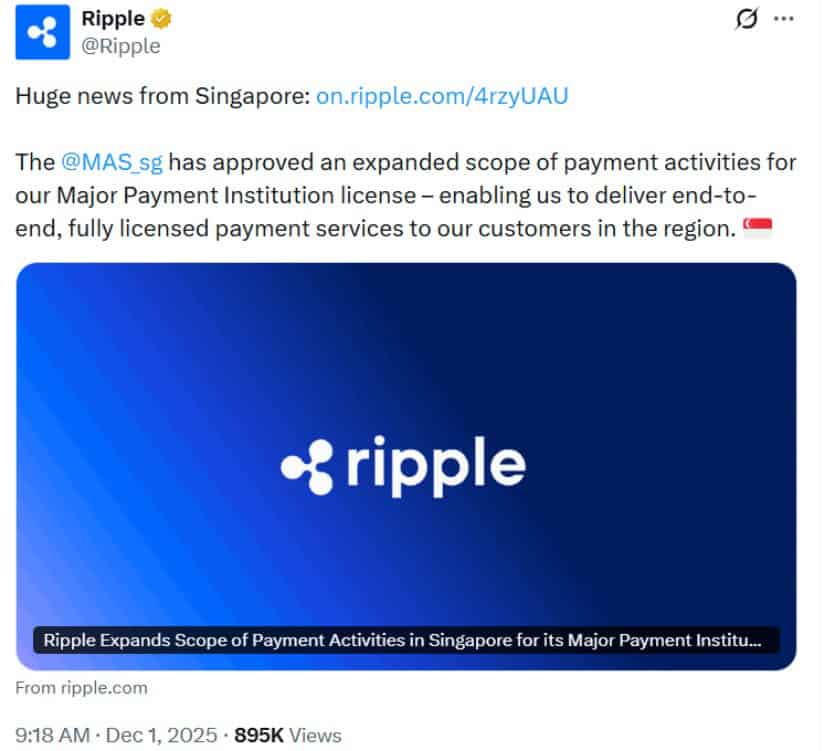
Ripple’s Singapore License: Real‑World Payments Tailwind

On December 1, Ripple announced that the Monetary Authority of Singapore (MAS) had approved an expanded scope of payment activities under the Major Payment Institution (MPI) license held by its Singapore subsidiary, Ripple Markets APAC.  [12]

According to Ripple’s press release:

  • Ripple can now broaden its regulated payment offerings in Singapore.
  • Ripple Payments uses digital payment tokens such as XRP and RLUSD (Ripple’s USD‑pegged stablecoin) to support near‑instant cross‑border settlements for banks, fintechs and crypto firms.  [13]

Commentary from payments and fintech outlets emphasizes a few key implications:

  • Singapore is a regional hub for on‑chain activity, with Asia‑Pacific leading the world in real digital asset usage.  [14]
  • Expanded licensing strengthens the case for enterprise‑grade XRP use in payments, which could incrementally support transactional demand over time – even if the short‑term price impact is hard to quantify.  [15]

For price‑focused traders, today’s takeaway is that regulatory clarity in a major financial center is now a tailwind rather than a risk – a narrative that often matters as much as raw transaction volumes.


1 Billion XRP Unlocks – and the Market Barely Flinches

In a headline that dropped this morning, U.Today reports that Ripple completed its usual monthly escrow unlock of 1,000,000,000 XRP – a release worth over $2.19 billion at current prices.  [16]

Key details from that article:

  • Ripple continues its long‑running pattern: 1 billion XRP is released from escrow, then a large chunk (recently around 600 million XRP) is relocked, with the rest hitting circulating supply.  [17]
  • Ripple still holds roughly 34.5 billion XRP in reserves, meaning this monthly process is far from over.  [18]
  • Despite fears of a supply shock, the price reaction was muted: XRP dipped about 1.5% in the hours after the unlock alert, then pushed to new intraday highs, leaving analysts to argue that the market had largely priced in the event.  [19]

Technically, U.Today notes that if XRP can sustain its recent gains, the next visible resistance lies near $2.33, aligned with the upper Bollinger Band on the daily chart, about 6–7% above current levels[20]

The message from today’s coverage: supply overhang from escrow remains a long‑term structural issue, but the market is increasingly desensitized to routine unlocks, focusing more on ETF flows and macro risk.


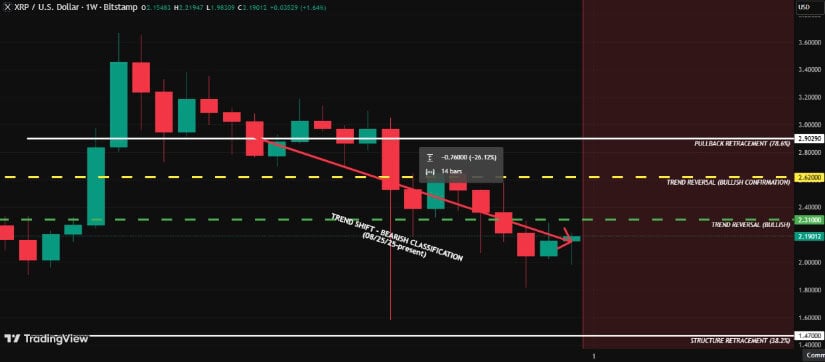
Technical Picture: Key XRP Levels Traders Are Watching

Today’s December 3 analyses paint a nuanced technical backdrop.

Short‑Term Bullish Patterns

A widely circulated Crypto.news piece argues that XRP could rally about 40% in December, with a target around $3.00[21]

  • On the three‑day chart, XRP has repeatedly defended a key support near $1.85, forming a falling wedge – a pattern often viewed as bullish when it breaks upward.
  • The token has moved above the 50% Fibonacci retracement of its prior move and printed a “morning star” and emerging inverse head‑and‑shoulders pattern, both classic reversal signals.
  • Crypto.news puts the next “psychological” target at $3, roughly 40% above the current $2.16–$2.18 zone, while warning that a drop below $1.85 would invalidate the bullish setup and open the door to $1.56[22]

U.Today and The Crypto Basic add granular daily‑chart color, highlighting:  TechStock²+1

  • Immediate resistance in the $2.17–$2.28 band.
  • A cluster of Fibonacci supports around $2.10$2.05$1.99, and deeper levels around $1.91–$1.81.
  • bullish MACD cross on the daily timeframe suggesting early upside momentum, contingent on a sustained break above the $2.17–$2.28 “ceiling.”

Bearish Overhang and $2 Support Under Attack

Not everyone is convinced. A December 1 technical deep‑dive from CCN underscores that XRP dropped roughly 18% in November, breaking below an ascending channel and flipping key indicators bearish:  [23]

  • The Supertrend indicator has turned red and now sits above price, indicating short‑term bearish control.
  • The Bull‑Bear Power and Awesome Oscillator have slipped into negative territory, confirming weakening momentum.
  • On‑chain, daily active addresses (DAA) divergence remains negative, hinting that network demand is not yet matching price.
  • CCN warns that losing the $2 support could expose XRP to the $1.77 region, while a clean breakout above the descending channel could open a path toward $2.65.

Centralization & Whale Dynamics

CryptoSlate’s ETF‑focused analysis raises a different kind of risk: ownership concentration. Santiment data cited in the report shows that the number of “whale” and “shark” wallets holding at least 100 million XRP has fallen by about 20.6% in the last eight weeks, even as ETFs accumulate supply.  [24]

Interpretations vary:

  • Some analysts call this “consolidation into strong hands.”
  • Others caution that with nearly half of circulating supply held by a shrinking cohort of large entities, XRP’s liquidity profile becomes more fragile: any coordinated selling could trigger sharp downside spikes despite robust ETF demand.  [25]

Taken together, today’s technical coverage portrays an asset at a crossroads: structurally supported near $2, facing a dense overhead band between $2.17 and $2.60, and heavily influenced by a mix of ETF flows, on‑chain concentration, and macro risk appetite.


Today’s XRP Price Forecasts: From $2.60 to $5.60 – and Beyond

Near‑Term Targets (Days to Weeks)

Across December 3 articles and fresh research published over the past 24 hours, several short‑term levels appear repeatedly:

  • $2.33 – U.Today’s next resistance, aligned with the daily upper Bollinger Band.  [26]
  • $2.60–$2.65 – Cited by both CCN and other technicians as an upper target if the descending channel breaks to the upside.  [27]
  • $3.00 – Crypto.news’ approximate upside target based on wedge and inverse head‑and‑shoulders patterns (about 40% above current price).  [28]

A separate note from 24/7 Wall St. earlier this week argued that XRP is clinging to a crucial $1.90 floor, with a technical TD Sequential buy signal hinting at the possibility of a rebound toward $2.30–$2.45 in the near term – though they stressed that failure to hold the $1.90 area could quickly flip the signal into a false start.  [29]

TipRanks, drawing on ETF data and a bullish TD Sequential signal on the weekly chart, suggests that if the pattern plays out as in past instances, XRP could rally as much as 174% from current levels, potentially reaching around $5.60, provided it can first clear the $2.20–$2.50 resistance zone[30]

Medium‑Term Forecasts (Into Late 2025–2028)

Today’s more medium‑range outlooks are varied – and sometimes contradictory:

  • In an analysis highlighted by InvestX, Standard Chartered reportedly maintains a bullish but measured view, projecting XRP at around $5.50 by the end of 2025 and extending to roughly $12.50 by 2028, based on expectations of banking adoption and regulatory clarity following wins like the Singapore MPI license.  [31]
  • Brave New Coin (in a fresh but slightly forward‑dated article) discusses a long‑term Elliott Wave structure in which XRP could potentially reach $10 by mid‑2026, assuming a bullish “Wave V” unfolds after the current consolidation around $2.15. Analysts emphasize these projections as conditional and speculative, not time‑locked promises.  [32]

At the same time, CryptoSlate and CCN both remind readers that XRP’s weekly trend has been technically fragile for weeks, with price still below key structural reversal levels around $2.31–$2.62, meaning any medium‑term bullish scenarios depend on a decisive weekly close above those zones.  [33]

Long‑Term Predictions (2030 and Beyond)

Longer‑horizon forecasts published or updated today range from “optimistic” to “borderline science fiction.”

A new Changelly “XRP Price Prediction 2025–2030” article (dated December 3, 2025) aggregates several algorithmic and expert models:  [34]

  • 2026: Expected average price around $2.16, with a tight range near $2.13–$2.15.
  • 2028: Average price near $6.88, with a projected band of $6.64–$7.86.
  • 2030: Average around $15.09, with a range of roughly $14.68–$16.68.
  • 2032–2034: Models grow extremely bullish, with averages in the $30–$66 range and maximums approaching $77.75 by 2034.
  • 2040–2050: Ultra‑long‑term extrapolations point to four‑digit prices (over $1,300 by 2040 and nearly $1,900 by 2050), which would imply XRP rivaling or surpassing the market capitalization of today’s largest global asset classes.

Meanwhile:

  • Popular XRP analyst EGRAG has floated scenarios in which XRP could eventually reach $33 under aggressive conditions, according to coverage highlighted in several news roundups.  [35]
  • An InvestX feature published today catalogs social‑media‑driven “moonshot” targets between $1,500 and $2,000 per XRP, often based on claims of gold backing or complete replacement of the SWIFT system – targets the article itself describes as economically implausible in the foreseeable future because they would imply market capitalizations larger than the global money supply.  [36]

The takeaway: credible long‑term models already span an enormous range (from low single‑digits to double‑digits by 2030), while social‑media narratives reach far beyond what most analysts consider realistic. None of these projections are guarantees; they are best‑guess scenarios built on assumptions that could easily prove wrong.


Key Risks to the XRP Price Highlighted Today

Amid the excitement, today’s coverage repeatedly flags several risks that could derail bullish XRP price forecasts:

  1. Ownership Concentration & Liquidity Shocks
    • Fewer very large wallets are holding a bigger share of XRP. A sharp change in positioning by this small cohort could overwhelm ETF demand in the short term.  [37]
  2. Macro Environment
    • Crypto.news notes that expectations of future Federal Reserve rate cuts are part of the bullish thesis, but a surprise re‑tightening or growth shock could hurt all risk assets, including XRP, regardless of ETF inflows.  [38]
  3. Technical Breakdown Below $2
    • CCN’s analysis emphasizes that $2 remains a “line in the sand.” Sustained trading below that level could expose XRP to $1.77 or even deeper support, undermining the current bullish wedge and inverse head‑and‑shoulders narratives.  [39]
  4. Ongoing Supply Overhang from Escrow
    • Monthly 1 billion XRP unlocks mean new supply will continue to drip‑feed into the market for years, even if a large share is relocked each month.  [40]
  5. Regulatory and Competitive Pressure
    • While Ripple’s Singapore win is positive, regulatory regimes elsewhere can still shift unfavorably. Competing networks and alternative payment rails continue to evolve, challenging XRP’s “global settlement layer” thesis.  [41]

For Google News and Discover readers, the message is clear: today’s bullish headlines are counterbalanced by serious structural and macro risks.


What to Watch Next for XRP

Based on today’s December 3 news, traders and long‑term holders alike are watching several key signposts:

  • Can XRP hold above $2.00?
    A weekly close comfortably above this level would reinforce the idea of a durable floor; a breakdown would validate more bearish December scenarios.
  • Do ETF inflows hit – and sustain – $1 billion+?
    Crossing the $1 billion mark in spot XRP ETF assets could cement XRP’s status as the leading altcoin ETF trade, but a sharp slowdown in flows would challenge that narrative.  [42]
  • How much volume actually comes from Vanguard’s platform?
    The announcement of access is one thing; sustained allocations from retirement accounts and traditional portfolios are another. Vanguard’s internal messaging remains cautious.  [43]
  • Real‑world payment traction in Singapore and beyond
    Evidence that Ripple’s expanded MPI license is driving measurable payment volumes using XRP/RLUSD would strengthen the “utility” leg of the bull case.  [44]
  • Resolution of the centralization debate
    Additional on‑chain data showing whether whale concentration is stabilizing, worsening, or dispersing will matter for long‑term confidence.  [45]

Final Thoughts

On December 3, 2025, XRP is more than just a $2‑plus token with a volatile chart:

  • It is the hottest altcoin in the ETF arena, with hundreds of millions of dollars in inflows.
  • It just gained another regulatory foothold in Singapore.
  • It shrugged off a billion‑token escrow unlock that would once have terrified the market.

At the same time, the price remains tightly boxed in between a vulnerable $2 support and sticky resistance in the $2.30–$2.60 region – with analysts split between cautious optimism and warnings of further downside.

Whether XRP’s current consolidation becomes a springboard toward $3–$5+ or a precursor to another leg lower will depend on what happens next with ETF flows, whale behavior, macro conditions, and real‑world payment usage.

For now, the only certainty is volatility — and the need for disciplined risk management for anyone exposed to XRP.

References

1. www.investing.com, 2. crypto.news, 3. www.ccn.com, 4. cryptoslate.com, 5. coinmarketcap.com, 6. crypto.news, 7. cryptoslate.com, 8. www.barrons.com, 9. www.marketwatch.com, 10. cryptoslate.com, 11. www.fxleaders.com, 12. ripple.com, 13. ripple.com, 14. ripple.com, 15. bravenewcoin.com, 16. u.today, 17. u.today, 18. u.today, 19. u.today, 20. u.today, 21. crypto.news, 22. crypto.news, 23. www.ccn.com, 24. cryptoslate.com, 25. cryptoslate.com, 26. u.today, 27. www.ccn.com, 28. crypto.news, 29. 247wallst.com, 30. www.tipranks.com, 31. investx.fr, 32. bravenewcoin.com, 33. bravenewcoin.com, 34. changelly.com, 35. thecryptobasic.com, 36. investx.fr, 37. cryptoslate.com, 38. crypto.news, 39. www.ccn.com, 40. u.today, 41. ripple.com, 42. cryptoslate.com, 43. www.barrons.com, 44. ripple.com, 45. cryptoslate.com

Source link

4 12, 2025

Which One Will 10x First?

By |2025-12-04T03:03:31+02:00December 4, 2025|Crypto News, News|0 Comments

Solana has been experiencing volatile days, with bears trying to seize the momentum, but a bullish divergence has appeared on the daily chart, indicating a possible upward recovery.

DeepSnitch AI presale is trending and breaking records with its artificial intelligence project. It has already surpassed $650,000, with the token price rising 70%. The network has launched, and the community has become even more excited after testing the technology, speculating that this could be the next crypto to 100x.

The Brazilian government suggests the idea of ​​creating a Bitcoin strategic reserve

On November 29th, the Blockchain Conference Brazil took place, an event to discuss the Web3 and cryptocurrency market in Brazil. At this event, Pedro Guerra (advisor to the country’s vice president) stated that he had consulted with cryptocurrency exchanges about Brazil adopting a Bitcoin strategic reserve.

Guerra highlighted that this could help the country combat inflation, as well as diversify government investments. He argued that many investments, such as public funds, remain stagnant, losing value, while BTC has been one of the assets that has appreciated the most, and even countries like the US are already discussing a strategic reserve.

Brazil is currently the 5th largest consumer market for cryptocurrencies, and although such a measure still needs to be approved by Congress, it is already a first step towards another nation adopting Bitcoin.

DeepSnitch AI runs towards $1 million: The hidden gem with 100x potential in 2026?

In a market as competitive and volatile as cryptocurrencies, it’s difficult to compete against large funds and whales because they have access to the best tools and reports. Small traders often miss opportunities or misjudge the timing of when to buy or sell, losing money.

DeepSnitch AI is a project that aims to fix this, creating a platform with AI agents that will help all traders, creating a more competitive and fair market. It will bring five agents, such as SnitchFeed, which monitors Telegram groups; SnitchCast, which filters the best market news; and SnitchScan, which alerts about rug pulls and suspicious smart contracts.


Thus, users will have real-time access to the best market reports and information, helping traders make better decisions and protect their portfolios. Such a project can revolutionize the market, and that’s why many investors have invested heavily, understanding its long-term potential.

Because it is still a presale, DeepSnitch AI offers tokens at low prices, but with greater upside potential. By investing today, you pay only $0.02577, which is cheap for an artificial intelligence project, but gives investors a chance for returns of up to 100x in the long run.


Solana price prediction has a bullish pattern forming

Solana recovered, rising 5% on December 2nd, returning to $132. After falling 28% in November, the chart finally seems to show a structure indicating a possible new rise. Looking at a SOL recovery analysis, Solana appears to have found a bottom at the $130 region, which may be becoming its new accumulation zone.

This would be positive for forming new support, considering that this same zone acted as firm support in previous declines. Also, looking at the chart, a bullish divergence was created, as the price fell, the CFM stopped following, forming a higher low.

If Solana could form a new accumulation zone at $130, the Solana price prediction indicates a test of its next resistances at: $167, $187, $228, and $234. With this perspective, SOL long-term outlook remains bullish, and the price around $247 continues to be the main target for a new explosive high, and could push SOL towards a new ATH.

PUMP rises 16% after aggressive buyback program

The Pump Fun experienced a significant surge on December 2nd, rising 16% to $0.003. After falling 29% in November, it seems to have finally found a bottom. Looking at the chart, some signals seem bullish, with divergences in the RSI and Fibonacci indicating a possible rise to $0.0038 and then $0.0042.

The rise appears to have been driven by several factors, such as a strong and aggressive buyback program, with the Pump Fun team buying over $194 million worth of tokens in the last weeks, for burning and decreasing the circulating supply.

There is also anticipation for the “MigrateFun” event, which will take place on December 9th and will mark the beginning of a new system for migrating old tokens to new contracts on pump.fun. This new model should facilitate the injection of liquidity into projects, and also provide new functionalities such as staking, governance, and more flexible pools.

Conclusion

SOL started December with a recovery on the daily chart. While Solana price prediction indicates that the next target is $167, a volatile market and the fact that it’s already a high market cap token make it not such an attractive investment.

For those looking for an undervalued crypto with long-term potential, DeepSnitch AI looks like the best choice. Being an artificial intelligence project, it’s in a trending sector. And because it’s still a presale, it offers an investment with greater upside, potentially becoming the next altcoin to 100x.

Visit the official website for more information, and join X and Telegram for community updates.

FAQs

1. What is DeepSnitch AI promising presale?

DeepSnitch AI is an AI-driven platform with multiple agents that help traders track market news, detect risks, and spot opportunities. Its presale is rising fast, with the token price already up 70% due to strong investor interest and long-term 100x potential.

2. What are the latest Solana ecosystem updates?

Recent Solana ecosystem updates include increased market activity and new upgrade events across projects. One highlight is MigrateFun, an initiative enabling Pump.fun tokens to migrate to new contracts with better liquidity, staking, governance, and improved pool flexibility.

3. What is the current Solana price prediction?

Analysts point to a bullish divergence on the daily chart, with the next major target at $167. If SOL maintains accumulation near $130, further resistance levels may be tested, supporting a longer-term bullish outlook.

Source link

4 12, 2025

Dogecoin (DOGE) Price Prediction: Buyers Hold $0.14 Support While Falling Wedge, Cycle Models, and ETF Buzz Guide 2025 Scenarios

By |2025-12-04T01:02:06+02:00December 4, 2025|Crypto News, News|0 Comments

This $0.14 region has historically acted as a defensive anchor during periods of market stress. TradingView data shows repeated reactions to this level across multiple cycles, making it a key area for assessing short-term momentum and long-term structural resilience.

Some experienced technical analysts who track multi-cycle structure—rather than anonymous social-media posts—note that the current price action still allows room for a short-term rebound, provided that buyers maintain consistency. This view is based on standard technical principles such as support–resistance behavior and momentum oscillators, rather than price calls from individual influencers.

While community-driven discussions often revive long-standing questions about a potential move to $1 by 2026, most data-based models place near-term fair-value ranges considerably lower. Historically informed projections that rely on previous cycle behavior and liquidity trends currently suggest a more conservative band around $0.18–$0.24, depending on overall market strength.

Cycle Structures and Long-Term Outlook

A frequently referenced long-term DOGE chart tracks multi-year structure from 2014 to 2025, highlighting prior breakout moments in 2017 and 2021 and a broader ascending trendline. Cycle analysis—while limited in its predictive reliability—can provide historical context. These models assume that investor psychology and liquidity patterns may repeat across cycles, but they also carry high uncertainty in volatile markets.

Dogecoin continues to struggle at its key demand zone, with traders watching for a rebound toward $0.20 and maintaining a long-term speculative target of $1 by 2026. Source: @Shan_Specter via X

Analysts following accumulation indicators note mixed signals: some accumulation clusters resemble early-stage cup-and-handle structures, while others show hesitation tied to current liquidity and macro conditions. Some models suggest that, if accumulation persists and market liquidity improves, DOGE could revisit ranges such as $0.30–$0.45; however, these should be interpreted as conditional scenarios—not expectations.

Community sentiment remains divided. Traders on social platforms often share highly optimistic targets (e.g., $0.42 or $1), but these views typically reflect community enthusiasm rather than data-driven forecasting. More experienced analysts caution that Dogecoin’s annual inflation of ~5 billion coins continues to weigh on long-term valuation unless accompanied by sustained demand growth.

Potential Drivers for Future Growth

Ongoing conversations around a potential Dogecoin spot ETF have contributed to heightened interest. While institutional access could influence liquidity and visibility, no approvals are guaranteed, and initial inflows into related thematic products have been modest. Historically, ETF announcements for other assets (e.g., Bitcoin and Ethereum) have shown that early inflows are not always immediate catalysts for price expansion.

Dogecoin (DOGE) Price Prediction: Buyers Hold alt=

An analyst expects Dogecoin to break its diagonal resistance within 133 days, projecting potential upside toward $0.42 and possibly $1 if momentum confirms. Source: BandForBands on TradingView

From a technical perspective, several traders point to a developing falling wedge pattern—a compression formation that can signal a reversal if price breaks the upper boundary with increased volume. This reinforces the importance of confirmation rather than anticipation.

Dogecoin’s utility—particularly in low-fee payments and microtransactions—continues to support its long-term relevance. The asset’s cultural presence has historically contributed to durable network activity, although long-term adoption trends will depend on merchant integration, user growth, and broader market conditions.

Long-Term Price Predictions

Forecasts for 2025 and beyond vary widely depending on methodology. More cautious models emphasize:

  • DOGE’s uncapped supply, which may limit long-term appreciation

  • macroeconomic constraints such as liquidity tightening

  • The possibility that enthusiasm-driven rallies may diverge from fundamentals

Meanwhile, optimistic models suggest that if DOGE repeats patterns seen in previous late-cycle expansions—and if it breaks its 2024 local high near $0.20—a consolidation zone around $0.25 could form before any larger move. These comparisons, however, are conceptual frameworks rather than precise predictive systems.

Long-Term Price Predictions

The recent launch of the Dogecoin ETF has fueled expectations of a potential rally, with some traders eyeing a move toward $0.30 and possibly $0.45 within the next one to two months. Source: homie911 on TradingView

On lower timeframes, Dogecoin has recently tested the bottom of a descending channel on the 1-hour chart. The RSI—a momentum indicator—hovered near oversold conditions, and repeated bounces around $0.15, alongside the 100-period moving average, suggest early stabilization. However, trend confirmation requires a break above channel resistance. Some traders note that a Kijun breakout on the Ichimoku system above $0.15100 could indicate a momentum shift, but this is an advanced indicator and should be used with caution.

Technical Indicators and Short-Term Overview

Recent price action shows Dogecoin under short-term pressure after falling below $0.15, triggering a high-volume selloff exceeding 1.56 billion DOGE, according to TradingView data. Despite increased discussion around Dogecoin-related ETFs from firms such as Grayscale and Bitwise, early inflows remain too small to meaningfully alter market structure.

Current metrics (approximate, Dec. 3 data):

  • Price: ~$0.15

  • Market cap: ~$20.9 billion

  • 24-hour volume: ~$1.42 billion

  • Trend: Bearish across major moving averages

  • RSI: Neutral

Technical Indicators and Short-Term Overview

Dogecoin’s monthly chart highlights a large-scale macro pattern that some traders view as a potential long-term bullish structure. Source: @TATrader_Alan via X

Dogecoin’s inflationary supply model, unlike Bitcoin’s capped system, continues to be a central factor in long-term valuation discussions. Additionally, commentary from public figures—such as Elon Musk—often generates short-lived volatility but rarely influences sustained price trends.

Market Weakness and Fundamental Drivers

Dogecoin’s market backdrop remains challenging following the 63% decline on October 10 during a broader crypto-market selloff. While the asset has since stabilized near the mid-$0.14 range, many analysts note that evidence of long-term accumulation remains limited.

Macro factors—including global liquidity constraints, regulatory developments, and inconsistent risk appetite across crypto markets—are exerting downward pressure on speculative assets. As the industry approaches 2026, analysts are watching whether DOGE can hold current support levels under shifting market conditions.

Final Thoughts

Long-term projections remain highly uncertain. Some cycle-based structural models suggest that Dogecoin could revisit or exceed previous highs in later expansion phases, but these projections rely heavily on the assumption that past behavior will repeat—a premise that historically performs inconsistently.

Final Thoughts

Dogecoin was trading at around $0.15, up 7.55% in the last 24 hours. Source: Brave New Coin

Current technical and fundamental data do not provide evidence to support an imminent or high-probability move back to $1 in the near term.

Ultimately, Dogecoin’s long-term trajectory will depend on the interplay of:

As with all crypto assets, outcomes are uncertain and evolve with market behavior, making it essential for readers to view price scenarios as conditional, not guaranteed predictions.

Source link

3 12, 2025

XRP Price Prediction: Strong $2 Support Persists Despite Whale Selling as Bullish Wedge Keeps $10 Forecast in Play

By |2025-12-03T23:01:02+02:00December 3, 2025|Crypto News, News|0 Comments

Despite renewed selling pressure from large holders, observational data suggests XRP continues to stabilize around the $2 level, while developments surrounding Ripple and its institutional footprint add a longer-term fundamental backdrop.

XRP Price Today Trades Near Key $2 Support

According to recent TradingView chart data, the XRP price continues to fluctuate near the $2 support zone—an area that has acted as a repeated demand floor during recent market pullbacks. Several technical analysts describe the current structure as a bullish wedge, a chart pattern where price compresses between rising support and falling resistance, often interpreted as weakening selling pressure when confirmed by volume.

XRP is holding above $2 in a bullish wedge, signaling growing buying pressure and a potential upside breakout soon. Source: geordiecrew77 on TradingView

Multiple TradingView analysts have noted that repeated tests of the $2 region have attracted renewed buying interest. Price compression within a tightening wedge often precedes an expansion in volatility, although confirmation from price action is still required before any directional conclusions can be drawn.

Momentum indicators remain mixed. The Relative Strength Index (RSI), a commonly used oscillator that measures buying and selling pressure, has hovered near neutral levels around 40 on higher timeframes—suggesting neither strong overbought nor oversold conditions at present.

Whale Sell-Off Adds Short-Term Pressure

On-chain metrics have introduced fresh uncertainty. On-chain data analyst Ali Martinez reported that large holders redistributed approximately 150 million XRP over 48 hours, noting on social media that “whales sold or redistributed another 150 million $XRP in the past 48 hours.”

XRP Price Prediction: Strong  Support Persists Despite Whale Selling as Bullish Wedge Keeps  Forecast in Play

XRP saw 150M tokens moved by whales amid a price drop to $2, while ultra-large wallets continued accumulating, highlighting layered market activity. Source: Ali Martinez via X

Supporting data from the blockchain analytics platform Santiment also showed increased large-wallet activity during XRP’s recent decline from approximately $2.85 in September to near $2.00 in early December. Santiment’s historical wallet tracking suggests that such movements often correlate with elevated short-term volatility rather than definitive long-term trend reversals.

Market data further indicated that XRP recorded a single-day decline of about 6% on December 2, highlighting how sensitive price action remains to large-holder distribution. At the same time, Santiment wallet metrics show that some top-tier wallets continue to accumulate, suggesting that recent selling may reflect portfolio rotation rather than broad capitulation.

XRP Price Prediction: Bullish Wedge Keeps Long-Term $10 Scenario in Discussion

While near-term sentiment has been softened by whale activity, some long-range XRP price prediction models remain constructive—though analysts consistently stress that these projections remain conditional.

Technical analyst Maelius, known for publishing long-term Elliott Wave–based market models, described the current XRP structure as Wave IV, a phase that typically represents consolidation before a potential final advance in the cycle. In Elliott Wave theory, Wave IV often reflects sideways accumulation after an impulsive rally.

XRP Price Prediction: Bullish Wedge Keeps Long-Term $10 Scenario in Discussion

MaeliusCrypto’s Elliott Wave analysis projects XRP could reach $10 by mid-2026, a 4.6× upside from its $2.15 price on December 3, 2025, though such forecasts remain speculative. Source: Maelius via X

In reference to this structure, Maelius wrote that a conservative interpretation could outline a future scenario where XRP revisits the $10 region, should Wave V develop under favorable conditions.

Another market analyst, EGRAG, who specializes in logarithmic XRP trend modeling, has outlined a hypothetical $9–$13 range in aggressive upside scenarios. However, both analysts emphasize that such outcomes depend on volume confirmation, broader market liquidity, and structural breakout validation, rather than timing-based speculation.

XRP News Today: Ripple Expands Institutional Reach in Singapore

From a fundamental perspective, institutional developments continue to shape XRP’s long-term narrative. According to an official statement from Ripple, the company recently secured an expanded Major Payment Institution license from the Monetary Authority of Singapore.

XRP News Today: Ripple Expands Institutional Reach in Singapore

MAS approves Ripple’s expanded license, enabling fully licensed payment services in Singapore. Source: Ripple via X

Ripple stated that the updated regulatory approval allows it to broaden its regulated digital payment services in the region, including near-instant settlement capabilities using Ripple USD (RLUSD), its U.S. dollar–pegged stablecoin. The company highlighted faster settlement times and improved cross-border liquidity for institutional partners as primary benefits.

Market analysts view this regulatory milestone as strengthening Ripple’s regional payment infrastructure, which could gradually influence XRP transaction demand through increased enterprise usage—though direct short-term price effects are difficult to quantify.

XRP Weekly Trend Shows Bearish Structure With Defined Reversal Levels

Despite optimistic long-term projections, the broader weekly XRP structure remains technically fragile. According to a trend classification model shared by multiple market technicians, XRP has remained in a bearish phase for roughly 14 consecutive weeks, with price still trading beneath key structural thresholds.

XRP Weekly Trend Shows Bearish Structure With Defined Reversal Levels

As of December 2, 2025, XRP trades at $2.15 in a 14-week bearish trend, with key levels at $2.31, $2.62, and $1.47; the analysis is fully reactive and observational. Source: GURULifeline on TradingView

Analysts are currently monitoring the following technical reference levels:

  • Bullish trend reversal level: $2.31

  • Bullish confirmation zone: $2.62

  • Major structural support: $1.47

This framework follows a confirmation-based methodology, meaning directional bias is only adjusted after the price closes decisively above these levels rather than on anticipatory signals.

XRP Price Forecast Hinges on $2 Support and Channel Breakout

Market observers generally agree that the $2 area remains the most decisive level for the near-term XRP price forecast. Some analysts believe that maintaining this support could preserve the existing bullish wedge structure, while a breakdown below it could expose lower historical demand zones.

Recent exchange trading data shows that volume during recent pullbacks briefly approached nearly 3% of circulating supply, a statistic often interpreted by market technicians as evidence of both strong speculative participation and defensive buying.

A confirmed breakout above descending channel resistance—a trendline that currently restricts upward momentum—would be considered a constructive technical signal in many trading models. Conversely, sustained weakness below $2 could increase downside risk.

Looking Ahead: Cautious Optimism for XRP in 2025

Based on the current balance of technical and on-chain data, many analysts describe the XRP price prediction 2025 outlook as cautiously optimistic rather than decisively bullish. Technical patterns suggest possible accumulation near $2, while institutional developments and long-term wave models keep higher price scenarios within speculative discussion.

Looking Ahead: Cautious Optimism for XRP in 2025

XRP was trading at around 2.17, up 7.49% in the last 24 hours at press time. Source: XRP price via Brave New Coin

However, as one recent TradingView market report noted, “Without price confirmation, projections remain probabilistic—not predictive.”

For now, XRP remains at a technical crossroads—supported by persistent buying interest near $2, tested by whale-driven volatility, and influenced by expanding institutional adoption within global payment networks.

Source link

3 12, 2025

SOL Reclaims $140 as ETF Inflows and On‑Chain Demand Spike

By |2025-12-03T21:00:02+02:00December 3, 2025|Crypto News, News|0 Comments

Solana’s price is surging today. As of publication on December 3, 2025, SOL is trading around $141–$142, up roughly 11% in the last 24 hours, with a market cap of about $79 billion, keeping it firmly in the global top‑10 cryptocurrencies. [1]

At the same time, Solana remains about 55–57% below its all‑time high near $295, reminding traders that the current rally is taking place after a deep, multi‑month drawdown. [2]


Key points

  • Price today: Around $141–$142, up ~11% in 24 hours, ranking #6 by market cap. [3]
  • Macro backdrop: Crypto market cap is near $3.15 trillion, with Bitcoin above $93,000, lifting major altcoins including Solana. [4]
  • Main catalyst: A combo of Solana spot ETF inflows, Franklin Templeton’s SOL ETF trading approval, and Vanguard’s new support for crypto ETFs. [5]
  • On‑chain & derivatives:TVL and stablecoin liquidity on Solana are rising, while futures open interest has jumped, signaling fresh risk‑on positioning rather than just short covering. [6]
  • Outlook: Short‑term models keep SOL in the $140–$155 range this month, while long‑term analyst targets for 2025 stretch from double‑digit downside to multi‑hundred‑dollar upside. [7]

Important: All prices and metrics are approximate at the time of writing and can change rapidly. Nothing in this article is financial advice.


Solana price today: where SOL stands on 3 December 2025

According to real‑time data from major aggregators, Solana is trading near $141–$142, with:

  • 24‑hour gain: around +11%
  • 24‑hour trading volume: just over $7 billion
  • Market cap: roughly $79 billion, ranked #6 globally. [8]

CoinGecko’s 7‑day view shows Solana bouncing from a low near $126.75 on Tuesday to about $141.65 today, with today’s move alone adding roughly $14.64 (+11.5%) in 24 hours. [9]

Despite the strong rebound, Indonesian exchange Pintu notes that Solana is still about 57% below its all‑time high of $295.83 and is only recently rebounding from a key $120 long‑term support zone that has acted as a major line in the sand for nearly two years. [10]

In other words: today’s rally is powerful, but it is happening inside a much larger, still‑corrective cycle.


Why Solana is up today: ETF flows, Franklin Templeton & Vanguard

Franklin Templeton’s Solana ETF clears final hurdle

A central narrative on December 3 is the approval of Franklin Templeton’s Solana ETF for trading on NYSE Arca, under the ticker SOEZ. [11]

CoinCentral’s analysis highlights several key points:

  • The Franklin Solana ETF listing makes it the seventh SOL ETF available to US investors.
  • Around the same time, Binance saw $2.12 billion in USDC inflows, while $1.11 billion worth of SOL left the exchange, creating what analysts describe as a “supply crunch” around the $120 support zone. [12]
  • Large buyer clusters were identified around $135 and $142, marking areas of heavy accumulation that now act as important resistance/interest zones for today’s price action. [13]

The combination of reduced exchange supply, new ETF access, and concentrated buying zones provides a strong structural backdrop for this week’s bounce.

Vanguard’s crypto pivot and ETF inflows into SOL

On top of Franklin’s ETF launch, Vanguard’s change of heart on crypto ETFs is being felt across the market:

  • Fortune reports that Vanguard, historically skeptical of crypto, has started listing Bitcoin and other crypto ETFs, opening the door to a broader set of retail and advisory accounts. [14]
  • Coinspeaker notes that Bitcoin, Solana and XRP all “exploded” higher in the past 24 hours as ETFs saw renewed inflows following Vanguard’s move. They cite Solana trading around $141.9, up roughly 12%, with about $79.5B in market cap and $7.86B in daily volume. [15]
  • Net Solana spot ETF inflows on December 2 are estimated around $45.77 million, led by Bitwise’s BSOL and Fidelity’s FSOL products, bringing total SOL ETF assets to roughly $930 million. [16]

Put simply: traditional finance is now providing a steady pipeline of demand for Solana exposure, and today’s price action reflects that shift.

Broader crypto tailwinds

The move in Solana is not happening in isolation:

  • ABP Live reports that the global crypto market cap is around $3.15 trillion, up about 7% in 24 hours, with Bitcoin trading above $93,000 and majors like Ethereum, XRP and Litecoin also sharply higher. [17]

A rising macro tide — driven by spot Bitcoin ETF inflows and renewed risk appetite — is lifting high‑beta altcoins like Solana alongside it.


On‑chain and derivatives data: is this rally “real”?

Several fresh analyses argue that today’s bounce is more than just a short squeeze.

ETF demand, futures positioning, and a double‑bottom

A detailed note from Mitrade on December 3 points to three reinforcing pillars behind today’s move: [18]

  1. ETF flows:
    • After a day of net outflows, Solana ETFs flipped back to a net inflow of $45.77 million on Tuesday, suggesting investors have gone from selling strength to buying dips.
  2. Derivatives market:
    • Solana futures open interest stands around $7.26 billion, up about 6.75% in the last 24 hours.
    • Rising open interest alongside rising prices typically indicates new long positions, not just shorts forced to close.
  3. On‑chain activity:
    • Total Value Locked (TVL) on Solana has climbed ~9.33% in 24 hours to about $9.0 billion.
    • Stablecoin liquidity on Solana is up more than 13% this week to roughly $15.18 billion.
    • Both metrics signal higher real usage across DeFi, trading and yield strategies.

Mitrade also emphasizes a potential double‑bottom pattern on the daily chart, with support near $126 and a neckline around $145. A decisive daily close above that region would strengthen the bullish case and open the door toward $158 (50‑day EMA) and $175 (200‑day EMA) as the next resistance zones. [19]

$17.93 billion “spike” in Solana activity

U.Today describes today’s action as the “most important breakthrough since October”, noting a roughly $17.93 billion spike in Solana‑related flows and activity that coincides with a sharp spot bid, structural support and a break in momentum. [20]

While methodologies differ between analytics providers, the common theme is that both market structure and on‑chain data are turning more supportive at the same time.


Technical picture: bulls vs bears at a critical zone

Short‑term bullish signals

Intraday technicals are leaning bullish:

  • Above key moving averages:
    • Crypto.News and Holder both note that Solana has reclaimed $135 and is trading above its 100‑hour simple moving average, after breaking through resistance near $132 and $135. [21]
  • Trendline break:
    • SOL recently broke above a bearish trendline around $138, a structure that had capped prior rebounds. [22]
  • Momentum indicators:
    • The hourly MACD is turning decisively positive, while the RSI sits above 50, indicating improving momentum and a shift away from oversold conditions. [23]

CoinEdition further reports that Solana has broken a multi‑week descending trendline, with futures open interest rising and net inflows turning positive, and now trades near $143 as buyers target the $149–$155 resistance zone. [24]

Key levels traders are watching

From today’s various technical breakdowns, the following levels stand out:

  • Immediate support:
    • $135 – reclaimed and now viewed as an important short‑term support. [25]
    • $126 – recent swing low and base of the potential double‑bottom. [26]
  • Immediate resistance:
    • $140–$142 – zone repeatedly flagged as the first resistance band; SOL is currently battling here. [27]
    • $145 – neckline of the double‑bottom; a close above here would be a strong bullish confirmation. [28]
  • Upside targets if bulls win:
    • $155–$158 – a cluster of targets from multiple analyses: CoinEdition’s “bulls eye $155” and Mitrade’s 50‑day EMA zone. [29]
    • $175–$180 – higher resistance area corresponding to the 200‑day EMA and former consolidation. [30]

The bearish counter‑argument: watch $120

Not every analyst is convinced that today’s bounce has ended the downtrend:

  • Pintu’s December 3 report stresses that SOL is still down ~57% from its ATH, and that the price recently tested the critical $120 horizontal support. [31]
  • Their weekly chart shows bearish divergences on RSI and MACD, with both indicators breaking trendlines and moving into negative territory.
  • If $120 fails, Pintu highlights a Fibonacci retracement support near $71–$72, implying another potential 40% downside from the current area in a worst‑case bearish scenario. [32]

From this perspective, today’s move might be a strong relief rally inside a larger corrective phase, unless the price can hold above $135 and decisively clear $145–$155.


Short‑term Solana price forecasts for December 2025

Algorithmic and exchange‑based models

Several quantitative models published around December 3 give a sense of how automated systems see SOL’s near‑term path:

  • Binance price‑prediction dashboard
    • Projects Solana around $142.60 on December 3–4, 2025, with only modest incremental gains over the next month (e.g. $143.17 by early January 2026). [33]
    • This implies a sideways‑to‑slightly‑upward bias rather than a runaway rally.
  • CoinCodex model
    • Sees Solana trading between roughly $142.74 and $143.49 this week, with potential to reach about $146.17 by December 15.
    • Over the next month, the algorithm expects a ~10% rise to around $157.15 by January 2, 2026. [34]
  • Changelly’s December 2025 forecast
    • Puts December’s expected range roughly between $126.69 and $139.29, with an average near $132.99 — a more cautious view that has already been overshot by today’s price action above $140. [35]

Taken together, short‑term models generally see SOL staying in a broad $130–$160 band through the end of the year, with upside scenarios concentrating around the mid‑$150s if the current breakout holds.


Longer‑term views: from cautious algorithms to hyper‑bullish analysts

Quantitative outlook to 2030

CoinCodex’s longer‑horizon forecasts sketch a measured but positive path:

  • For 2025, SOL is projected to trade between about $143 and $151, with roughly 6–7% upside to the upper target. [36]
  • For 2030, their range widens to $341–$418, implying nearly 200% upside from today if the upper band is reached. [37]
  • The model suggests $1,000 SOL might only be seen around 2049 in a best‑case scenario, and does not see any path to $10,000 within its forecast window. [38]

These numbers reflect a steady, compounding growth story, rather than an immediate moonshot.

Analyst and expert forecasts: $200…$1,000 and beyond

By contrast, human analyst forecasts span a much wider and more speculative range:

  • InvestingHaven aggregates 7 “reputable experts” and finds 2025 price targets between $200 and $1,000, with an average around $425, anchored on themes like:
    • ETF approval,
    • DeFi/NFT expansion, and
    • institutional adoption. [39]
  • Their own structured forecast for 2025 suggests a range of roughly $111–$425, with potential breakouts toward or above $300 if resistance near $260 is cleared and the current “cup‑and‑handle” style reversal pattern resolves higher. [40]

Separate commentary from Yahoo Finance has argued that Solana could be worth more than XRP by 2030, citing its high‑throughput architecture and fast‑growing developer ecosystem as key competitive strengths, though without committing to a single numerical target. [41]

The net takeaway: medium‑term expectations range from cautious to extremely bullish, and investors should treat all such forecasts as scenarios, not guarantees.


Sentiment: “buy” signals vs lingering skepticism

Sentiment across media today is notably mixed:

  • CryptoDnes highlights Solana and XRP flashing “major buy signals” as part of a broader risk‑on shift, describing a pattern of Tuesday recoveries and pointing to US investors turning net buyers again. [42]
  • CryptoNews and other “best crypto to buy now” round‑ups frequently include Solana as a high‑risk, high‑reward altcoin alongside Bitcoin and Ethereum. [43]
  • At the same time, Pintu’s highly bearish technical piece warns that the downtrend is not yet broken, and that a loss of $120 support could send SOL toward the $70 area. [44]
  • Earlier in November, Yahoo Finance reported that “smart money” kept accumulating Solana ETFs even after a 20% price drop, signaling institutional confidence in the long‑term story despite short‑term volatility. [45]

In short, today’s price spike is re‑igniting bullish narratives, but skeptical and risk‑focused analysis remains very much alive.


What could move Solana’s price next?

Over the coming days and weeks, traders and long‑term holders alike are likely to watch:

  1. ETF flows
    • Do Solana spot ETFs keep recording net inflows, or was yesterday’s $45m+ influx a one‑off? [46]
  2. Key price levels
    • Support: $135, then $126, and finally the crucial $120 zone.
    • Resistance: $145 (double‑bottom neckline), $155–$158 (50‑day EMA & short‑term target), then $175–$180 (200‑day EMA region). [47]
  3. On‑chain metrics
    • TVL growth,
    • stablecoin inflows, and
    • developer and user activity across DeFi, NFT, gaming and real‑world‑asset protocols.
  4. Macro crypto conditions
    • Bitcoin ETF flows,
    • changes in interest rates and risk sentiment, and
    • any new regulatory headlines around US or global crypto markets.
  5. Solana ecosystem and infrastructure news
    • Integrations like the Kalshi prediction market building on Solana, and new enterprise or TradFi partnerships, can add structural demand for SOL over time. [48]

Risk reminder

Solana’s move above $140 today is backed by real flows and improving metrics, but the asset remains:

  • highly volatile,
  • well below its all‑time high, and
  • subject to regulatory, technological and market risks.

Always remember:

This article is for informational and news purposes only and is not investment advice.
Cryptocurrency trading involves significant risk, and you should never invest money you cannot afford to lose.

References

1. coinmarketcap.com, 2. pintu.co.id, 3. coinmarketcap.com, 4. news.abplive.com, 5. coincentral.com, 6. www.mitrade.com, 7. coincodex.com, 8. coinmarketcap.com, 9. www.coingecko.com, 10. pintu.co.id, 11. coincentral.com, 12. coincentral.com, 13. coincentral.com, 14. fortune.com, 15. www.coinspeaker.com, 16. www.coinspeaker.com, 17. news.abplive.com, 18. www.mitrade.com, 19. www.mitrade.com, 20. u.today, 21. crypto.news, 22. holder.io, 23. crypto.news, 24. coinedition.com, 25. holder.io, 26. www.mitrade.com, 27. holder.io, 28. www.mitrade.com, 29. coinedition.com, 30. www.mitrade.com, 31. pintu.co.id, 32. pintu.co.id, 33. www.binance.com, 34. coincodex.com, 35. changelly.com, 36. coincodex.com, 37. coincodex.com, 38. coincodex.com, 39. investinghaven.com, 40. investinghaven.com, 41. finance.yahoo.com, 42. cryptodnes.bg, 43. cryptonews.com, 44. pintu.co.id, 45. finance.yahoo.com, 46. www.coinspeaker.com, 47. www.mitrade.com, 48. finance.yahoo.com

Source link

3 12, 2025

BNB coin price prediction as Yi He is named Binance co-CEO — TradingView News

By |2025-12-03T18:59:04+02:00December 3, 2025|Crypto News, News|0 Comments

The Binance Coin (BNB) price has surged 8.2% today, outpacing both its weekly and monthly trends, to trade at around $897.78 at press time.

BNB’s surge comes as Binance crypto exchange reshapes its executive structure, naming Yi He, the exchange’s co-founder, as Co-CEO alongside Richard Teng.

Binance leadership shift strengthens market sentiment

The appointment of Yi He as Binance CEO (Co-CEO) reinforces a succession strategy that has been forming since Changpeng Zhao (CZ) stepped down from day-to-day leadership in 2023.

Yi He, who previously worked with CZ at OKCoin before co-founding Binance in 2017, has long shaped the company’s culture, innovation pipeline, and user-first product design.

Her leadership across areas such as Binance Labs, Launchpad, Smart Chain, and the company’s charity programs has been central to the exchange’s identity.

In an official announcement made on X, Binance emphasised that Yi and Teng will guide its next phase with a dual focus: tightening global regulatory alignment and scaling adoption toward one billion users.

CZ publicly endorsed the move, remarking that Yi “should have been the Binance CEO from day one,” underscoring the depth of trust within the founding team.

Notably, CZ’s endorsement reflects confidence that the exchange’s leadership bench is strong enough to navigate increased regulatory scrutiny worldwide.

How the new governance structure is expected to boost Binance

The new leadership structure is designed to help Binance navigate global regulatory frameworks more efficiently.

Teng, known for his background in financial regulation, is expected to deepen compliance initiatives.

Yi will focus on driving product innovation and scaling the ecosystem through partnerships and user-focused initiatives.

Combined, the dual-CEO model aims to strengthen credibility at a time when institutional investors are paying closer attention to governance in the crypto industry.

BNB coin price analysis

As the Binance Coin responds to the leadership change at Binance, today’s price surge is also supported by broader market conditions.

A rebound across the crypto sector, fueled by expectations of a Federal Reserve rate cut and rising Bitcoin ETF inflows, has added liquidity to the altcoin market.

Bitcoin reclaiming the $93,000 region has also lifted correlated assets, and BNB, known historically as a high-beta altcoin, has benefited strongly from the shift in sentiment.

From a technical standpoint, the price of BNB today shows momentum building after the token broke above the 61.8% Fibonacci retracement at $906.11 before slightly pulling back.

In addition, BNB has formed a double-bottom pattern, a bullish structure signalling trend reversal.

The cryptocurrency has also broken out of a descending channel on the four-hour chart, reflecting improving strength on short-term timeframes.

Trading volume has risen as well, showing strong interest from investors who see the leadership transition as a stabilising development for the broader Binance ecosystem.

BNB price forecast: can Binance Coin sustain the rally?

Looking ahead, the BNB price forecast depends on how the market digests the leadership transition and upcoming macro events.

Staying above the immediate support at $879.52 could support a continued bullish momentum that could further push the BNB coin price toward the $1,054 region, according to some analysts, especially if FOMO accelerates after a clean breakout above $900.

A supportive Federal Reserve decision later this month may further boost liquidity and extend the rally.

Conversely, failure to hold above $879.52 could lead to a short-term pullback to the next support zone around $859.50, or even a deeper dive to the lows at $793.45.

Source link

3 12, 2025

MATIC Price Prediction: $0.45 Target by January 2026 Despite Current Bearish Momentum

By |2025-12-03T16:58:04+02:00December 3, 2025|Crypto News, News|0 Comments


Alvin Lang
Dec 03, 2025 08:01

MATIC price prediction points to $0.45 medium-term target despite trading at $0.38, with critical $0.58 resistance determining bullish continuation.


Polygon (MATIC) finds itself at a critical juncture as December 2025 unfolds, trading at $0.38 and showing signs of consolidation near multi-month lows. Our comprehensive MATIC price prediction analysis reveals a mixed technical picture that suggests moderate upside potential, contingent on breaking key resistance levels that have proven stubborn throughout the recent bearish cycle.

MATIC Price Prediction Summary

• MATIC short-term target (1 week): $0.40 (+5.3%)
• Polygon medium-term forecast (1 month): $0.42-$0.48 range
• Key level to break for bullish continuation: $0.58
• Critical support if bearish: $0.33

Recent Polygon Price Predictions from Analysts

Recent analyst consensus points to cautious optimism for MATIC’s price trajectory. Blockchain.News has consistently maintained medium-term targets between $0.42-$0.52 across multiple forecasts, with their latest Polygon forecast suggesting a $0.42-$0.48 range representing 11-26% upside potential from current levels.

The analytical community appears divided on timing but unified on the importance of the $0.58 resistance level. This critical threshold has emerged as the make-or-break point that will determine whether MATIC can mount a sustained recovery or remain range-bound. The consensus MATIC price prediction reflects moderate confidence levels, with most analysts acknowledging the challenging technical environment while recognizing oversold conditions that could fuel a bounce.

MATIC Technical Analysis: Setting Up for Consolidation Before Breakout

Current Polygon technical analysis reveals a cryptocurrency in transition, displaying characteristics of both oversold conditions and bearish momentum. The RSI reading of 38.00 positions MATIC in neutral territory, suggesting the selling pressure that drove the token down 70% from its 52-week high of $1.27 may be exhausting itself.

The MACD histogram at -0.0045 continues to flash bearish signals, but the narrowing momentum divergence hints at potential stabilization. More telling is MATIC’s position within the Bollinger Bands at 0.2879, indicating the price is trading in the lower portion of its recent range but not at extreme oversold levels that typically precede sharp reversals.

Volume analysis from Binance spot trading shows $1.07 million in 24-hour turnover, representing below-average participation that often characterizes consolidation phases. The daily ATR of $0.03 suggests relatively contained volatility, which could indicate accumulation by longer-term holders ahead of the next directional move.

Polygon Price Targets: Bull and Bear Scenarios

Bullish Case for MATIC

The optimistic MATIC price prediction scenario envisions a structured recovery that begins with reclaiming the $0.42 level (EMA 26), followed by a test of the $0.45-$0.48 resistance zone. This Polygon forecast aligns with the SMA 50 at $0.45, making it a natural profit-taking area for any sustained bounce.

For the bullish case to materialize, MATIC must first establish support above the current pivot point of $0.38, then demonstrate the ability to hold gains above the SMA 7 at $0.37. The critical MATIC price target remains $0.58, where breaking this level would signal a fundamental shift in market structure and potentially open the door to $0.70+ targets over the medium term.

Technical confirmation would come from RSI moving above 50, MACD histogram turning positive, and sustained volume above the recent average. The timeline for this scenario spans 4-6 weeks, requiring patience as MATIC works through overhead resistance.

Bearish Risk for Polygon

The downside MATIC price prediction centers on a break below the immediate support at $0.35, which would likely trigger stops and push the token toward the strong support zone at $0.33. This level represents approximately the 52-week low area and would constitute a significant technical failure.

A breakdown scenario would likely be accompanied by broader cryptocurrency market weakness and could see MATIC testing the $0.30 psychological level. The bearish case gains credibility if the RSI fails to hold above 35 or if the MACD histogram extends deeper into negative territory without signs of stabilization.

Risk factors include continued institutional selling pressure, broader market correction, or failure to demonstrate utility growth within the Polygon ecosystem. The timeline for bearish development would be more compressed, potentially playing out over 2-3 weeks.

Should You Buy MATIC Now? Entry Strategy

The current technical setup suggests a measured approach rather than aggressive accumulation. For those considering whether to buy or sell MATIC, the optimal entry strategy involves scaling into positions on any weakness toward the $0.35 support level, with initial stop-losses placed below $0.33.

Conservative traders should wait for confirmation above $0.40 before initiating positions, as this would suggest the immediate downtrend is breaking. More aggressive investors might consider dollar-cost averaging between $0.35-$0.38, recognizing the proximity to established support levels.

Position sizing should remain modest given the mixed technical signals, with no single entry representing more than 2-3% of portfolio allocation. The risk-reward profile favors patience, as the spread between current price and both upside targets ($0.45+) and downside risks ($0.33) provides reasonable asymmetry for disciplined entries.

MATIC Price Prediction Conclusion

Our comprehensive MATIC price prediction points to a $0.42-$0.48 target range over the next 4-6 weeks, representing 11-26% upside potential from current levels. This Polygon forecast carries medium confidence given the mixed technical signals and broader market uncertainty affecting cryptocurrency valuations.

The key indicators to monitor for confirmation include RSI movement above 45, MACD histogram stabilization, and most critically, price action around the $0.58 resistance level. Invalidation of the bullish thesis would come from a decisive break below $0.35 on sustained volume.

The timeline for this prediction extends through January 2026, with initial signals expected within 2-3 weeks as MATIC either confirms support at current levels or breaks down toward deeper oversold conditions. Traders should remain flexible and ready to adjust positions based on these key technical developments that will determine MATIC’s near-term trajectory.

Image source: Shutterstock


Source link

3 12, 2025

Dogecoin (DOGE) Price Prediction: Bitcoin Hyper (HYPER)

By |2025-12-03T14:57:03+02:00December 3, 2025|Crypto News, News|0 Comments

Dogecoin (DOGE) Price Prediction

Dogecoin (DOGE) is trading near $0.1445 after a 24-hour gain of about 5.44%, setting the stage for a focused DOGE outlook. Market data from CoinMarketCap and TradingView show modest upside inside a fragile structure, and analyst Ali Martinez highlights the critical $0.14 support level as a pivot for short-term risk.

This Dogecoin (DOGE) Price Prediction piece examines how technicals and social metrics support DOGE’s incumbent position even as new entrants press the market. PHOENIX and Crypto News & Analytics report that DOGE still leads in social engagement, which underpins investor confidence and liquidity.
At the same time, presale-driven projects and Bitcoin Hyper (https://bitcoinhyper.com/) adopt low entry prices and whitelist mechanics to pull capital and attention. The DOGE vs HYPER dynamic frames a broader debate over meme coin dominance, where structured presales and novel tokenomics can challenge legacy momentum.
The following section will detail price action, key supports and resistances, and technical indicators to shape a practical DOGE outlook for traders and investors.

Market snapshot and short-term technical outlook for Dogecoin (DOGE)

Dogecoin is showing mixed signals after a short uptick near $0.1445, with a 5.44% gain in the past 24 hours that points to renewed buying interest. The intraday rally sits against a daily structure of lower highs and lower lows on TradingView, so traders should treat gains with caution. Watching DOGE price action over the next few sessions will clarify whether buyers can change the trend.

Current price action and momentum

Short-term DOGE momentum has improved slightly, yet the broader trend remains bearish on the one-day chart. The $0.14 zone, highlighted by analyst Ali Martinez, has acted as a historic demand area. Recent slips below that level undermine bullish conviction and suggest sellers retain control until higher lows form on daily closes.

Key support and resistance levels to watch

The immediate support sits at $0.14, a key demand area that has been tested and briefly breached. If that level fails to hold, sequential downside targets include $0.13, $0.12, and $0.10. A much deeper structural floor near $0.07 serves as a longer-term backup if multiple supports cascade.

The nearest resistance is around $0.16, the zone DOGE previously failed to clear and the next meaningful supply area on any rebound. Price needs to reclaim $0.14-$0.16 and then produce higher highs to shift the bias back to buyers.

Technical indicators summary

Daily DOGE technical indicators keep the bias tilted to the downside. The RSI sits near 35, close to oversold territory but not yet signaling a clear reversal. The MACD remains below its signal line with negative histogram bars, showing persistent bearish pressure.

Taken together, DOGE RSI MACD and other indicators point to limited upside until price proves strength above key levels. Traders should monitor DOGE technical indicators and DOGE support resistance behavior to gauge whether momentum can flip from bearish to bullish.

Dogecoin (DOGE) Price Prediction

This part lays out clear directional scenarios for traders and holders. Use the next sections to compare downside and upside paths, with specific DOGE targets and guidance for position sizing and DOGE risk management.

Bearish scenario: extension of decline

If Dogecoin stays below $0.14 and keeps making lower highs and lower lows, expect an extension of the sell-off. A first sequence of stops sits near $0.13 and $0.12, with $0.10 acting as a historically significant pause zone on Ali Martinez’s roadmap.

Daily momentum indicators add weight to the downside view. The RSI close to the mid-30s and a negative MACD histogram suggest sellers remain in control until those readings turn.

Should multiple demand zones fail, deeper structural support near $0.07 could be tested over time. Traders should set DOGE risk management rules now, using smaller position sizes and tight stops to limit losses in a protracted decline.

Bullish scenario: rebound from support

A solid reclaim of $0.14 followed by a daily close above $0.16 would shift the edge toward buyers. That sequence would open a path back into the prior consolidation range and create short-term DOGE targets above $0.16.

Technical confirmation would come from RSI moving back above neutral and MACD turning positive. Renewed social interest and broader crypto strength could amplify that move as retail sentiment returns.

Active DOGE risk management remains important during a rebound. Trail stops and defined profit-taking levels help lock gains while the market tests new resistance zones.

Timeframe-based projections and risk considerations

Short-term (days to weeks): expect choppy action around $0.14-$0.16. A breakdown would set immediate DOGE targets near $0.13-$0.10. A reclaim would target $0.16 and above for follow-through moves.

Medium-term (weeks to months): the market’s ability to form higher lows will determine whether recovery holds. Failure to reestablish that structure raises the risk of deeper retracement toward $0.07 over an extended bear phase.

Key risks include technical breakdowns, broader crypto market shocks, and capital rotation into presale meme projects that draw speculative funding away from Dogecoin. Prudent DOGE risk management-position sizing, stop-loss orders, and scenario planning-helps protect capital across both bullish and bearish outcomes.

How Bitcoin Hyper (HYPER) and new meme coins challenge DOGE’s dominance

New meme projects are reshaping attention and capital flows in crypto. Bitcoin Hyper (HYPER) (https://bitcoinhyper.com/) and several presale-driven launches use staged distribution and marketing to capture retail interest. That pattern changes how traders discover upside and how narrative momentum forms around tokens.

Competition from HYPER and presale-driven projects

Structured presales create urgency with whitelists, staggered pricing, and limited allocation. These mechanics help presale tokens push a concentrated bid into the market during initial listing. The Apeing presale model shows how a $0.0001 entry price plus staged rounds can attract many small buyers seeking first-mover advantages.

That approach contrasts with Dogecoin’s looser issuance and grassroots marketing. Presale mechanics can compress demand and produce fast price discovery, drawing speculative capital away from established coins in short bursts.

Social activity and community influence

Social leadership still matters. Dogecoin’s brand and large user base keep it highly visible across platforms. Recent reports showed DOGE leading meme coin social metrics with intense posting and interactions that sustain retail flow and headlines.

At the same time, smaller projects can concentrate narrative building within tight communities. Projects that drive viral threads and coordinated posting often convert social momentum into rapid trading volume. That dynamic fragments attention and fuels meme coin competition for new entrants and capital.

Structural advantages vs. novel tokenomics

Dogecoin’s advantages include deep brand recognition, practical tipping use cases, and a broad social footprint. Those features support steady retail interest and long-term awareness.

Novel tokenomics and presale setups offer engineered scarcity and clearer early-stage upside. Investors facing HYPER (https://bitcoinhyper.com/) vs DOGE must weigh brand stability against the high-risk, high-reward narratives of presale tokens. Presale tokens can deliver outsized short-term returns but carry concentrated risk compared with Dogecoin’s established ecosystem.

Implications for investors and trading strategies in the evolving meme-coin landscape

Investors should treat DOGE trading strategy as a mix of technical discipline and position sizing. Monitor the immediate pivot at $0.14: a daily close below it raises downside targets toward $0.13-$0.10 and possibly $0.07, while reclaiming $0.16 with higher-lows supports bullish setups. Use RSI and MACD with price structure to time entries; current momentum readings near RSI 35 and a negative MACD warrant caution before committing larger capital.

Risk controls are essential given meme coin investment volatility. Apply strict DOGE risk management with clear stop-losses and modest position sizes for newly launched tokens. For presale investment risks, limit exposure to a small, predefined percentage of capital and treat whitelist deals as high-risk, high-reward plays rather than core holdings. This keeps drawdowns manageable while preserving upside participation.

Watch capital rotation into presale-driven projects like Apeing and similar low-entry tokens that can siphon social momentum from Dogecoin. Track social metrics and on-chain activity as early indicators of retail flows; Dogecoin’s large engagement remains a stabilizing factor but can be outpaced by concentrated presale hype. Blend technical signals with sentiment to refine timing and avoid chasing narratives.

For longer-term portfolios, balance crypto portfolio allocation between established meme assets and speculative stakes. Allocate larger conviction to established tokens only when fundamentals and technicals align, and reserve small, controlled bets for presales. This approach preserves exposure to upside while maintaining prudent DOGE risk management and overall capital protection.

Buchenweg 15, Karlsruhe, Germany

For more information about Bitcoin Hyper (HYPER) visit the links below:

Website: https://bitcoinhyper.com/

Whitepaper: https://bitcoinhyper.com/assets/documents/whitepaper.pdf

Telegram: https://t.me/btchyperz

Twitter/X: https://x.com/BTC_Hyper2

Disclosure: Crypto is a high-risk asset class. This article is provided for informational purposes and does not constitute investment advice.

CryptoTimes24 is a digital media and analytics platform dedicated to providing timely, accurate, and insightful information about the cryptocurrency and blockchain industry. The enterprise focuses on delivering high-quality news coverage, market analysis, project reviews, and educational resources for both investors and enthusiasts. By combining data-driven journalism with expert commentary, CryptoTimes24 aims to become a trusted global source for emerging trends in decentralized finance (DeFi), NFTs, Web3 technologies, and digital asset markets.

This release was published on openPR.

Source link

3 12, 2025

Can Cardano Rebound or Will

By |2025-12-03T12:56:02+02:00December 3, 2025|Crypto News, News|0 Comments

The crypto market is approaching a tight moment as traders observe how altcoins behave going into the final stretch of the year. Cardano Prediction conversations have begun again, and many crypto investors are following if ADA can stabilize after recent dip.

Market sentiment across digital assets remains mixed, yet several projects continue gaining attention for real progress. One of the names surfacing in crypto news is Remittix, which recently expanded its ecosystem and pushed new updates that position it as a strong competitor in the search for the best crypto to buy now.

Cardano Market Outlook for December

Cardano trades at $0.3997 after posting a 5.33% rise, although trading volume has dropped 28.79% to $587.7 million. ADA still faces resistance zones that shape the December Cardano Price Prediction outlook.

A recent market update https://coinmarketcap.com/community/post/371545140 highlighted ADA’s behavior on the lower timeframes, noting its price movement near a critical support zone and how this structure could determine the next move.

According to the analyst breakdown shared on Finora Telegram, ADA is hovering around $0.3876 with key resistance at $0.3937.

If that level rejects, the token may revisit lower zones, but a clean breakout could push it toward $0.4114 or $0.4274.

These levels matter because the broader crypto market is showing fragmented strength across altcoins. Traders are also looking at new altcoin to watch narratives that could outperform top crypto under $1 assets.

With on-chain activity and liquidity shifting frequently, ADA needs stronger market sentiment and clearer buying pressure to rebuild momentum through December. This makes the Cardano Price Prediction outlook more tactical than directional, especially as volatility remains high.

December Catalysts and Technical Factors

The December setup focuses largely on short-term reactions to support and how quickly buyers regain control. Cardano’s technical structure shows mixed signals, and its performance will depend on how the crypto market processes the recent shifts in liquidity and demand.

Crypto trends this month indicate selective accumulation rather than broad buying patterns, and that keeps ADA in a cautious zone heading into 2026.

Major Remittix Update Gains Attention

As traders review December setups https://x.com/remittix/status/1989646857090523423, Remittix https://remittix.io has gained significant visibility after a long list of updates that strengthen its position among digital assets. The Remittix token is priced at $0.119, with more than $28.4 million raised from private funding and over 692.6 million tokens sold.

The project achieved a milestone by launching the Remittix Wallet on the Apple App Store https://x.com/remittix/status/1989646857090523423, allowing users to store and manage assets while preparing for upcoming crypto-to-fiat features. Android rollout is already underway, and the December update will introduce more functions that expand its PayFi system.

Remittix is also verified by CertiK https://skynet.certik.com/projects/remittix-labs, with the team fully KYC-approved and the project ranked number one in pre-launch tokens. You can verify this through the CertiK Audit and Team KYC pages. The community has also seen the beta wallet in action through the shared wallet demo, showcasing real progress rarely seen in early-stage crypto projects.

Key Remittix Highlights

● Wallet live on App Store with Android next

● Full CertiK verification building global trust

● Private funding raised above $28.4 million

● Beta Program open to Top 10 purchasers weekly

● $250,000 Giveaway boosting community activity

Future listings on BitMart and LBank have already been confirmed as part of upcoming CEX integrations. The project is also nearing the $30 million mark, which will unlock a major listing reveal.

A December Shift Worth Watching

The final Cardano price prediction question for December is whether ADA can reclaim higher levels or if stronger competitors gain more traction. With Remittix advancing rapidly and building real-world utility, ADA faces pressure to deliver more visible progress within the crypto market.

This month could shape how investors compare established altcoins with newer, fast-moving projects viewed as some of the best crypto to buy now.

Discover the future of PayFi with Remittix by checking out their project here:

Website: https://remittix.io/

Socials: https://linktr.ee/remittix

$250,000 Giveaway: https://gleam.io/competitions/nz84L-250000-remittix-giveaway

Frequently Asked Questions

1. Is Cardano still a strong asset for long-term holders?

ADA remains a relevant cryptocurrency due to its smart contract features, strong community, and steady development, but short-term movements depend heavily on market sentiment.

2. What affects Cardano Price Prediction for December?

Technical reactions near support, trading volume, and broader crypto market conditions shape ADA’s December outlook.

3. Which crypto projects are considered strong competitors right now?

Projects with active development, audits, and real utility like Remittix often gain more attention from crypto investors.

4. How do I identify promising new altcoin to watch opportunities?

Look for projects releasing products early, providing clear utility, and maintaining transparency through audits or public testing.

5. What role does liquidity play in crypto market performance?

High liquidity on CEX and DEX platforms helps stabilize price movements and attracts larger trading interest across digital assets.

Disclaimer: This article is for informational purposes only and does not constitute financial advice. Cryptocurrency investments carry risk, including total loss of capital. Readers should conduct independent research and consult licensed advisors before making any financial decisions.

Crypto Press Release Distribution by https://btcpresswire.com

This release was published on openPR.

Source link

3 12, 2025

Why is Solana price rallying today?

By |2025-12-03T08:54:08+02:00December 3, 2025|Crypto News, News|0 Comments

Solana (SOL) trades above $140 by press time on Wednesday, up over 10% in the last 24 hours as Vanguard offers crypto Exchange Traded Funds (ETFs), including Solana ETFs. The sudden recovery boosts risk-on sentiment in Solana derivatives as investors anticipate further gains. Technically, the outlook for Solana centers on a potential double-bottom breakout targeting the 50-day Exponential Moving Average (EMA).

Demand is back for Solana on all levels

Vanguard’s crypto-focused ETFs, including Bitcoin (BTC), Ethereum (ETH), Solana (SOL), and Ripple (XRP), are heating up the cryptocurrency market. Solana is experiencing a renewal in institutional demand with a net inflow of $45.77 million on Tuesday, flipping up from a net outflow of $13.55 million on Monday. Typically, an increase in ETF inflows signals better odds of further recovery and boosts investor confidence. 

Solana ETFs data. Source: Sosovalue.

In line with institutional demand, Solana derivatives experience a rise in risk exposure as investors bet on further recovery. CoinGlass data shows that Solana futures Open Interest (OI) stands at $7.26 billion, up 6.75% over the last 24 hours, reflecting an increase in capital at risk. 

Solana derivatives data. Source: CoinGlass.

On a more positive note, on-chain data shows an increase in Solana adoption, with its Total Value Locked (TVL) rising 9.33% in the last 24 hours to $9.013 billion. A surge in TVL reflects increased user deposits on the blockchain, signaling greater activity and adoption.

Additionally, the stablecoin liquidity on Solana has increased by over 13% in the last week to $15.181 billion. 

Solana DeFi metrics. Source: DeFiLlama.

Technical outlook: Is Solana ready for a breakthrough?

Solana bounced off the $126 support, which has remained intact since the June 22 low and avoided a daily close beneath it. The rebound also forms a double-bottom pattern with a neckline near $145, close to the November 20 high.

If SOL confirms a daily close above $145, it could extend the rally to the 50-day EMA at $158, followed by the 200-day EMA at $175. 

The Relative Strength Index (RSI) at 48 on the daily chart shows a steady rise from oversold levels, indicating a sharp decline in bearish pressure. At the same time, the Moving Average Convergence Divergence (MACD) shows steady recovery within the negative territory. 

SOL/USDT daily logarithmic chart.

On the flip side, a reversal from $145 could shift Solana into a consolidation phase with the lower band at $126.

Source link

Go to Top