The main tag of Crypto News Articles.
You can use the search box below to find what you need.
[wd_asp id=1]
1
12, 2025

Why XRP Is Going Down Today? XRP Price Sees Its Sharpest Drop in a Month and Could Fall Another 20%
XRP price
is falling during today’s (Monday’s) session, December 1, 2025 session most
strongly in a month, plunging 7% and establishing session minimums at $2.01
level. At the moment of writing these words, quotations have rebounded slightly
to around $2.04, which still involves a strong one-day decline.
As visible
on the chart I attached, the move came after the cryptocurrency for several
sessions could not cope with resistance in the range of $2.19-$2.29, which
until recently constituted a support zone.
In this
article I examine why XRP price is going down today and analyze the XRP/USDT chart,
based on my 10-years’ experience as an analyst and trader.
The supply
pin bar generated last Friday, a candle with a long lower wick and a short body,
was a signal that demand is not able to overcome this zone and supply may
return to control, which is exactly what we’re seeing at this moment. According
to my technical analysis, the breakdown open doors to much lowers levels.
Joel
Kruger, crypto strategist at LMAX Group, explains the broader context:
“Crypto markets enter Monday on the back foot, with bitcoin and ether
sliding further as the broader digital-asset complex struggles to regain
footing after a sharp multi-week drawdown.”
The first
target level for declines at a short distance is around $1.90 where
depreciation stopped at the end of last month.
Why XRP price is going down today? Source: Tradingview.com
XRP Critical Technical
Levels
|
Key Level |
Price |
Technical Significance |
|
Current Price |
$2.05 |
Monday |
|
Session Low |
$2.01 |
Intraday minimum, technical breakdown |
|
Failed Resistance |
$2.19-$2.29 |
Multiple |
|
First Target |
$1.90 |
End |
|
My Medium Target |
$1.61 |
April 2025 levels, Fibonacci analysis |
|
My Long Target |
$1.25 |
Year ago |
Generally
in my medium-term and long-term analysis, I see targets decidedly lower: first
looking at $1.61, April levels, ultimately at the $1.25 level, levels observed
over a year ago, which results from Fibonacci extension analysis.
I remind
simultaneously that on the XRP chart officially a bearish trend dominates, as
we’re moving below key moving averages and above all below the 200-day
exponential moving average (200 EMA). Two averages I track, the 50 EMA and 200
EMA, also crossed in last month, which created the so-called death cross, a
very strong bearish signal, which supports my bearish narrative.
Why XRP Price Is Going
Down Today?
Why is XRP
dropping in price so dramatically on Monday? Multiple factors converged to
trigger the 7% plunge. Kruger notes that “sentiment has been hit not only
by the October liquidation cascade but also by growing disappointment that
bitcoin failed to hold the psychologically important $100,000 level, a breach
that has damaged confidence.”
Why XRP Is Falling: Key
Bearish Factors
- Resistance failure: Multiple sessions unable
to break $2.19-$2.29 zone (former support) - Supply pin bar: Friday’s long lower wick
signaled demand exhaustion, supply control - Institutional selling: Large holders
overpowering $640M ETF inflows per CoinDesk - Bitcoin weakness: BTC failure at $100K
“damaged confidence” across altcoins - Death cross confirmed: 50 EMA below 200 EMA last
month, strong bearish signal - November -18%: Down 18% past month
despite historical December strength - Sell-the-news: ETF launches treated as
selling opportunities, not buying catalysts - Leverage unwind: Substantial capital
exiting within 12-hour period per market data
Kruger adds
that “this has compounded frustration among traders who had leaned heavily
on seasonal trend analysis pointing to a historically strong Q4, a pattern that
has clearly not materialized this year.”[provided quote]
Fed Rate Cut Hope: XRP Dip
Could Be “Short Lived”
Despite the
technical breakdown, some analysts see the decline as a buying opportunity.
Simon Peters, crypto analyst at eToro, offers a contrarian perspective:
“The dip could be short lived however, as markets have been gaining
momentum recently due to the odds of a rate cut at December’s FOMC meeting
increasing significantly in the last week.”
Peters
notes that “traders and investors are now pricing in more than an 85%
chance of the Fed lowering the target rate by 25 basis points on 10th
December.”[provided quote] This dovish pivot could provide support for
risk assets including XRP if it materializes as expected.
XRP Price Prediction:
Bearish Targets vs Analyst Optimism
Standard
Chartered, one of the world’s leading banking institutions, presented an
ambitious forecast earlier in 2025 predicting XRP could soar to $5.50 by
year-end. This price, which would mark a new all-time high for the altcoin,
represents a 168% increase from today’s $2.05 level.
Looking
further ahead, Standard Chartered suggests these gains would continue into
2028. “According to the investment bank, XRP price has the potential to reach
$12.50 by the end of 2028,” which would mark a 509% rise from the
current $2.05 price.
Former
Goldman Sachs analyst Dom Kwok sparked intense debate with his audacious
XRP price prediction of $1,000 by 2030, representing a staggering 48,680% surge
from current $2.05 levels.
More
conservative near-term targets from technical analysis suggest $4.50-$5.50 over
the next 6-12 months using Fibonacci extensions, with the upper $5.50 target
representing a 120% gain from current levels, still far exceeding most
mainstream forecasts yet remaining exponentially below Kwok’s $1,000
projection.
Renowned
market analyst Crypto Bull suggests XRP is primed for a major breakout after
completing the classic cup-and-handle pattern, “one of crypto’s most
reliable bullish signals, often preceding explosive rallies when backed by
strong volume.”
The Divergence: $1.25 to
$1,000
The
extraordinary gap between forecasts illustrates the polarized sentiment
surrounding XRP
- Ultra-Bearish$1.90
→ $1.61 → $1.25 from Fibonacci extensions, death cross, resistance failure - Moderately Bullish (Standard Chartered 2025): $5.50
year-end, $12.50 by 2028 - Very Bullish (Crypto Bull): $7 cup & handle target
- Extremely Bullish (Bank Adoption Model): $33 with major institutional usage
- Ultra-Bullish (Dom Kwok/Ex-Goldman): $1,000 by 2030
Before you leave, please also check my previous XRP price predictions’ articles:
How Low Can XRP Go? Expert Predicts 55% XRP Price Slump to Just $1
Why XRP Is Going Down? Crypto Falls Today With Bitcoin and Could Drop 50% According to This New XRP Price Prediction
XRP Price Analysis, Frequently
Asked Questions
Why is XRP dropping in
price?
XRP dropped
7% to $2.05 Monday December 1 (biggest decline in month) after failing to break
$2.19-$2.29 resistance over multiple sessions. Friday supply pin bar (long
lower wick, short body) signaled demand exhaustion and supply returning to
control.
Is XRP going to go up
again?
The outlook
is mixed. Bearish view: My analysis targets $1.90 then $1.61/$1.25 from
Fibonacci extensions, CoinDesk sees move to $1.80, death cross and below 200
EMA confirm downtrend, November -18% despite historical December strength.
Bullish case: Simon Peters (eToro) says “dip could be short lived”
with Fed 85%+ Dec 10 cut odds.
Who owns 80% of XRP?
Ripple Labs
controls majority of XRP supply through escrow system. While exact current
percentage varies, Ripple historically held over 50 billion XRP (more than half
of 100 billion total supply) in escrow, releasing up to 1 billion monthly for
operational expenses and ecosystem development, though often returning unsold
portions.
Can XRP reach $100 after a
lawsuit?
Reaching
$100 would require $5+ trillion market capitalization (assuming 50B+
circulating supply), making it larger than Apple or Microsoft, which is
extremely unlikely in foreseeable future.


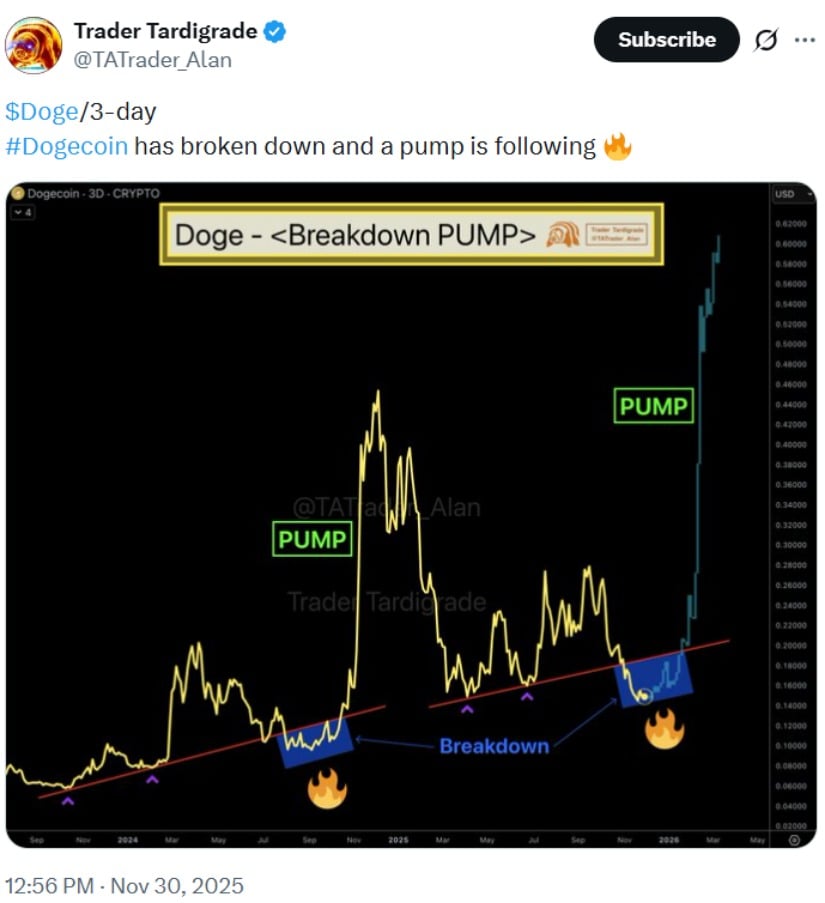
 Price Prediction: Dogecoin’s Triple Accumulation Pattern Hints at a Possible Surge Toward alt=")