Ripple (XRP) is trading in a narrow range, with support at $2.15 and resistance at $2.30 at the time of writing on Friday. For four consecutive days, the cross-border remittance token has remained in this narrow range, suggesting a battle for control between the bulls and the bears.
Dogecoin (DOGE) is trading at $0.1525 at the time of writing on Friday, as bears tighten their grip. Demand for Dogecoin has remained significantly suppressed since the October 10 flash crash, which liquidated over $19 billion in crypto assets on a single day.
Bitcoin (BTC), Ethereum (ETH) and Ripple (XRP) are struggling to sustain their recovery on Friday, reflecting a sticky bearish sentiment. Since the October 10 flash crash, which liquidated over $19 billion in crypto assets in a single day, retail interest in crypto assets has been significantly suppressed.
Risk Warning: this article represents only the author’s views and is for reference only. It does not constitute investment advice or financial guidance, nor does it represent the stance of the Markets.com platform.When considering shares, indices, forex (foreign exchange) and commodities for trading and price predictions, remember that trading CFDs involves a significant degree of risk and could result in capital loss.Past performance is not indicative of any future results. This information is provided for informative purposes only and should not be construed to be investment advice. Trading cryptocurrency CFDs and spread bets is restricted for all UK retail clients.
XRP price prediction has returned to center stage after the token’s roller-coaster year, with traders now trying to judge whether the latest rally can turn into a sustained breakout. At the time of writing, XRP is trading close to $2.20 with a market capitalization in the low $130 billion range, recovering strongly from last year’s lows but still sitting below the highs recorded earlier in 2025. According to live XRP data on CoinMarketCap (https://coinmarketcap.com/currencies/xrp/), 24-hour trading volumes remain elevated, reflecting renewed interest following the end of Ripple’s long-running legal battle with the U.S. Securities and Exchange Commission and the arrival of new XRP exchange-traded funds on Wall Street.
Legal Clarity And XRP ETF Launches Shift The Narrative
The conclusion of the SEC’s lawsuit against Ripple in August 2025, which saw the company accept a $125 million civil penalty while gaining clarity that XRP traded on public exchanges is not a security, has removed one of the biggest overhangs from earlier XRP price prediction models. At the same time, spot XRP ETFs from issuers such as Franklin Templeton and Grayscale have begun trading in the U.S., attracting nine-figure inflows in their first sessions and helping push XRP back above the key $2 level. Price charts on CoinGecko (https://www.coingecko.com/en/coins/xrp) show that XRP has spent recent weeks consolidating in a wide range between roughly $1.90 and $2.40, a pattern that analysts say could either resolve in a renewed push toward the previous cycle high or in another sharp correction if macro sentiment turns.
Short-term XRP price predictions for late 2025 generally cluster in a moderate range, with several research desks forecasting that the token could finish the year between about $2.50 and $3.20 if current momentum holds. One widely cited outlook from an exchange-backed research team sees XRP averaging around $2.60 in 2025 and expanding toward the $3.40-$4.50 band in 2026 as institutional usage of Ripple’s cross-border payment rails grows. By contrast, scenario modeling from China’s DeepSeek AI points to a much wider cone of outcomes, suggesting XRP could revisit $1 in a bearish case or spike toward $10 in a strongly bullish environment, underlining just how sensitive any XRP price prediction remains to ETF flows, Federal Reserve interest-rate decisions and overall risk appetite.
Key Technical Levels To Watch For The Next XRP Move
From a charting perspective, technicians note that XRP has already cleared several major resistance zones that capped rallies in previous years, but now faces a dense band of historical supply between roughly $3.00 and its recent seven-year high near $3.65, printed in July after Ripple’s courtroom victory. Some analysts argue that a decisive weekly close above that region could open the door to targets in the $5-$8 area over the next one to two years, particularly if inflows into XRP ETFs remain strong and Ripple continues signing cross-border payment partnerships. Others are more cautious, warning that a break back below $2 could trigger a deeper retracement toward $1.50 or even $1, especially if broader crypto markets stumble or bond yields spike again, reminding traders that even blue-chip altcoins can experience rapid double-digit swings.
Fundamentals Behind The Long-Term XRP Price Prediction
Beyond pure price action, fundamentals continue to play a central role in how analysts frame their XRP price prediction ranges. Ripple’s On-Demand Liquidity and other payment solutions are now running pilots or production flows with banks and fintech firms across regions such as Europe, the Middle East and Asia, with settlement times and fees often measured in seconds and fractions of a cent. At the same time, the XRP Ledger community is pushing ahead with upgrades around EVM-compatible sidechains, tokenization and DeFi tooling, developments that could expand XRP’s role beyond cross-border remittances alone. Supporters say that if this mix of institutional adoption and on-chain innovation continues, it could justify higher long-term valuation bands, even if the token remains volatile over shorter time frames.
Where Pepenode Fits Into The XRP Price Prediction Conversation
Against this backdrop, some market commentators are now pairing their XRP price prediction work with analysis of high-beta altcoins that could outperform if the broader trend remains positive. One project frequently mentioned in that context is Pepenode (https://pepenode.io/), a meme-themed “mine-to-earn” ecosystem where users build virtual server rooms filled with digital nodes instead of deploying real-world mining hardware. The platform’s design allows participants to allocate PEPENODE tokens to upgrade their simulated rigs and compete on leaderboards, with rewards linked to activity across a basket of meme coins rather than a single asset. Because the project sits at the intersection of gaming, mining narratives and meme culture, it has started to appear in the same headlines as XRP whenever analysts discuss speculative side bets for the next phase of the crypto cycle.
Comparing XRP’s Risk Profile With Pepenode’s Speculative Upside
Dedicated Pepenode price forecasts are, unsurprisingly, far more aggressive than most mainstream XRP price prediction ranges. One recent analytical note on the project suggests that PEPENODE could reach around $0.005 in 2025 and potentially climb above $0.10 by 2030 if its gamified mining model gains sustained traction, projections that imply multiples of several hundred percent from current micro-cap levels. While such targets highlight why Pepenode (https://pepenode.io/) is being framed as a high-risk, high-reward complement to large-cap assets like XRP, they also underline the speculative nature of the trade: the token’s future path depends on successful game rollout, exchange liquidity and ongoing community engagement, factors that can change rapidly in the meme-coin segment.
Outlook: XRP Price Prediction And High-Beta Meme Coin Themes
For now, the clearest takeaway for traders following XRP price prediction headlines is that the token has finally moved beyond its regulatory limbo and into a new phase driven by ETF adoption, macro conditions and real-world payments growth, even as technical analysts debate whether $2 will hold as a durable support zone. In parallel, smaller plays such as Pepenode continue to capture attention as leveraged expressions of risk-on sentiment in the meme-coin space, capable of amplifying both gains and losses. As always in crypto, all of these projections remain speculative, and observers stress that anyone considering exposure to XRP or emerging altcoins should treat third-party forecasts as informational only, combine them with independent research and personal risk management, and be prepared for outcomes that could diverge sharply from even the most carefully modeled predictions.
Buchenweg 15, Karlsruhe, Germany
For more information about Pepenode (PEPENODE) visit the links below:
Disclosure: Crypto is a high-risk asset class. This article is provided for informational purposes and does not constitute investment advice.
CryptoTimes24 is a digital media and analytics platform dedicated to providing timely, accurate, and insightful information about the cryptocurrency and blockchain industry. The enterprise focuses on delivering high-quality news coverage, market analysis, project reviews, and educational resources for both investors and enthusiasts. By combining data-driven journalism with expert commentary, CryptoTimes24 aims to become a trusted global source for emerging trends in decentralized finance (DeFi), NFTs, Web3 technologies, and digital asset markets.
Dogecoin Price Prediction (https://coinmarketcap.com/currencies/dogecoin/) sounds simple as long as the market keeps delivering clear trends, but once everything slows down and every move becomes a test of patience, the outlook changes completely. Lately DOGE has been trading more like a slow negotiation between patient buyers and exhausted sellers, with volume coming in short bursts instead of one big panic candle. In that environment, any honest Dogecoin Price Prediction shifts toward questions of liquidity, market structure, and resilience. At the same time, Pepenode (https://pepenode.io/) is quietly showing up in the same discussions as a fresher, smaller meme option for traders who want extra volatility without walking away from DOGE entirely.
From Hype To Habits: How Traders Now Look At DOGE
Across the bigger coins the mood has shifted from full risk panic into a more mixed phase where people still respect downside yet are willing to test new positions if conditions are not completely hostile. That matters for Dogecoin because the coin feeds on narrative, but it survives on the boring mechanics of how orders actually clear across exchanges during busy overlaps between European and United States trading hours. Larger desks talk less about jokes and more about whether spreads stay tight, whether depth holds when aggressive orders arrive and whether the current Dogecoin Price Prediction still makes sense once those day to day habits are taken seriously.
Dogecoin Price Prediction In A Market That Refuses To Trend Cleanly
One of the awkward parts of building any Dogecoin Price Prediction right now is that the broader market does not seem interested in giving anyone a straight line to work with. Majors rotate between cautious optimism and fast risk cuts, while altcoin liquidity appears and disappears like a tide that does not follow a simple schedule. For DOGE this usually means long stretches of sideways movement where only the most patient scalpers are active, interrupted by sudden bursts that punish traders who fell asleep on their risk limits. Instead of simple up or down calls, many teams sketch out conditional paths that depend on how those choppy windows play out.
Signals Hiding Behind The Dogecoin Ticker
Desks that still allocate time to Dogecoin rarely stare only at the price line any more, they track a whole cluster of background signals that shape their conviction. Some of them watch whether spot markets start to move before derivatives, whether open interest grows in a healthy way or simply spikes around obvious headlines and whether funding data suggests overcrowded long or short positioning. Others lean on educational sources such as Binance Academy and similar explainers to keep newer traders grounded in what DOGE (https://www.binance.com/en/academy/articles/what-is-dogecoin) actually represents on chain. Those details may not sound exciting, yet they often decide whether a Dogecoin Price Prediction survives more than one news cycle.
Key Zones That Quietly Anchor The DOGE Conversation
Even when chart layouts differ, many teams end up watching similar regions on the Dogecoin chart because history keeps dragging attention back to the same places. Under current price sits a support band that has been tapped several times without giving way completely, which some traders treat as the level that needs to hold if the constructive Dogecoin Price Prediction is going to remain believable. Higher up sits a messy cluster of old supply, trapped longs and prior failures that acts like a ceiling until proven otherwise. Between those two areas a lot of intraday action amounts to noise, so many desks simply wait for clean reactions before making any changes to size.
Pepenode As A Parallel Bet On Meme Risk
While DOGE keeps its place as the veteran meme asset, Pepenode (https://pepenode.io/) is starting to show up in notes from desks that like to keep one eye on newer narratives without going all in on untested experiments. People who already run a core Dogecoin position sometimes treat Pepenode as a smaller satellite, a way to express belief in another meme driven community while still anchoring most exposure in the more liquid name. Attention around the official site reflects that cautious interest, with traders reading through token distribution, roadmap hints and communication habits before deciding whether Pepenode deserves a place next to any Dogecoin Price Prediction they are currently using.
What Makes The Pepenode Story Feel Different To Some Desks
For a new meme project to get mentioned in the same breath as DOGE, it usually needs something other than loud slogans and temporary social buzz, and that is where Pepenode has quietly started to build a small case. Some early observers note that messaging so far has focused more on pacing, community rhythm and realistic expectations than on instant riches, which tends to sit better with desks that have been burned by earlier hype cycles. Liquidity is still developing, spreads are not always perfect and volume can be patchy, yet for traders who enjoy spotting stories earlier than the crowd those imperfections are part of the opportunity rather than an immediate disqualifier.
Risk Management When Splitting Size Between DOGE And Pepenode
Traders who handle both Dogecoin and Pepenode usually accept that one of the few variables they can genuinely control is position sizing, so they build their process around that dull but critical point. Before entering they write down the level that would prove a given Dogecoin Price Prediction wrong and then apply the same logic to any Pepenode idea, making sure that both stops together still leave room to breathe if the whole meme complex wobbles. Adds tend to happen after pullbacks into predefined regions instead of on candles that already scream exhaustion, while partial profit taking is used not as a victory lap but as a way to keep accounts steady enough to participate in the next setup.
Signals That Can Break A Dogecoin Price Prediction In Hours
Even the most careful Dogecoin Price Prediction can unravel in a single difficult session when larger forces line up the wrong way, so traders watch for a handful of warning signs that usually deserve immediate respect. A sharp liquidity drain in Bitcoin or Ethereum often bleeds straight into meme names, especially when books are already thin after a period of complacency. Exchange outages, sudden rule changes or security scares can freeze risk appetite within minutes, leaving both DOGE and Pepenode hunting for bids in places that looked safe a day earlier. Some desks also monitor on chain activity, and when usage slides while leverage metrics stay hot, they often respond by cutting meme exposure faster than usual.
Why Some Traders Keep Coming Back To DOGE And Pepenode
Despite the stress, a certain type of trader keeps returning to Dogecoin and now increasingly glances at Pepenode (https://pepenode.io/), not because they expect straight line gains but because they see repeatable structure inside the chaos. A simple routine helps, for example checking DOGE only at fixed times, refreshing key levels once per week and reviewing whether the current Dogecoin Price Prediction still matches what the market is actually doing. Pepenode then sits on a nearby watchlist as a high beta companion, granted a smaller allocation yet monitored with the same discipline. That kind of measured approach may not look flashy, but over multiple cycles it tends to outlast the louder strategies that burn out on the first real drawdown.
Buchenweg 15, Karlsruhe, Germany
For more information about Pepenode (PEPENODE) visit the links below:
Disclosure: Crypto is a high-risk asset class. This article is provided for informational purposes and does not constitute investment advice.
CryptoTimes24 is a digital media and analytics platform dedicated to providing timely, accurate, and insightful information about the cryptocurrency and blockchain industry. The enterprise focuses on delivering high-quality news coverage, market analysis, project reviews, and educational resources for both investors and enthusiasts. By combining data-driven journalism with expert commentary, CryptoTimes24 aims to become a trusted global source for emerging trends in decentralized finance (DeFi), NFTs, Web3 technologies, and digital asset markets.
ADA price prediction points to $0.77 target by December 2025 as Cardano recovers from oversold conditions with bullish MACD momentum emerging at current $0.43 levels.
Cardano (ADA) is currently trading at $0.43, showing early signs of recovery from oversold conditions that have dominated the recent price action. With multiple analysts converging on similar price targets and technical indicators beginning to show bullish divergence, our ADA price prediction suggests a measured recovery toward the $0.70-$0.82 range over the coming weeks.
ADA Price Prediction Summary
• ADA short-term target (1 week): $0.48-$0.52 (+12-21%)
• Cardano medium-term forecast (1 month): $0.65-$0.77 range
• Key level to break for bullish continuation: $0.61 (immediate resistance)
• Critical support if bearish: $0.39 (immediate support), $0.27 (strong support)
Recent Cardano Price Predictions from Analysts
The latest round of analyst predictions reveals a surprisingly bullish consensus for Cardano’s near-term prospects. CoinEdition’s ADA price prediction targets $0.77 in the short term, contingent on buyers reclaiming the crucial $0.65-$0.69 region with sustained volume. This aligns closely with Blockchain.News’ Cardano forecast of $0.70-$0.82 by December 2025, based on technical consolidation patterns suggesting an imminent breakout attempt.
The most optimistic projection comes from CoinMarketCap AI, which sets an ADA price target of $1.25 for 2025, driven by anticipation around the Midnight Mainnet launch scheduled for December. This represents a nearly 200% upside from current levels, though this forecast carries medium confidence given the significant technical resistance that must be overcome.
Notably absent are any bearish predictions below current levels, suggesting analyst consensus has shifted toward cautious optimism despite ADA’s 55% decline from its 52-week high of $0.96.
ADA Technical Analysis: Setting Up for Oversold Bounce
The Cardano technical analysis reveals several encouraging signals for bulls. The RSI at 33.17 sits in neutral territory but closer to oversold levels, historically a favorable entry zone for ADA. More importantly, the MACD histogram has turned positive at 0.0020, indicating early bullish momentum is building beneath the surface.
ADA’s position at 0.28 within the Bollinger Bands suggests the asset is trading in the lower portion of its recent range, with the middle band at $0.48 representing the first major resistance level. The current price of $0.43 sits right at the calculated pivot point, making this a critical juncture for determining near-term direction.
Volume analysis shows $42.8 million in 24-hour trading on Binance, which while modest, has been sufficient to generate a 3.15% daily gain. The key will be whether this volume can sustain as ADA approaches the $0.48-$0.50 resistance zone where multiple moving averages converge.
Cardano Price Targets: Bull and Bear Scenarios
Bullish Case for ADA
The primary bullish scenario for our ADA price prediction centers on a successful reclaim of the $0.48 level (SMA 20), which would target the $0.57 area (SMA 50) as the next logical resistance. A break above $0.61 (immediate resistance) would open the door to the analyst consensus range of $0.70-$0.77, representing potential gains of 63-79% from current levels.
The most aggressive ADA price target of $0.95 (DigitalCoinPrice’s year-end prediction) would require breaking through the significant $0.84 strong resistance level. This scenario would need substantial fundamental catalysts, likely tied to the Midnight Mainnet launch or broader crypto market recovery.
Bearish Risk for Cardano
The bearish case for this Cardano forecast hinges on failure to hold the $0.39 immediate support level. A break below this area would target the $0.27 strong support zone, representing a potential 37% decline from current levels. This scenario would invalidate the current oversold bounce thesis and suggest deeper structural issues.
The 52-week low of $0.40 serves as a psychological floor, and any sustained trading below this level would signal a breakdown of the long-term technical structure supporting our bullish ADA price prediction.
Should You Buy ADA Now? Entry Strategy
Based on current technical positioning, the question of whether to buy or sell ADA favors a measured accumulation approach. The optimal entry strategy involves scaling into positions between $0.41-$0.45, with the heaviest allocation near the $0.41-$0.42 range where strong buying interest has emerged.
Risk management suggests placing stop-loss orders below $0.38 to limit downside exposure, while profit-taking levels should target the $0.52-$0.57 range for the first wave of gains. More aggressive traders might hold for the $0.70-$0.77 Cardano forecast targets, though this requires higher risk tolerance.
Position sizing should remain conservative given ADA’s high volatility (ATR of $0.04), with no more than 2-3% of portfolio allocated to this trade until clearer directional momentum emerges above $0.50.
ADA Price Prediction Conclusion
Our comprehensive analysis supports a cautiously bullish ADA price prediction with a primary target of $0.77 by December 2025, representing approximately 79% upside potential. The combination of oversold technical conditions, positive MACD momentum, and analyst consensus around the $0.70-$0.82 range provides a solid foundation for this Cardano forecast.
Confidence Level: Medium-High (75%)
Key indicators to monitor for confirmation include sustained trading above $0.48 (SMA 20), RSI breaking above 40, and daily volume exceeding $60 million. Invalidation signals would include breaks below $0.39 support or failure to reclaim $0.45 within the next week.
The timeline for this prediction centers on a 2-4 week consolidation phase followed by a breakout attempt toward the $0.65-$0.69 region, with final targets reached by mid-to-late December 2025, contingent on broader market conditions and the successful launch of Cardano’s Midnight Mainnet upgrade.
Bitcoin (BTC), Ethereum (ETH) and Ripple (XRP) steadies around key levels on Friday after recovering nearly 5%, 7% and 6%, respectively, so far this week. These top three cryptocurrencies are aiming for a further rally, with the bull targeting $100,000 BTC, $3,500 ETH and $2.35 XRP.
Bitcoin extends recovery, aiming for $100,000 mark
Bitcoin price found support around the key psychological level of $80,000 last week, recovered slightly over the weekend, and has rebounded nearly 5% so far this week. At the time of writing on Friday, BTC hovers around $91,000.
If BTC continues its recovery, it could extend the rally toward the next key psychological level at $100,000.
The Relative Strength Index (RSI) on the daily chart is 40, pointing upward toward the neutral 50 level, indicating fading bearish momentum. Additionally, the Moving Average Convergence Divergence (MACD) showed a bullish crossover on Thursday, providing a buy signal and further supporting the potential continuation of the recovery.
BTC/USDT daily chart
On the other hand, if BTC faces a correction, it could extend the decline toward the key support at $85,000.
Ethereum could extend gains if it closes above key resistance
Ethereum price found support near the 61.8% Fibonacci retracement level at $2,749 on November 22 and recovered more than 8% in the next four days. At the time of writing on Friday, ETH approaches its key resistance level at $3,017.
If ETH closes above the daily resistance at $3,017, it could extend the rally toward the next psychological level at $3,500.
The RSI on the daily chart is 40, pointing upward toward the neutral 50 level, indicating fading bearish momentum. Additionally, the MACD showed a bullish crossover on Monday, which still holds and supports the potential continuation of the recovery.
ETH/USDT daily chart
On the other hand, if ETH declines, it could extend the drop toward the 61.8% Fibonacci retracement level at $2,749.
XRP bulls setting sights on the $2.35 mark
XRP price retested and found support around the lower trendline of the descending channel (drawn by connecting multiple highs and lows with two trendlines) on Saturday and recovered 14.19% by Monday. However, XRP has been consolidating around $2.20 mark for the last three days. At the time of writing on Friday, it hovers around the same level.
If XRP recovers, it could extend the rally toward the next daily resistance level at $2.35, which coincides with the 50-day EMA at $2.36.
Like Bitcoin and Ethereum, XRP’s RSI and MACD also support the recovery thesis.
XRP/USDT daily chart
On the other hand, if XRP corrects, it could extend the decline toward the daily support at $1.96.
A crypto analyst has issued a decisive projection that challenges the long timelines often associated with major price milestones for Bitcoin. His outlook was presented in response to the ultra-bullish forecasts from Michael Saylor and Jack Mallers, who have spoken openly about the possibility of Bitcoin reaching between $1 million and $20 million per coin.
Rather than focusing on Bitcoin’s distant targets, the analyst directed attention to XRP, insisting that XRP will reach $100 long before Bitcoin touches the seven-figure mark.
Analyst Says XRP Will Reach $100 Before Bitcoin’s Million-Dollar Target
There have been many bullish predictions of Bitcoin breaking above the $1 million mark in recent months, with notable names like Michael Saylor and Cathie Wood pointing to million-dollar targets.
However, an analyst who goes by the name 24HRSCRYPTO on the social media platform X referenced Saylor and Mallers’ price prediction, which places future Bitcoin valuations in the tens of millions per coin and implies a market cap approaching $500 trillion. He contrasted those long-range projections with what he believes is a more attainable and nearer-term milestone for XRP.
Punching in the numbers shows that XRP is a 4,445% move away from $100 based on its current price level of around $2.2. Bitcoin, on the other hand, is 990% away from the $1 million price.
Even with that difference, the analyst noted, “You will see XRP at $100 before Bitcoin hits $1 million.” The statement points to the view that XRP is positioned for faster price growth in the foreseeable future, as seen by price dynamics in the past few months. The crypto is increasingly being positioned in a situation where demand and adoption of the Ripple ecosystem could take it to new heights.
On the other hand, Bitcoin’s price action is slowing down relative to XRP. Notably, technical analysis of the XRP/BTC pair places XRP on the path to outperforming Bitcoin in the coming weeks and months.
The Altcoin Will Hit $1,000 Before Bitcoin Touches $19 Million
The analyst extended his projection even further by asserting that XRP could rally to $1,000 before Bitcoin comes close to the $19 million figure referenced by Saylor. Such a valuation for Bitcoin would imply a market capitalization of roughly $500 trillion, a scale far beyond anything seen in global financial history.
Measured from today’s levels, Bitcoin would need to climb roughly 20,635% to reach the $19 million mark. XRP’s path to $1,000 amounts to an even larger jump of about 45,300%, which corresponds to a market cap of $60 trillion based on its current circulating supply. Still, XRP reaching $1,000 is, in his view, more feasible than Bitcoin reaching millions per coin.
Solana price is approaching a key resistance zone, with improving technicals and rising momentum hinting at a potential breakout in the days ahead.
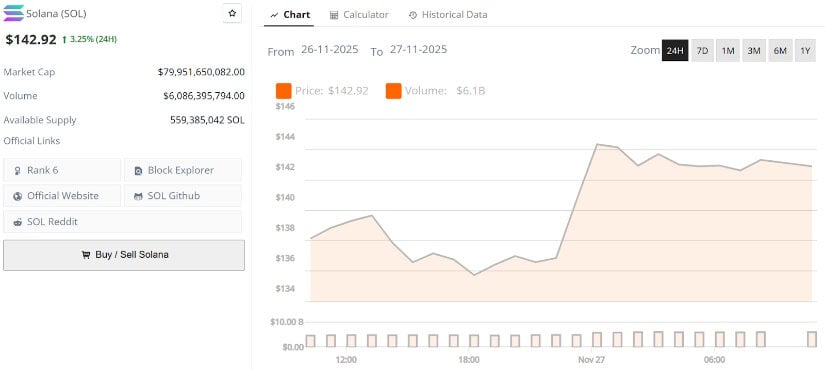
Solana price is regaining momentum as it pushes back towards the $143–$145 region, a zone that has repeatedly acted as a ceiling during November’s choppy trading environment. With the token trading around $142.92, analysts are now assessing whether Solana’s improving technical posture and sentiment indicators are pointing toward a stronger recovery phase. This renewed focus has also placed short-term Solana Price Prediction scenarios back into the spotlight.
Technical Structure Suggests Solana May Be Preparing for Breakout Attempt
Fresh optimism emerged after multiple analysts identified early signs of structural improvement across Solana’s mid-timeframe charts. One notable observation came from Fresh_Fontana, who highlighted that SOL “looks ready to rip through resistance” as the token reclaimed key order blocks and began interacting with reclaimed bullish zones around $142 to $144.
Solana continues to build upward pressure beneath the $144–$145 resistance zone, signaling a potential breakout setup forming on mid-timeframe charts. Source: Fresh_Fontana via X
His chart showed a clean break of structure followed by a series of higher lows forming just beneath the resistance band. This build-up of pressure beneath a horizontal ceiling is often interpreted as pre-breakout compression, especially when accompanied by increasing volume and reduced wick rejection.
If SOL can push through the $144 to $145 area with conviction, it could unlock a move towards the next liquidity cluster around $152 to $155, where prior inefficiencies remain unfilled.
Capitulation Signals Show Potential Bottoming Behavior
A separate angle came from Ali Martinez, who noted that Solana “usually bottoms when investors capitulate”, and according to recent NUPL (Net Unrealized Profit/Loss) readings, such behavior has already been unfolding for the past two weeks.
Solana’s NUPL readings show investor capitulation unfolding for two weeks, a pattern that has historically aligned with major market bottoms. Source: Ali Martinez via X
Periods of investor capitulation have historically preceded strong recovery phases in Solana’s market cycles. The NUPL index recently entered zones associated with realized losses and emotional exhaustion, which typically mark the late stages of corrective trends. These conditions do not guarantee reversals, but they often align with improved risk-reward profiles as selling pressure begins to weaken.
Solana Price Could Go Parabolic If Trend Shifts
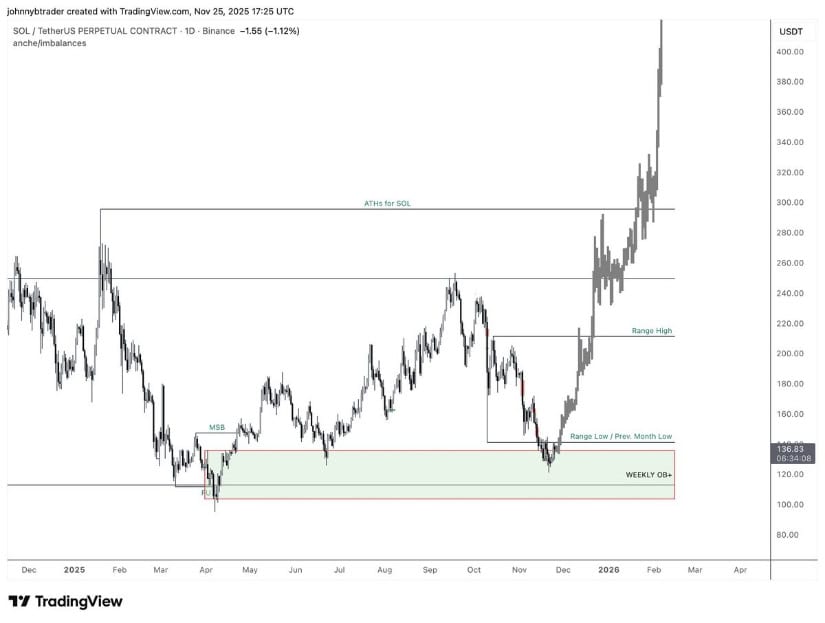
Momentum improved further after analyst Johnny B shared a macro outlook showing Solana price reclaiming key higher-timeframe levels, with projected candles illustrating how price could expand if current strength continues. While SOL sits near $142, the reclaim of mid-range structure suggests the market may be transitioning out of its multi-month consolidation.
This aligns with Solana’s broader resilience throughout 2025, where price repeatedly defended the $115 to $128 demand zone. With momentum now pushing into the upper midrange, the next logical reaction areas appear near $168 to $176, a region defined by former monthly imbalances and historical resistance.
If Solana can hold above reclaimed support and market conditions remain favorable, the higher-timeframe structure leaves room for a much broader advance. In a strong liquidity environment, SOL could eventually revisit its all-time high zone and potentially extend towards the $350–$400 region.
Solana’s higher-timeframe reclaim signals growing bullish momentum, with analysts eyeing a potential move towards $168–$176. Source: Johnny B via X
This higher-timeframe reclaim aligns with broader strength observed in Solana throughout the year, with the token repeatedly defending long-standing demand regions around $115 to $128. With price now pushing towards the upper midrange, attention turns to whether Solana price can sustain this expansion and continue towards the next structural region near $168–$176.
Key Levels and Market Structure
Solana’s current technical structure shows several constructive elements forming simultaneously. These insights are shaping several Solana Price Prediction models that analysts are now revisiting as the token builds pressure beneath resistance.
Solana current price is $142.92, up 3.25% in the last 24 hours. Source: Brave New Coin
Support Zones
$137–$138: Initial intraday support and recent retest zone
$132–$134: Former liquidity pocket, now acting as secondary support
$126–$128: Major swing support that marked November’s capitulation low
These regions are receiving consistent buyer interest, helping maintain a series of higher lows that reinforce short-term bullish structure.
Immediate Resistance
$144–$145: Major ceiling repeatedly rejecting price
$151–$155: Next liquidity pocket and inefficiency zone
A clean reclaim of $145 on strong volume remains the key signal traders are waiting for. Until then, SOL remains inside a tight compression beneath resistance.
Historical Context Helps Frame the Current Setup
Solana’s current phase resembles previous consolidation-to-expansion transitions seen in its price history. In past cycles, Solana price often produced prolonged crabbing phases around resistance before initiating strong vertical moves once liquidity was absorbed.
The $144–$145 zone resembles similar pre-breakout ceilings from earlier bull phases, where repeated rejections eventually gave way to high-momentum candles once supply was cleared.
If this historical rhythm repeats, the current compression could be setting the foundation for the next major leg upward.
Final Thoughts
Solana’s latest price action shows renewed strength, but the coming days will determine whether this recovery turns into sustained upside. Capitulation signals, improving market structure, and higher-timeframe reclaim patterns all support the idea of a maturing bottom, yet resistance remains a major hurdle.
A breakout above $145 would likely shift short-term sentiment decisively, opening the door for broader continuation. Until then, participants are watching price behavior closely as the Solana price approaches one of its most important levels of the month.
Bitcoin (BTC) is showing renewed strength as it eyes $102K, despite recent pullbacks, signaling that short-term volatility may be giving way to a bullish long-term trend.
According to BTC/USD data on TradingView, after a decline of approximately 35% over the past six weeks, Bitcoin has stabilized near $91,200–$91,300. Analysts observing technical breakouts and historical on-chain patterns suggest there may be potential momentum toward higher price levels in the coming days.
Short-Term Pullback and Technical Resistance
On the daily chart, Bitcoin recently broke above a long-term descending trendline and surpassed the Ichimoku Kumo cloud, indicating a potential momentum flip toward bullish territory.
James Stanley, a senior market analyst at StoneX Financial specializing in macro-crypto correlations, noted:”The recent breakout above key resistance levels suggests that Bitcoin may continue its upward trajectory, provided it holds above $90,000.”
This cycle’s pullback is unusual, as a reliable low-forecasting metric signaled early, yet Bitcoin’s price didn’t respond, making bottom-calling difficult. Source: Dom via X
Short-term resistance remains around $94,500–$95,000, coinciding with prior liquidity pockets. Analysts highlight that failing to hold these levels could constrain upward movement in the near term, though this does not necessarily imply a trend reversal.
Key Targets for Bitcoin Price Today
In the medium-term structure, measured-move targets are derived from prior consolidation ranges and historical supply zones:
BTC/USD shows a bullish continuation setup after a trendline breakout, targeting $102K, with key intermediate targets at $95K and $99K and risk below $88,500. Source: RSI Trading point on TradingView
Target 1: $94,500–$95,000—Immediate breakout extension based on short-term liquidity pockets (TradingView, BTC/USD chart).
Target 2: $98,000–$99,000—Momentum continuation area near a major psychological resistance cluster.
Target 3: $101,500–$102,500—Major measured-move target derived from higher-timeframe unfilled liquidity and historical price memory.
Stanley added, “If Bitcoin sustains above these support zones, the path to $102K remains plausible. Conversely, a drop below $88,500–$89,000 would weaken bullish continuation expectations and could trigger a short-term correction.”
Puell Multiple Signals Potential Rebound
Supporting the longer-term outlook, the Puell Multiple—a ratio of daily miner revenue to its yearly average—currently reads 0.67, according to Glassnode data. Historically, Bitcoin cycle bottoms have aligned with readings below 0.50 in 2018 and 2022, indicating potential undervaluation zones rather than deterministic outcomes.
The Puell Multiple, a metric tracking miner revenue, has historically signaled Bitcoin ($BTC) cycle bottoms below 0.50 since 2015 and currently reads 0.67. Source: Ali Martinez via X
Ali, an on-chain specialist known for analyzing cycle metrics, noted, “The Puell Multiple entering a discount zone indicates Bitcoin may be undervalued, suggesting a potential medium-term rebound toward $96,000.”
This metric has historically served as a useful tool to identify periods of miner capitulation and subsequent recovery, making it widely referenced among traders.
Market Context and Historical Trends
Historically, on multi-year cycles, Bitcoin drawdowns of this magnitude have often preceded recoveries. For example, during the 2021 top, BTC experienced a full-cycle retracement of roughly 77% from peak to trough before gradually regaining momentum.
In the short term, BTC/USD approached support near $80,000 (TradingView), forming a sequence of higher highs and higher lows over subsequent days. Analysts note that current volatility mirrors broader market conditions, including correlations with major indices such as the Nasdaq, as well as liquidity shifts and ETF flows.
Long-Term Outlook and Bitcoin Price Forecast 2025
On the medium-term chart, structural accumulation zones below the current price provide potential support, setting the stage for upward movement.
Current technical indicators suggest:
Consolidation above $90K may pave the way for tests of $100K and higher.
Historical price patterns, technical breakouts, and on-chain metrics like the Puell Multiple may support the case for a long-term recovery, though outcomes are probabilistic.
In summary, while short-term corrections are possible, Bitcoin’s market structure and historical tendencies indicate that the cryptocurrency could test the $102,000 range in the coming weeks.
Key Takeaways
Bitcoin has rebounded to $91,200–$91,300 after a steep decline, with early bullish momentum forming (TradingView, BTC/USD).
Technical targets suggest potential upside to $102,500, with support zones at $88,500–$89,000 acting as short-term risk checkpoints.
The Puell Multiple at 0.67 signals a potential undervaluation zone, hinting at a medium-term recovery toward $96K (Glassnode).
Historical trends and correlation with broader markets suggest that long-term bullish momentum remains plausible, despite near-term volatility.
Bitcoin was trading at around 91,196.46, up 3.96% in the last 24 hours at press time. Source: Bitcoin price via Brave New Coin
Bitcoin investors and traders are advised to monitor key support and resistance levels closely, balancing risk management with potential opportunities.
MATIC price prediction shows mixed signals with AI models targeting $0.105 short-term while analysts forecast recovery to $0.22-0.35 range within 30 days from current $0.38.
Polygon’s MATIC token presents a compelling yet challenging prediction landscape as we approach December 2025. With the cryptocurrency trading at $0.38 and showing mixed technical signals, our comprehensive MATIC price prediction analysis reveals a tale of two timeframes that traders need to carefully navigate.
MATIC Price Prediction Summary
• MATIC short-term target (1 week): $0.105 (-72.4% decline risk based on AI models)
• Polygon medium-term forecast (1 month): $0.22-$0.35 range (+15-40% potential upside)
• Key level to break for bullish continuation: $0.45 (SMA 50 resistance)
• Critical support if bearish: $0.33 (analyst consensus support level)
Recent Polygon Price Predictions from Analysts
The latest Polygon forecast from leading analysts reveals a stark divergence in short versus medium-term outlooks. CoinCodex’s AI-powered MATIC price prediction model issued a bearish warning on November 27, projecting a significant 23.28% decrease over five days, establishing a MATIC price target of $0.105426. This prediction carries medium confidence and identifies critical technical levels at $0.134155 support and $0.140215 resistance.
Contrasting this pessimistic short-term view, Blockchain.News published a more optimistic Polygon forecast on November 26, suggesting potential recovery to the $0.22-$0.35 range over the next month. This represents a substantial 15-40% upside from current levels, despite acknowledging mixed technical indicators. The key battleground lies at the $0.45 SMA 50 resistance level, with $0.33 serving as crucial support.
The consensus among analysts remains cautiously mixed, with the market clearly at an inflection point where either scenario could materialize based on broader crypto market conditions and MATIC-specific developments.
MATIC Technical Analysis: Setting Up for Potential Reversal
Current Polygon technical analysis reveals a cryptocurrency caught between competing forces. Trading at $0.38, MATIC sits precariously below all major moving averages, with the SMA 20 at $0.43, SMA 50 at $0.45, and SMA 200 at $0.69 creating substantial overhead resistance. This positioning supports the bearish short-term MATIC price prediction scenarios.
The RSI reading of 38.00 places MATIC in neutral territory, neither oversold nor overbought, suggesting room for movement in either direction. However, the MACD histogram at -0.0045 indicates persistent bearish momentum, supporting the more pessimistic near-term forecasts.
Within the Bollinger Bands framework, MATIC’s position at 0.2879 places it in the lower portion of the trading range, with the lower band at $0.31 providing nearby support. The upper band at $0.56 represents a significant 47% upside target, though reaching this level would require breaking through multiple resistance layers.
Volume analysis from Binance shows $1.07 million in 24-hour trading, which remains relatively modest and suggests lack of conviction from either bulls or bears. The Average True Range of $0.03 indicates moderate volatility, providing opportunities for both entry and risk management.
Polygon Price Targets: Bull and Bear Scenarios
Bullish Case for MATIC
The optimistic Polygon forecast scenario requires MATIC to first establish support above the $0.33 level, which aligns with analyst projections. From there, the MATIC price target progression would target $0.40 (psychological resistance), followed by $0.43 (SMA 20), and ultimately the key $0.45 (SMA 50) level.
A successful break above $0.45 would open the path toward the $0.22-$0.35 range that medium-term analysts are forecasting, though this seems conservative given it represents the same level as current prices. More realistic bullish MATIC price prediction targets include $0.50-$0.56 (upper Bollinger Band) representing 32-47% upside potential.
For this scenario to unfold, MATIC needs increasing volume, broader crypto market support, and specific positive catalysts related to Polygon’s ecosystem development or institutional adoption.
Bearish Risk for Polygon
The bearish MATIC price prediction scenario aligns with AI model forecasts suggesting a decline toward $0.105. This would require breaks below the immediate support at $0.35, followed by the critical $0.33 level that analysts have identified.
Should MATIC lose the $0.31 lower Bollinger Band support, the next significant level sits at the 52-week low of $0.37, though this appears to already be tested. Below this, the AI model’s $0.105 target represents a severe 72% decline that would likely coincide with broader crypto market distress.
Risk factors supporting this bearish Polygon forecast include the persistent position below all major moving averages, negative MACD momentum, and the token’s 70% decline from its 52-week high of $1.27.
Should You Buy MATIC Now? Entry Strategy
The current technical setup suggests a cautious approach to the buy or sell MATIC decision. For aggressive traders comfortable with high risk, the optimal entry strategy involves waiting for either a clear break above $0.40 for bullish positioning or below $0.33 for bearish confirmation.
Conservative investors should consider dollar-cost averaging into MATIC positions if the price approaches the $0.31-$0.33 support zone, with strict stop-losses at $0.28 to limit downside exposure. Position sizing should remain modest given the conflicting predictions.
For those believing in the medium-term Polygon forecast recovery, accumulating positions between $0.33-$0.38 while maintaining strict risk management rules provides reasonable risk-reward ratios. However, avoid concentrating more than 5% of portfolio allocation given the high uncertainty.
MATIC Price Prediction Conclusion
Our comprehensive MATIC price prediction analysis suggests traders should prepare for increased volatility in the coming weeks. While AI models point toward significant near-term weakness targeting $0.105 (low confidence given extreme nature), the medium-term Polygon forecast showing recovery to $0.22-$0.35 appears more realistic (medium confidence).
The key indicators to monitor include the $0.33 support level, which serves as the critical decision point for both scenarios. A break below this level would validate the bearish MATIC price prediction, while holding and reversing higher would support the recovery thesis.
Timeline expectations suggest any significant move should materialize within the next 7-14 days, making this a crucial period for MATIC holders and potential investors. The ultimate direction will likely depend on broader crypto market sentiment and Bitcoin’s ability to maintain stability above key support levels.
Confidence Level: Medium for both scenarios due to conflicting signals and high market uncertainty.