Solana price is showing renewed strength as rising ETF inflows, improving technicals, and strong support levels set the stage for a potential upside move.
Momentum around Solana price is heating up in an interesting way. While the broader market has been shaky, SOL continues to show signs of strength, driven by steady inflows and improving technicals.
Solana ETF Inflows Show Relentless Strength
Solana is showing renewed strength as a combination of rising spot-ETF inflows, supportive technical indicators, and well-defined price levels begin aligning in its favor. Although broader market sentiment has been mixed, SOL’s ability to attract consistent institutional demand sets it apart from many major altcoins during this period of volatility.
Solana spot ETFs have recorded 20 straight days of net inflows, signaling strong institutional accumulation despite recent market volatility. Source: Kyle Chassé via X
Recent on-chain and fund-flow data suggest that this demand may not be incidental. Multiple independent market analysts have highlighted that Solana ETFs have recorded 20 consecutive days of net inflows, an uncommon streak that often reflects sustained, thesis-driven accumulation rather than short-term speculative positioning. In a market currently searching for direction, these steady inflows provide a tangible signal of confidence and help reinforce the foundation beneath SOL’s price action.
Solana Price Eyes Higher Resistance Levels
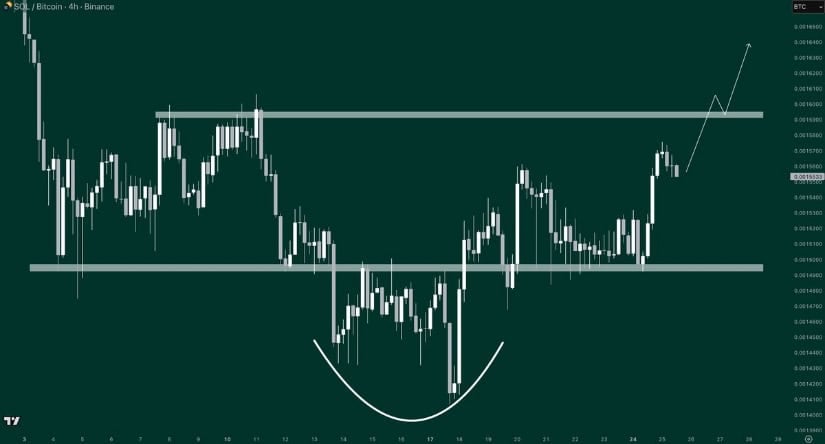
In the technical camp, Crypto Tony mapped out a clean projection showing Solana price potentially pushing towards the $145–$150 resistance zone. Price is currently rebounding from the lower range, holding the $138–$140 support, and the short consolidation on the chart suggests bulls may attempt another leg upward.
Solana is rebounding from key support and eyeing a move towards the $145–$150 resistance zone as bulls regain momentum. Source: Crypto Tony via X
A break above $150 would shift the Solana price structure decisively bullish and open space towards the $160 region, where the next strong supply zone sits.
Liquidation Heatmap Favors a Move Towards $145
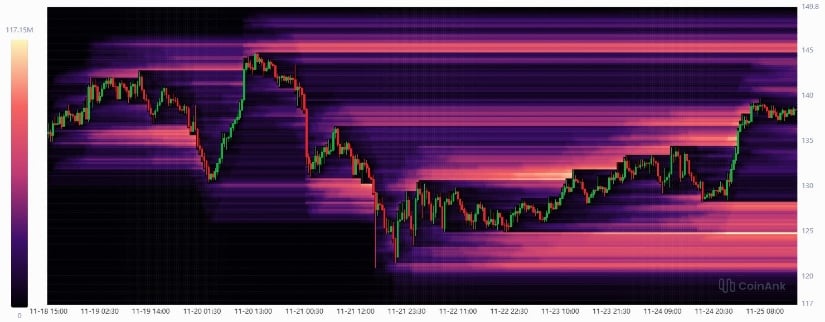
Short-side liquidity is also stacking in interesting ways. According to CW8900’s heatmap, a heavy concentration of short liquidations sits right around $145, forming the next likely sweep level during any recovery move.
Short liquidations are heavily clustered around $145, creating a magnetic target for price during any recovery move. Source: CW8900 via X
With SOL Solana price stabilizing after its latest sell-off, these liquidity pockets act as magnets, and a push into the $145 liquidation zone becomes a realistic short-term target if momentum builds.
OBV Breaks Down Into Major Support
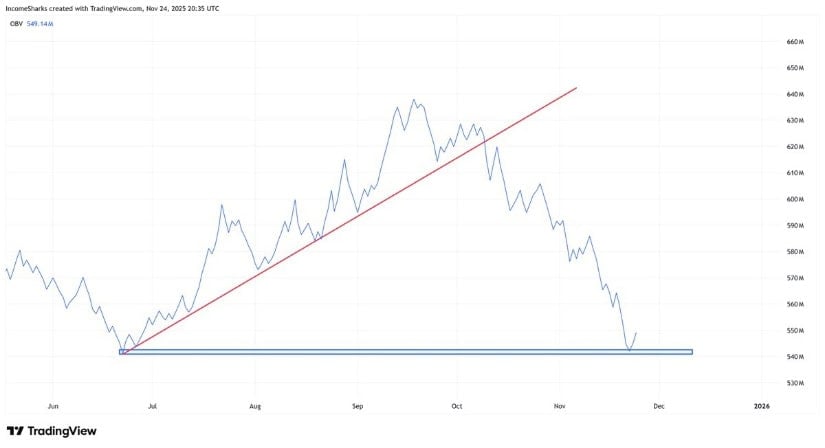
A notable indicator reading came from a famous crypto analyst, Income Sharks, who highlighted the OBV breaking its trendline and now resting exactly on a major support shelf. OBV rarely stays flat at key levels, and a base forming here often precedes a shift in volume flow back toward buyers.
OBV has dropped into a major support shelf, signaling a potential volume shift back toward buyers if this base holds. Source: Income Sharks via X
With OBV sitting on one of its cleanest support levels in months, there’s room for volume to shift back in favor of buyers. If that happens, it would add a strong confirmation layer to any bounce forming on price action.
SOL Shows Strength Against BTC
Gordon’s SOL/BTC chart shows a clear basing pattern, with the pair holding and reacting off a rounded bottom formation. The neckline near the 0.0030 BTC level is the major barrier, and price is now pressing back towards it with improving momentum.
SOL/BTC is forming a rounded bottom and pressing towards the 0.0030 BTC neckline, signaling improving relative strength. Source: Gordon via X
A breakout above that neckline would confirm SOL outperforming Bitcoin in the short term, a shift that usually supports stronger USD upside as well. The relative strength coming through here is a notable sign that SOL may be preparing for a broader recovery cycle.
Final Thoughts
Solana price continues to show a blend of strong fundamentals and steady technical improvements. ETF Overall, Solana’s setup reflects an alignment of supportive factors rather than a single catalyst. Persistent ETF inflows continue to demonstrate institutional conviction, while technical indicators, such as OBV stabilizing at a major support level and the SOL/BTC pair showing renewed relative strength, point to improving market structure. These elements together create a more credible backdrop for a potential rebound than price action alone.
That said, short-term volatility remains a meaningful consideration. Any bullish continuation ultimately depends on buyers defending key support levels and maintaining the inflow trend that has underpinned SOL’s resilience. If these conditions hold, a move toward the $145–$150 zone becomes a reasonable technical expectation.
Ether held firm on Tuesday as the market tried to settle after a rough November shaped by derivatives resets, collapsing gas fees, and the build-up to a new US futures launch next month.
Ethereum (ETH), the second-largest crypto asset, traded near $2,920 in the afternoon.
As per Coingecko data, the price was up about +4% in the past 24 hours as traders looked for signs of stability after weeks of heavy pressure.
The latest move comes as funding rates and open interest calm down following a sharp unwind earlier in the month.
And in the background, Cboe is preparing a “perpetual-style” ether futures product set to roll out in mid-December, giving US traders another way to hedge or gain exposure.
The broader market struggled for most of November. Bitcoin slid to a seven-month low last week, and ether dropped alongside it.
BTC has started to edge higher again, while ETH’s rise today marks a small break after several sessions of liquidations and risk-off sentiment.
Liquidity on Ethereum improved as the market bounced back. Average L1 gas briefly slipped to about 0.085 gwei late Tuesday morning. That’s one of the lowest levels of the year, and it made on-chain activity cheaper for users.
At the same time, DEX volume hit roughly $2.04Bn in the past 24 hours.
As per DefiLlama data, the network handled around 1.5M transactions and about 464,000 active addresses. These numbers show steady participation even after the recent pullback.
CoinGlass data shows that ETH open interest is near $35.84Bn, and futures volume over the past day is around $88Bn.
Positioning has grown again, but it hasn’t moved into heavy-leverage territory. Spot volume is still lighter than futures.
One structural event to watch in December is the launch of Cboe’s new ether “Continuous Futures” on December 15.
These US-regulated contracts aim to mirror perpetual futures, with daily cash adjustments and a listed term of up to 10 years.
Cboe’s Rob Hocking said perpetual futures were “historically traded offshore,” and noted that the exchange’s new structure is meant to offer “a controlled way to gain some leveraged exposure” under a US system.
Kaiko, Cboe’s index partner, said the products fill “a real need for institutional investors” who want efficient, long-term exposure without relying on unregulated venues.
Ethereum is also drawing attention in the market. Analyst Michaël van de Poppe says the ETH/BTC pair looks “eager to break to the upside” in the coming days. His chart shows the pair holding firm above a key support zone between 0.02920 and 0.03200 BTC, a level that has served as a steady demand area for months.
ETH/BTC is holding in a tight range, and Michaël van de Poppe thinks the move is close. “Probably 1–2 more days and then $ETH will break through the trend and outperform Bitcoin,” he said.
The pair has spent months correcting from its yearly high at 0.08556 BTC. Since then, it has moved sideways with narrow candles, showing how much volatility has compressed.
It is now pushing against a descending trendline that has capped every rally since late summer. That pressure hints at a possible breakout attempt.
The 50-day moving average on the daily chart is flattening just above current levels. ETH has also tested this area several times, leaving higher wicks that point to steady buying.
The RSI is climbing out of oversold territory, matching the stabilisation in price.
Van de Poppe calls this support area the “ideal zone for buys,” noting strong defence with repeated long lower wicks.
If ETH breaks the trendline, he sees targets near 0.036–0.038 BTC and later 0.042 BTC. If it fails, the pair could slip back toward 0.030 BTC.
For now, traders are watching to see if ETH can finally shift momentum after a long stretch of underperformance.
Bitcoin BTC USD price recovery prediction: The cryptocurrency market continues to face uncertainty as the latest Crypto Fear & Greed Index showed a modest rise to 20, up from 19 the previous day. While this marks a slight improvement, the reading keeps the market firmly in the ‘extreme fear’ zone, which highlights the ongoing investor anxiety.
What is the Crypto Fear & Greed Index
The Crypto Fear & Greed Index tracks market sentiment on a scale from 0 to 100, where 0 indicates maximum fear and 100 represents extreme greed, as per a report. It analyzes six key components: volatility (25%), market volume (25%), social media mentions (15%), investor surveys (15%), Bitcoin dominance (10%), and Google Trends (10%), as per a Bitcoin World report. This combination provides a detailed picture of market psychology.
Extreme Fear in Crypto Markets: What It Means for Investors
According to the Bitcoin World report, extreme fear in the market can signal potential buying opportunities for long-term investors, while extreme greed often points to market tops and the current 20 reading suggests that while fear persists, there are slight improvements in investor confidence.
Bitget CEO Says Crypto Sentiment Stabilizing Amid Extreme Fear
Bitget CEO, Gracy Chen, told The Economic Times that, “We view the sharp rebound in the Crypto Fear and Greed Index to 20 as an early sign that sentiment is beginning to stabilize after a period of intense volatility.” She explained that, “Extreme fear appears to be bottoming out, creating the conditions for renewed investor confidence as markets recalibrate,” as per the emailed statement.
December Fed Rate Cut Expectations Could Boost CryptoChen also told The Economic Times that expectations for a December Fed rate cut, now priced above 80%, create a dovish macro backdrop and that this shift could provide liquidity to risk assets, lower borrowing costs, and potentially spark a broader risk-on rally across crypto and traditional markets.
Key Market Signals Bitcoin Traders Must Watch in the Coming Weeks
The CEO even highlighted that, “Key signals to monitor over the coming weeks include Bitcoin dominance, changes in altcoin trading volumes, and major macro indicators such as CPI releases. These data points will help confirm whether the dovish macro shift has staying power and, in turn, whether the market is primed for a more decisive recovery,” as per the emailed statement to The Economic Times.
BTC USD Price Today and Altcoin Price Movements
The CoinDCX Research Team told The Economic Times that Bitcoin continues to consolidate around its gains, failing to reach the critical $90,000 resistance. Other major altcoins, including Ethereum, XRP, Tron, Dogecoin, and Cardano, saw small bullish moves but remain below their price targets. The day’s top performers included Bonk (+12.3%), Kaspa (+11.45%), and Sui (+10.19%), while Zcash dropped over 12.5%, with Memecore, MYX Finance, and Hedera down over 4% each, CoinDCX Research Team wrote in an emailed statement to The Economic Times.
Bitcoin Open Interest Shows Major Market Reset
CoinDCX Research Team told The Economic Times that Bitcoin open interest experienced one of the sharpest 30-day declines since 2022, indicating a major market reset that often precedes bottom formation. Regulatory developments in Japan will require crypto exchanges to maintain liability reserves to compensate users in case of hacks or security breaches, as per the emailed statement.
Spot Altcoin ETFs and BlackRock Buying BTC & ETH Signal Growing Market Interest
The research team added that, “Five spot altcoin ETFs will be listed in the next six days, which could give the required boost to the markets. In the meantime, BlackRock adds 2,269 BTC and 10,629 ETH to its wallet, signalling the rise in institutional and retail buying.”
FAQs
How is the Crypto Fear & Greed Index calculated?
It combines volatility, market volume, social media mentions, surveys, Bitcoin dominance, and Google Trends.
Which cryptocurrencies are showing gains today?
Bonk (+12.3%), Kaspa (+11.45%), and Sui (+10.19%) are the top gainers.
The recent crypto market update shows how fragile momentum can be. Since the October 10 pullback, liquidations wiped more than $1 trillion from market capitalization and pushed investor sentiment to multi-month lows. Total crypto market capitalization sits near $2.87 trillion on the one-week chart (TradingView TOTAL), and many altcoins have seen their Q3 gains erased.
Industry voices like Nic Carter of Castle Island Ventures say the market has matured and “derisked,” reducing token-driven chaos. Altcoin Sherpa argues the old long accumulation phases are gone, replaced by shorter, faster cycles that can both accelerate gains and end projects quickly. That shift matters for any Polygon (MATIC) price prediction and the broader MATIC outlook.
At the same time, traders are showing renewed PEPENODE (https://pepenode.io/) interest. New presales and memecoin-style launches offer gamified utilities and flexible payment methods, and PEPENODE’s presale details – a 210 billion total supply on Ethereum with staking and burns planned – attract speculative capital. This dynamic underpins the current altcoin sentiment and frames the trade-off between established layer tokens like MATIC and small-cap, high-upside tokens.
Polygon (MATIC) Price Prediction
A broad macro backdrop is guiding MATIC more than isolated events. The October pullback erased over $1 trillion from crypto, leaving total market cap around $2.87 trillion and showing how the crypto market cap impact on MATIC ties price moves to bitcoin-led cycles. Nic Carter and market commentators note a structural derisking of crypto that shifts returns toward institutional utility and away from long, euphoric altseasons.
Lower liquidity and faster cycles mean traders will treat short pumps differently. Altcoin Sherpa’s view of a hyper-accelerated regime implies MATIC macro factors now include rapid rallies and sharper corrections that last weeks to months. Watch broad liquidity, BTC momentum, and rotation into presales when judging directional risk.
MATIC technical analysis should focus on defined levels and trend confirmation. Classical Polygon support resistance zones from Q3 breakout points remain key. Early Q4 peaks set short-term resistance while Q3 breakout areas act as critical support to watch.
Use moving averages and volume to filter noise. Daily and weekly MATIC moving averages that align with support levels can indicate whether the recent slowdown is consolidation or the start of a longer downtrend. Traders should seek multiple timeframe confluence to avoid false signals in this faster regime.
Ichimoku-style crossovers can flag aggressive moves. A price-to-Tenkan-sen bearish cross, seen in other altcoins, often precedes quick sell-offs. Monitor daily Tenkan/Kijun interactions and weekly trend bias for more reliable signals under volatile conditions.
MATIC sentiment has cooled since October, reflecting a broader altcoin narrative change. Retail interest is lower and capital often shifts to presales or meme projects during bouts of risk-seeking. That rotation can create temporary outflows and pressure on price.
On-chain metrics Polygon users should monitor include active addresses, transaction volume, staking flows, bridge activity, and large transfers. Rising exchange inflows or reduced DEX liquidity offer early warning that technical supports may fail. Strong on-chain activity would support a recovery signal.
Volume-based confirmation matters when capital chases presales like PEPENODE. If significant funds leave Polygon for new token sales, short-term demand for MATIC may weaken. Watch exchange flow metrics and liquidity pool depth to confirm whether technical support holds under selling pressure.
PEPENODE (PEPENODE) Interest and Short-term Catalysts
PEPENODE (https://pepenode.io/) has drawn attention as traders hunt for quick gains after large market drawdowns. The project markets itself as a gamified mining token that lets users buy and upgrade miner nodes with PEPENODE. Promises such as planned token burns, referral bonuses, and payouts in popular meme coins create a compact narrative that can fuel short-term flows during risk-on crypto trading windows.
PEPENODE project overview and utility
PEPENODE tokenomics list a total supply of 210 billion on the Ethereum network, with common wallet integrations like MetaMask, Trust Wallet, and Coinbase Wallet accepted for the PEPENODE presale. Core utility centers on node ownership, incremental upgrades, and staking pools that claim passive rewards. Reserved powerful nodes for early buyers and a 2% referral bonus add incentives for early participation.
Why traders shift from established chains to meme or presale tokens
After a steep market wipeout, many traders chase outsized returns in short windows. Meme coin rotation happens when capital chases strong narratives instead of long-term fundamentals. A presale trading strategy focused on concentrated, time-limited plays can outperform slow-moving layer-one exposure if momentum aligns with broader risk appetite.
Risks and responsible due diligence for PEPENODE interest
PEPENODE risks include liquidity fragility, concentrated token ownership, and aggressive vesting schedules that may prompt sudden sell pressure. Smart contract audits, on-chain distribution checks, and verified team transparency must be part of presale due diligence before committing funds.
Position sizing remains critical. Traders should limit allocations, set clear stop-loss and profit-taking rules, and track token unlock calendars to avoid being caught in dumps. Watching community activity and third-party audit status helps flag meme token red flags early.
For those considering PEPENODE staking or the PEPENODE presale, align moves with a robust presale trading strategy. Treat gains as short-term, maintain tight risk controls, and plan exits around expected listing and unlock events to manage exposure in fast-moving meme coin rotation cycles.
Market Strategy: Balancing MATIC Exposure with Emerging Tokens like PEPENODE
Crafting a clear MATIC allocation strategy helps investors stay disciplined as markets rotate. A sensible crypto portfolio split often places a core holding in established layer tokens like Polygon while allocating a small, predefined tranche to presales and meme-assets. For many investors, presale allocation guidelines suggest 1-5% of total capital for high-risk opportunities such as PEPENODE (https://pepenode.io/), with the remainder reserved for blue-chip exposure and cash reserves.
Strategic allocation and rebalancing triggers
Set explicit rebalancing triggers tied to cycle signals. Exit or trim presale positions after a 1-3 month hyper-pump or when indicators show entry into a 2-6 month downtrend. Major macro events-Bitcoin breaking to new highs or a liquidity shock-should also prompt reassessment. A disciplined crypto stop-loss strategy and profit-taking ladder for presales locks gains and limits emotional reactions.
Risk management – stop-losses, position sizing, and monitoring
Adopt MATIC risk controls by using technical stops at key support or moving-average levels and scale into positions when on-chain metrics confirm accumulation. For presales, enforce strict presale risk management: tiny position sizes, short profit timelines, and immediate partial profit-taking on listing. Use alerts and indicators-volume spikes, channel breaches, and Ichimoku crosses-to monitor momentum and trigger stop-losses fast.
Bull and bear scenarios for MATIC and PEPENODE
The MATIC bull case depends on a broader market recovery, increased on-chain activity, and renewed institutional flow. Under that scenario, a medium/long-term core holding could outperform. The PEPENODE (https://pepenode.io/) bull case requires strong presale uptake, solid staking or burn mechanics, transparent execution, and audited contracts to sustain short-term rallies.
On the flip side, crypto bear scenarios include prolonged macro weakness that drags MATIC lower and rotation into smaller tokens. PEPENODE faces classic presale hazards: low post-listing liquidity, concentrated token holdings, or smart-contract issues that can prompt rapid dumps. A balanced approach-diversified sizing, defined rebalances, and continuous monitoring of on-chain and macro signals-lets investors tilt exposure between MATIC and presales without overcommitting to either side.
Buchenweg 15, Karlsruhe, Germany
For more information about Pepenode (PEPENODE) visit the links below:
Disclosure: Crypto is a high-risk asset class. This article is provided for informational purposes and does not constitute investment advice.
CryptoTimes24 is a digital media and analytics platform dedicated to providing timely, accurate, and insightful information about the cryptocurrency and blockchain industry. The enterprise focuses on delivering high-quality news coverage, market analysis, project reviews, and educational resources for both investors and enthusiasts. By combining data-driven journalism with expert commentary, CryptoTimes24 aims to become a trusted global source for emerging trends in decentralized finance (DeFi), NFTs, Web3 technologies, and digital asset markets.
Dogecoin (DOGE) Price Prediction: Maxi Doge (MAXI) Rides the DOGE Ecosystem Wave
Dogecoin (DOGE) Price Prediction
The recent conversion of Grayscale’s Dogecoin Trust into a spot ETF under the ticker Grayscale GDOG on NYSE Arca marks a notable turning point for meme coins. By putting DOGE into standard brokerage accounts, the DOGE ETF makes institutional and retail access easier. That change can boost liquidity and sharpen the Dogecoin (DOGE) Price Prediction conversation.
ETF launches tend to draw measured capital and media attention. Initial reports expected first-day GDOG volume to be significant, and the event coincided with other spot products like XRP. Historical patterns show that ETF inflows often catalyze altcoin rotations, which can push traders toward higher-beta tokens during risk-on stretches.
For the meme coin outlook, reduced friction from ETFs reframes capital allocation. Institutions using regulated vehicles and retail traders seeing DOGE in familiar accounts can revive interest across the DOGE ecosystem momentum. This dynamic creates a narrative tailwind that projects such as Maxi Doge MAXI may seek to ride.
Maxi Doge (https://maxidogetoken.com/) presents itself as a dog-themed, leveraged-trading meme token with a capped supply and staking mechanics. Alongside peers like Pepe and PepeNode, MAXI sits on the spectrum between presale opportunities and established meme blue chips. Coverage from Bitcoinist and CryptoTimes24 highlights audits, presale metrics, and editorial review as checkpoints readers should weigh.
All content here is informational and not financial advice. Meme coins are highly volatile and can result in the total loss of invested capital. Investors should perform due diligence before engaging with speculative tokens or making decisions influenced by short-term ETF-driven momentum.
Dogecoin (DOGE) Price Prediction
Dogecoin ETF impact
The conversion of Grayscale’s Dogecoin trust into a spot ETF reshapes market access. Broker-dealers and retail brokerages can offer exposure without direct wallet custody. That shift often changes exchange flows and can improve DOGE liquidity as more investors execute larger orders with less slippage.
Impact on price dynamics shows up in early trading volumes and GDOG flows. Strong launch-day volumes tend to tighten spreads and support deeper order books. Institutional DOGE demand can bring capital that rarely participated before, while retail traders often follow when ETFs grant narrative legitimacy.
Past meme coin cycles reveal clear patterns tied to macro risk appetite. When markets switch to risk-on, altcoin rotation moves capital from blue-chip tokens into higher-beta meme assets. Dogecoin price history highlights episodes where flagship meme assets led rallies and drew attention to microcap projects with low liquidity thresholds.
Meme season correlations matter for timing and exposure. Retail sentiment, social momentum, and macro headlines drive the amplitude of meme moves. Traders watching meme coin cycles note that small-cap tokens often outpaced major memecoins during the early legs of prior rallies.
On-chain signals act as early warnings for momentum shifts. Rising daily active wallets, falling exchange balances for DOGE, sudden transfer volume spikes, and accumulation by large addresses form a useful set of meme coin on-chain metrics. These signals tend to precede price moves when combined with heightened social interest.
Short-term technical cues help confirm on-chain reads. Breakouts above key moving averages, volume spikes on both DEX and CEX platforms, and RSI moves into overbought ranges can indicate stronger trend conviction. Traders pair DOGE technical analysis with exchange flows and fund inflows to refine entry points.
GDOG flows and visible ETF inflows offer a new lens on institutional DOGE demand. Monitoring Arca listings and spot trading volumes alongside exchange flows reveals whether ETF activity spills over into the broader meme market. That spillover can boost interest in presales and microcap meme projects.
Practical trading advice centers on fusion of data sets. Combine on-chain signals DOGE with DOGE technical analysis and macro context to manage position sizing. That approach reduces single-signal reliance and helps navigate fast-moving meme coin cycles without overexposure.
Maxi Doge (MAXI) and the DOGE Ecosystem Wave
Maxi Doge tokenomics
Maxi Doge (https://maxidogetoken.com/) is carving a niche in the dog-themed sector by pairing meme energy with structured token design. The project runs on Ethereum with a capped total MAXI supply of 150.24 billion, a scarcity angle that supports the broader Maxi Doge tokenomics story.
Maxi Doge allocates tokens to a Maxi Fund and sets aside portions for liquidity, development, and marketing. That tokenomic structure aims to provide runway for listings and market-making while enabling planned ecosystem growth.
Tokenomics, supply structure, and staking yields
Staking is positioned as a core utility. Reported MAXI staking APY sits near 73%, a high yield meant to reward early holders and reduce immediate sell pressure at listing.
The capped MAXI supply gives a defined scarcity narrative that complements the staking program. The combination creates retention incentives and aligns holder interests with long-term ecosystem targets.
Presale traction and market positioning
Presale pricing in the current round was $0.0002695 per MAXI. At that level, MAXI presale metrics show more than $4.18 million raised, a sign of early Maxi Doge fundraising success and presale traction meme tokens often seek.
MAXI market positioning sits between pure meme plays and more formal utility tokens. The project uses gym-bro humor and a “Giga-Chad” Shiba motif to target traders who want high-beta exposure with game-like engagement.
Narrative fit with DOGE ETF momentum
The DOGE ETF narrative and GDOG momentum have refocused capital on dog-branded assets. Maxi Doge (https://maxidogetoken.com/) markets a MAXI DOGE synergy that aims to capture meme coin spillover as attention flows from larger names into newer presale opportunities.
By tying staking yields, a capped supply, and staged presale pricing together, the project hopes to attract traders looking to compound holdings while the DOGE ETF story drives sector interest.
Comparative Meme-Coin Landscape, Risk Checks, and Trading Considerations
The current meme coin comparison 2025 landscape blends established names like Pepe, Dogecoin, and Shiba Inu with aggressive presale projects such as PepeNode and Maxi Doge. Pepe posts market caps above $1.7 billion, heavy daily volume, and major exchange listings, while presales tout staking yields, audited reports, and roadmap-driven narratives to attract early capital.
PepeNode runs on Ethereum with a 210 billion PEPENODE supply and reported presale proceeds above $2.18 million. Staking rewards near 590% APY and audits from SolidProof and Coinsult are cited to bolster credibility. Shiba Inu’s path depends on Shibarium adoption, dApp growth, whale flows, and broader cycles; it remains a lower-slippage option versus microcaps.
Investors must prioritize presale due diligence and spot meme coin risks early. Check audits and read the full reports for unresolved findings. Scrutinize tokenomics: total supply, vesting schedules, early allocations, liquidity locks, and any Maxi Fund or reserve mechanisms. Verify deployer addresses and presale terms to avoid front-running traps.
On-chain signals matter: accumulation by large wallets, shrinking exchange balances, staking participation, and developer commits can validate momentum. Manage exposure with trading risk management meme tokens rules: position sizing, stop-losses, dollar-cost averaging, and staggered entries. In risk-on windows tied to events like a DOGE ETF launch, keep most capital in liquid names and assign limited stakes to high-beta presales.
A pragmatic barbell approach works: hold exposure to DOGE, SHIB, and PEPE for liquidity, while reserving small, speculative allocations for presales such as Maxi Doge and PepeNode. Due diligence, verified audits, transparent tokenomics, and disciplined risk controls remain essential to navigate the heightened volatility and liquidity pitfalls common in meme markets.
Buchenweg 15, Karlsruhe, Germany
For more information about Maxi Doge (MAXI) visit the links below:
Disclosure: Crypto is a high-risk asset class. This article is provided for informational purposes and does not constitute investment advice.
CryptoTimes24 is a digital media and analytics platform dedicated to providing timely, accurate, and insightful information about the cryptocurrency and blockchain industry. The enterprise focuses on delivering high-quality news coverage, market analysis, project reviews, and educational resources for both investors and enthusiasts. By combining data-driven journalism with expert commentary, CryptoTimes24 aims to become a trusted global source for emerging trends in decentralized finance (DeFi), NFTs, Web3 technologies, and digital asset markets.
The development of Layer-2, a completely EVM-compatible blockchain for meme coins, high-throughput apps, ultra-low fees, and sniper-bot resilience, provides Little Pepe an edge. This purpose-built ecosystem solves numerous early-stage meme launch issues, making LILPEPE a pioneer in meme coin infrastructure. Early presale customers have experienced returns of over 120% since Stage 1, and analysts estimate LILPEPE might reach $0.22 in 2026, a 10,000% increase from current values. Unlike ADA, where upside is constrained by its size, Little Pepe sits at the ideal point of the adoption curve for investors seeking multi-X returns.
Why is
crypto going up today? The cryptocurrency market is experiencing a strong
recovery rally today (Tuesday), November 25, 2025, with Bitcoin (BTC) price jumping
to $88,590 (up 1.6% in 24 hours), Ethereum rising 2.1% to $2,942, XRP surging
8% to $2.24, and Dogecoin gaining ground at $0.1525.
The total
crypto market capitalization has risen 2.4% to $3.1 trillion, adding $23.8
billion in value over the past day as investor sentiment improves from extreme
fear levels. The crypto surge is primarily driven by a shift in Federal Reserve rate
cut expectations, with odds jumping from just 40% last week to 82% for December
according to Polymarket and CME FedWatch data.
However,
this is most likely a dead cat bounce, and the cryptocurrency market could
quickly resume its decline. In this text, I provide a technical analysis of the
BTC/USDT, ETH/USDT, XRP/USDT, and DOGE/USDT charts and outline what these
assets may face in the coming weeks.
Follow me on X for more up-to-date analysis and forecasts on major cryptocurrencies and other financial instruments.
Bitcoin’s
price fell 1.3% Tuesday to $87,177, showing slight weakness but maintaining a
clear recovery from Friday’s turbulent session when
it crashed to just $80,000, a seven-month low. According to my technical
analysis, Bitcoin’s movement toward my target bearish range around $74,000
encountered a local accumulation zone at $83,000-$84,000 where a bullish pin
bar candle formed with a very long lower wick, showing rejection of further
selling by supply.
As a
result, we’re currently in a short-term corrective bounce which could reach the
$92,000-$94,000 zone marked in red on my chart, as
I mentioned in one of my earlier analyses. This is a typical bull trap and
dead cat bounce, so I’m still targeting lows around $74,000 coinciding with
this year’s minimum on Bitcoin’s chart. After testing this level, I intend to
accumulate Bitcoin assuming a return to uptrend and ultimately re-entering a
price discovery phase.
Why Bitcoin price is going up today? Source: Tradingview.com
Bitcoin Technical Levels
Key Level
Price Zone
Significance
Current Price
$87,177-$88,590
Tuesday
trading, recovering from Friday crash
Friday Low
$80,000
Seven-month
low, local accumulation zone
Pin Bar Support
$83,000-$84,000
Bullish
rejection candle, current base
My Corrective Target
$92,000-$94,000
Bull trap
resistance, shake-out zone
My Accumulation Target
$74,000
2025
yearly minimum, ultimate bearish goal
Bull Invalidation
$100,000
Psychological
level, trend reversal signal
Paul
Howard, Director at Wincent, provided institutional perspective on the current
market structure: “Indicators from the end of October where we saw whales
selling and tightening liquidity, led to the institutional basis trade unwind
and wave of ETF selling.”
“Dovetail
this with the year-end where we typically see books selling crypto for
reporting purposes, sentiment remains muted,” Howard continued. “I do
not expect we bounce back to $100,000 levels anytime before Q1.”
Ethereum Price Shows Death
Cross Warning Despite Support Defense
On the
other hand, ETH stopped clearly at the support zone I mentioned around $2,750,
which so far provides a place to bounce. However, there’s not much room as we
soon have the 50% Fibonacci retracement and also local November lows, and
shortly a resistance zone around $3,350 marked by August minimums tested again
in early October, not to mention the cluster of moving averages I mentioned.
Only a
return above this cluster will allow me to again believe Ethereum has demand
strength for further appreciation. For now I remain more bearish-biased on
Ethereum despite the short-term recovery bounce.
Why Ethereum price is going up today? Source: Tradingview.com
BlackRock has
been accumulating Ethereum through its iShares Ethereum Trust ETF (ETHA), with
recent purchases totaling $72.5 million in October and larger accumulations of
$140.9 million in September. While spot Ethereum ETFs saw $1.64 billion in
outflows during November, institutional interest from the world’s largest asset
manager signals long-term confidence in ETH as a foundational asset for smart
contracts and tokenization.
XRP Price And Two-Day
Rally Within Bearish Structure
XRP price has two dynamic
days of consecutive gains behind it, including a remarkable 9% surge on Monday,
and on Tuesday the price corrects by a modest 1.6% and changes hands at $2.19,
with spot data showing $2.24 and an 8% daily gain. From a technical analysis
perspective, this two-day bounce allowed us to return to an important zone that
until recently acted as support, now acting as resistance in the range between
$2.18 and $2.29.
The fact
that we’re below the moving average cluster suggests for now we should expect a
bearish reaction and corrective decline again toward $1.90 support where on
Friday a bullish pin bar formed allowing the current bounce to materialize.
Like the two charts above, this is short-term for me and long-term I
maintain my bearish stance I mentioned some time ago due to death cross
formation, targeting a level of just $1.25 which was last tested one year ago.
Why XRP price is going up today? Source: Tradingview.com
Dogecoin Price: Support
Zone Defense But Death Cross Intact
Dogecoin (DOGE) notations fell
2.3% Monday and the cryptocurrency costs $0.1483 after rising for the last 2
days, bouncing from a support zone last tested in June. Recent declines on the
DOGE chart which we observed continuously from September peaks pushed the price
to my designated support zone between 14 and 15 cents, tested in March, April,
June and last time in October this year.
And
although it seemed Dogecoin might exit this range, which we witnessed including
last Friday, the price found support slightly lower, bounced and returns again
to this range showing that the long-term consolidation we’ve been observing
since February is still in play. Its main upper boundary falls around the 29-30
cents range, and according to swing trading principles we should be heading in
that direction.
However,
the technical situation is not in favor of buyers. Primarily we’re in a
downtrend as evidenced by simply being below the 200 MA moving average, not to
mention the
death cross formed in late October (sell signal from 50 and 200 MA
crossing).
Why Dogecoin price is going up today? Source: Tradingview.com
For me to
start believing in a stronger Dogecoin bounce, it would need to return above
the 20 cents level and break the blue average; only then would I consider
playing long positions toward 30 cents, the level last tested in September.
Why Crypto Is Surging Today?
Federal Reserve Dovish
Pivot
The primary
driver behind why crypto is surging today is the dramatic shift in Federal
Reserve policy expectations. Joel Kruger, strategist at LMAX Group, explained:
“Market conditions appear to be realigning with the broader status quo,
particularly around Fed expectations. After a brief wobble driven by a hawkish
tilt that unsettled risk assets, the market is once again leaning toward
accommodation.”
The CME
FedWatch tool shows December rate cut odds jumped from 30% on Wednesday to
75.5% by Friday, following dovish remarks from Fed Vice Chair John Williams.
This represents a stunning reversal from the 22% probability economists
assigned just days earlier.
Institutional Flows and
ETF Launches
BlackRock’s
continued Ethereum accumulation through its iShares Ethereum Trust ETF,
including the $72.5 million October purchase, signals institutional confidence
despite recent market volatility. The asset manager views Ethereum as a
foundational layer for smart contracts, tokenization, and institutional-grade
Web3 infrastructure.
Technical Reset and
Oversold Conditions
Kruger
noted that “the market has now digested the recent setbacks, creating a
healthier backdrop and offering investors a chance to reenter at compelling
levels. Bitcoin has historically rewarded conviction during periods of
volatility, with significant pullbacks frequently preceding powerful moves to
new all-time highs.”
Crypto Price Analysis, FAQ
Why is crypto going up
today?
Crypto is
surging on November 25, 2025 due to Federal Reserve dovish pivot with rate cut
odds jumping from 40% to 82% for December, Monday launch of Franklin Templeton
and Grayscale XRP ETFs ($94M combined first-day inflows), BlackRock Ethereum
ETF purchases signaling institutional confidence, technical oversold bounce
after Friday’s crash to seven-month lows, and leverage unwinding stabilizing
the market.
What is Bitcoin price
prediction?
According
to my technical analysis, Bitcoin at $87,177-$88,590 is in bull trap bounce
potentially reaching $92,000-$94,000 corrective resistance before declining to
my ultimate target of $74,000 (2025 yearly minimum) for accumulation. After
testing $74K, I anticipate return to uptrend and price discovery phase.
Will XRP reach $3?
XRP at
$2.19-$2.24 after 9% Monday rally has returned to former support/current
resistance zone $2.18-$2.29. According to my technical analysis, this two-day
bounce appears corrective within longer-term bearish structure.
Should I buy crypto during
the dip?
This
depends on timeframe and risk tolerance. Bullish case: Fed rate cut odds 82%
for December, extreme fear (contrarian signal), institutional flows (BlackRock
ETH, XRP/DOGE ETFs $94M), technical oversold bounce, Kruger notes “Bitcoin
historically rewarded conviction during volatility” with pullbacks
“frequently preceding powerful moves to new highs.”
Are we in crypto bear
market?
Yes.
Bitcoin death cross, Ethereum death cross (50 EMA above 200 EMA), my technical
analysis targeting Bitcoin $74K/Ethereum $1,400, XRP and Dogecoin death
crosses, Paul Howard notes whale selling and institutional liquidation ongoing,
no $100K expected before Q1 2026.
Before you go, please also check my previous analyses and articles about crypto and gold:
Jakarta, Pintu News – Dogecoin has experienced a consistent decline since its peak in November 2024. There was a brief attempt at recovery in September 2025, but it quickly lost momentum and DOGE continued to slide, hitting a yearly low earlier this month.
However, late last week, DOGE finally experienced a price bounce, following the rebound trend that also occurred in a number of other meme coins such as Fartcoin . One of the main triggers that allegedly drove this rise was the launch of Grayscale’s Dogecoin ETF(exchange-traded fund), which officially started trading today.
ETF debuts usually attract an influx of institutional funds, and ETF launches for other cryptocurrencies have sparked short-term rallies in the past. Now, traders are watching closely to see if the Dogecoin ETF will have a similar positive effect, or if this bounce will end like previous rebounds that failed to hold.
On November 25, 2025, Dogecoin saw a 1.94% gain over the past 24 hours, trading at $0.1515 — approximately IDR 2,518. During this period, DOGE fluctuated between IDR 2,401 and IDR 2,565.
At the time of writing, Dogecoin’s market capitalization is estimated at around IDR 380.8 trillion, with a 24-hour trading volume of roughly IDR 28.23 trillion.
Dogecoin ETF triggers price rally
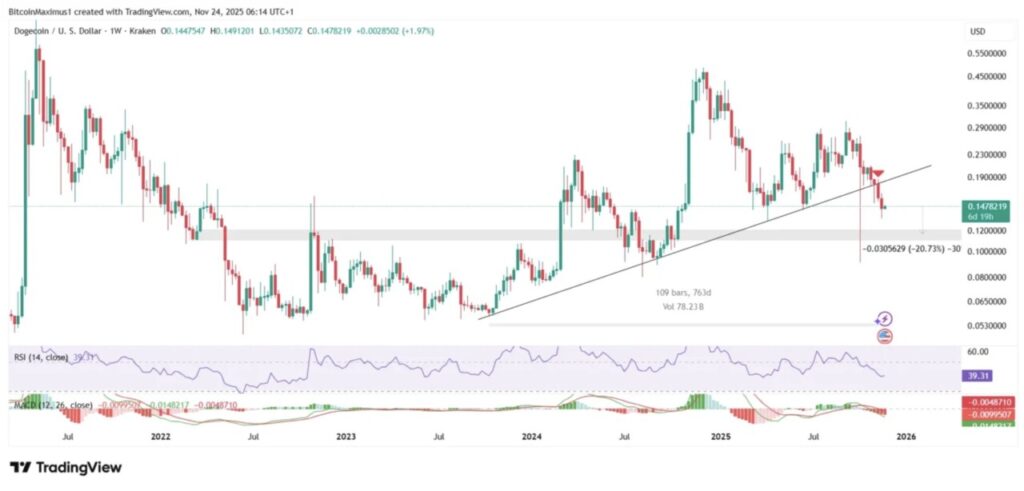
Since early September, Dogecoin (DOGE) has formed afive-wave decline pattern, with the last wave forming a diagonal ending pattern-a patternthat is often considered a sign that the downtrend is starting to lose steam.
This pattern is important because the ending diagonal usually appears at the end of a major selling phase and can be an early signal that the momentum direction is starting to reverse. Currently, the momentum indicator is starting to support the possibility of such a reversal.
The Relative Strength Index (RSI) indicator shows a bullish divergence, which is when the price prints a new low, but the RSI forms a higher low. This is a classic signal that selling pressure is starting to weaken.
The RSI is also approaching the key level of 50. If it manages to break above this level, it usually signals the beginning of a trend reversal. In addition, the Moving Average Convergence/Divergence (MACD) indicator is also showing a similar divergence.
If the Dogecoin price manages to break out of the wedge pattern formed, a quick spike to the horizontal area around $0.20 is highly likely. This breakout would confirm the end of the five-wave bearish pattern.
Rotational moves in the memecoin market like this often trigger sharp rallies in DOGE, as traders get back into the biggest meme coins by market capitalization.
Long-term Trend Still Bearish
Although the short-term chart gives hope for a price bounce, the weekly chart shows a clear bearish trend.
The weekly chart shows the moment when the trend turned down (marked by the red icon). In November, Dogecoin broke the upside support trend line that had been in place for 763 days. This was significant because it signaled that the uptrend of the past two years was over.
As a result of this breakout, traders are now eyeing a potential drop towards $0.115, which is the nearest horizontal support area – about 20% below the current price.
Momentum indicators reinforce this negative view. The RSI dropped below the 50 level, indicating the dominance of the bearish trend. This signal becomes even stronger when combined with the MACD movement, which has also turned negative, confirming the change in trend direction.
If these signals continue, Dogecoin will most likely continue to fall in the long term, with a downside target of at least the $0.115 range.
Why is the Dogecoin price rising?
The main reason why Dogecoin surged over the weekend and continues to rise today is the launch of Grayscale’s Dogecoin ETF which is scheduled to officially launch today.
ETFs like this usually attract liquidity from institutional investors, which can push asset prices up significantly. Given the bullish short-term technical signals, the price of DOGE has the potential to break out of the wedge pattern and rise to the $0.200 area.
However, the long-term projection still remains bearish. Dogecoin is expected to weaken again and most likely drop to the next support level around $0.115.
Traders are advised to closely monitor the movement of DOGE – specifically whether the price manages to break out of the wedge pattern, and then watch the market reaction at the $0.20 area as the next key level.
That’s the latest information about crypto. Follow us on Google News to get the latest crypto news about crypto projects and blockchain technology. Also, learn crypto from scratch with complete discussion through Pintu Academy and stay up-to-date with the latest crypto market such as bitcoin price today, xrp coin price today, dogecoin and other crypto asset prices through Pintu Market.
Enjoy an easy and secure crypto trading experience by downloading Pintu crypto app via Google Play Store or App Store now. Also, get a web trading experience with various advanced trading tools such as pro charting, various types of order types, and portfolio tracker only at Pintu Pro.
*Disclaimer
This content aims to enrich readers’ information. Pintu collects this information from various relevant sources and is not influenced by outside parties. Note that an asset’s past performance does not determine its projected future performance. Trading crypto carries high risk and volatility, always do your own research and use cold hard cash before investing. All activities of buying and selling bitcoin and other crypto asset investments are the responsibility of the reader.
Solana is back in focus as traders position themselves ahead of the upcoming Fed decision, hoping the market finally gets the spark it needs.
The SOL price today hovers near key resistance, and investor sentiment is shifting as ETF inflows rise and network upgrades progress.
With institutional demand growing and volatility tightening, many are asking the same question: does Solana have enough strength to make a real push toward $200 again?
Solana Price Prediction Faces Bearish Pressure But Bulls Stay Active
Solana is back on traders’ radar as fresh institutional flows push optimism higher ahead of the upcoming Fed interest rates decision due this week. The latest SOL news shows momentum building again, with Solana spot ETFs from Bitwise, Grayscale, Fidelity, VanEck, and 21Shares pulling in $476 million over 17 straight days.
This strong demand has started shaping a new SOL price prediction as investors speculate whether the network can regain enough strength to make a run toward $200.
On-chain Solana news also highlights an active governance vote aiming to speed up Solana’s supply-curve reduction, a move that could support long-term value. Meanwhile, Coinbase’s acquisition of Vector, a Solana-based DEX, is expanding trading tools and attracting more institutional users.
Still, the short-term picture remains complicated. Indicators show bearish pressure, even though the SOL price today sits near zones where oversold signals usually spark relief rallies. Momentum remains weak, but several oscillators suggest the downside could be limited. Many traders now expect consolidation before any decisive move.
For now, the key Solana price prediction hinges on one thing — whether Solana can hold support above $121 and maintain its current break above $133. If buyers return before the Fed announcement, the path toward $150 becomes clearer, with $200 still possible if ETF inflows continue.
Token
Remittix
Solana
Token Profile
Emerging PayFi project focused on real-world money movement
Established Layer-1 blockchain known for speed and low fees
Primary Use Case
Instant crypto-to-fiat settlements, global payments, business APIs
Remittix Builds Strength Ahead Of Major Exchange Listings
As traders debate whether Solana has enough strength to reclaim $200 ahead of the Fed decision, Remittix is becoming the unexpected winner in the background. While SOL news focuses on ETF inflows and governance changes, some investors are taking a close look at Remittix. The reason is simple. Remittix offers real payment utility at a time when the market is tired of speculation.
The project is building a full PayFi system that lets users convert crypto to fiat and send money globally in minutes. It supports more than 100 cryptocurrencies and offers instant settlement. It also removes the foreign exchange fees that frustrate freelancers, remote workers, and businesses.
Its traction grows because Remittix is delivering real progress:
Confirmed listings on BitMart and more top exchanges coming
Built for a global payments market worth more than $19 trillion
Investors say the combination of transparency, product readiness, and global demand makes Remittix one of the most credible new entrants. Momentum increased further after the team launched a referral system that gives users 15% of each referred purchase in USDT, claimable daily.
While traders debate the next Solana price prediction, Remittix is gaining long-term positioning with payment-focused investors. If utility becomes the main theme of the year, RTX could be the real outperformer.
Discover the future of PayFi with Remittix by checking out their project here:
Early crypto projects come with higher risk since their teams, technology, and market depth are not yet proven. Strong audits, transparent founders, and real utility reduce that risk, but investors should still approach early projects with caution.
What catalysts could push Solana higher?
Solana could climb if ETF inflows continue, on-chain activity rebounds, and its governance proposal to reduce token issuance passes. Institutional adoption and Coinbase’s new Solana trading integrations may also give the network fresh momentum.
This is a sponsored article. Opinions expressed are solely those of the sponsor and readers should conduct their own due diligence before taking any action based on information presented in this article.
XRP has climbed back above the $2 threshold after a volatile week, drawing renewed market interest as traders assess whether improving technical conditions can support a move toward the $3 region.
The rebound follows a sharp correction below $1.80, and current price action now reflects a blend of cautious optimism and structural uncertainty—conditions that typically precede major directional moves in the XRP market.
XRP Price Today: Key Levels to Watch
As of November 23, 2025, XRP is trading around $2.04, up 6.4% in the last 24 hours, though it remains down 10.2% week-over-week and 16.5% on the month. The token is still trading more than 45% below its July 2025 all-time high, underscoring the scale of the prior correction.
Analysts from the crypto market data group CRYPTOWZRD, which tracks high-timeframe liquidity flows, note a significant sell wall between $2.00 and $2.10.They explain that a daily close above $2.10 would mark a meaningful shift in short-term sentiment, as this zone has acted as a liquidity barrier during recent attempts to reclaim higher levels.
Approximately 1.80 billion XRP were accumulated near $1.75, establishing it as a significant support level. Source: Ali Martinez via X
On-chain distribution data referenced by market analyst Ali Martinez, who frequently analyzes tokenholder clusters, suggests that roughly 1.8 billion XRP were accumulated around the $1.75 zone. This makes the level a structurally important support if the price weakens.
Should buying pressure persist, the next major resistance sits near $2.60, a region historically associated with high-volume trading activity.
Technical Indicators: Early Signals of a Potential Upside Move
Several short-term indicators point to improving momentum.Technical analyst QuantumFox (@QantaFox)—known for tracking breakout structures across major altcoins—notes that XRP’s 1-hour chart has recently broken above a descending triangle formation.
Instead of framing this as an imminent “explosive” move, a more evidence-based interpretation is
The post highlights a potential XRP breakout above $2.05 as the price rebounds to $2.04, while replies debate regulatory needs and mock an earlier missed $5 forecast. Source: QuantumFox via X
If the breakout is confirmed by sustained volume and a closing price above $2.10, the current structure could support a continuation toward the mid-$2 range and potentially higher targets.
This aligns with a broader pattern seen in XRP’s prior compression phases—for example, the late-2023 consolidation period, when XRP required multiple days of elevated volume before clearing a major resistance pivot.
How Market Catalysts Influence XRP’s Price Dynamics
Recent market developments are contributing to improved sentiment, though their impact varies:
Ripple’s $500M Investment Announcement
Ripple’s commitment of $500 million to expand infrastructure and partnerships may increase long-term confidence.While such investments don’t directly affect price, they often influence trader psychology by signaling strong ecosystem support and reinforcing expectations for future network growth.
Reduced XRP Availability on Binance
Binance’s XRP balance has reportedly declined to 2.785 billion tokens, according to exchange reserve trackers.
Lower supply on major exchanges can tighten liquidity—especially during periods of rising demand—and historically this has improved the probability of sustained rallies.However, the effect depends on whether broader market conditions continue to favor risk assets.
Historical Patterns: What They Suggest—and Their Limitations
XRP has a history of extended consolidation followed by sharp trend expansions. Last year’s 400% rally occurred after a multi-week base and coincided with favorable liquidity conditions.
Analysts cite Fibonacci extensions to outline potential targets:
These levels are technically relevant because they often align with profit-taking zones and trend exhaustion points during strong momentum phases.
Last year’s 400% post-consolidation rally suggests that, if similar conditions align, XRP could again approach the $3.40 Fibonacci 1.272 level and potentially the $4.30 1.618 extension. Source: Randal255 on TradingView
However, current market conditions differ from prior cycles—regulatory scrutiny remains elevated, liquidity is fragmented, and macro volatility is higher. Therefore, historical performance should be viewed as context, not a guarantee.
Short-Term Risks: What Could Invalidate the Bullish Setup
Despite positive momentum, multiple risk factors could interrupt upside progress:
1. Resistance Clusters: A dense block of limit orders between $2.00 and $2.10 could stall the rally if buying pressure weakens.
2. Low-Volume Nodes: Regions quickly passed during prior rallies may attract retests, causing short-term pullbacks.
3. CVD (Cumulative Volume Delta) Divergence: If CVD shows buyers losing strength while price rises, it may signal absorption—a common precursor to a retracement.
XRP is rallying, but clustered limit orders may trigger a pullback into low-volume areas; I’m watching CVD and price action for a potential short. Source: DrStrangeTrades on TradingView
What would invalidate the bullish case?
A daily close below $1.90, indicating failed breakout confirmation
Volume is declining during upward movement
Rejection at $2.10 accompanied by a strong sell-side delta
Such signals would point toward consolidation or renewed downside pressure before any attempt to reclaim higher levels.
Final Thoughts
XRP’s return above the $2 mark reflects a stabilizing market structure after weeks of volatility. With a major resistance band between $2.00 and $2.10, upcoming price action will determine whether the token can build enough momentum to attempt a push toward the mid-$2 region and, eventually, the $3 tier.
XRP was trading at around 2.06, up 0.73% in the last 24 hours at press time. Source: XRP price via Brave New Coin
Technical indicators, historical context, and improving market catalysts offer a cautiously bullish backdrop—but risks remain.
For traders, monitoring volume trends, CVD, and daily closes around key resistance levels provides the clearest guidance on whether the current recovery can evolve into a sustained breakout.


 & Altcoins fall as extreme fear grips crypto market – Bitget CEO explains why recovery could come soon")
 Price Prediction: Pepenode (PEPENODE) Gains")
 Price Prediction: Maxi Doge (MAXI) Rides")