The main tag of Crypto News Articles.
You can use the search box below to find what you need.
[wd_asp id=1]

21 11, 2025

Solana Price Prediction 2025

By |2025-11-21T14:29:09+02:00November 21, 2025|Crypto News, News|0 Comments

Solana trades at $127.45, down 31% last 30 days, as fresh volatility shakes the altcoin market. Yet behind that pullback, institutional demand tells a different story. Six new spot Solana ETFs have gone live, each offering unique exposure models. This sharp split between price action and capital flow has turned SOL into one of the most-watched tokens in late 2025. Traders now ask one thing: can these inflows trigger a trend reversal?

ETF Momentum Fuels Institutional Exposure

Solana-based ETFs are expanding fast. 21Shares’ new spot ETF goes live, following its Cboe approval and a competitive 0.21% management fee. Fidelity entered the market with FSOL on NYSE Arca. It includes a staking component and quickly positioned Fidelity as the largest traditional manager offering a SOL product.

VanEck, Canary Capital, Bitwise, and Grayscale now round out the ETF lineup. Combined, SOL ETFs already hold more than $2 billion. That number grows even as SOL’s price falls. Interesting, right? ETF inflows reached $26.2 million on November 18, marking the 15th straight positive day.

When ETFs absorb capital during sell-offs, it often signals long-term conviction. It makes you wonder: are institutions preparing for a deeper move next year?

Bullet points worth noting:

  • SIX U.S. spot SOL ETFs now trade

  • Staking-enabled ETFs attract yield-driven participants

  • Zero-fee launhes from some issuers heighten competition

  • ETF inflows outpace those of BTC and ETH this week

This dynamic signals belief in Solana’s throughput, cost efficiency, and maturing ecosystem.

Why SOL Attracts Institutions

A few themes drive this pivot:

  • Solana’s fast confirmation speeds

  • High-stakes yield appeal

  • A real ecosystem of DeFi, NFTs, and consumer apps

  • Strong developer retention

Institutions love efficiency. Solana offers that. Even with price weakness, institutions keep allocating. They view SOL as a high-conviction play heading into 2026.
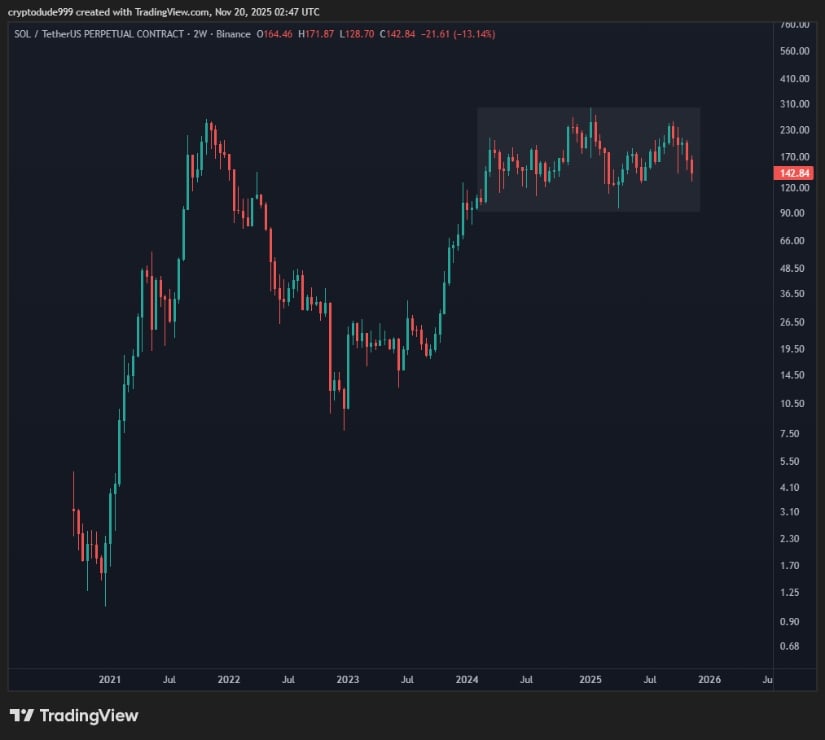
Technical Analysis

SOL sits on a strong ascending-trendline support. This support has been held many times this year and the current retest comes after liquidity grabs near $127, which often mark local swing points.

Source: X

If support holds:

  • First target: $253

  • Second target: $295

  • Breaks above these confirm new highs in 2026

If support fails:

  • Demand zone: $110–$100

  • Failure of that zone: drop toward $80

Clear levels. Clear reactions. This is why traders eye this zone so closely.

Prediction Table (2025)

Nov 2025 $115 $130 $150
Dec 2025 $118 $138 $165
2025 Full Year $110 $190 $295

Open Interest Collapse
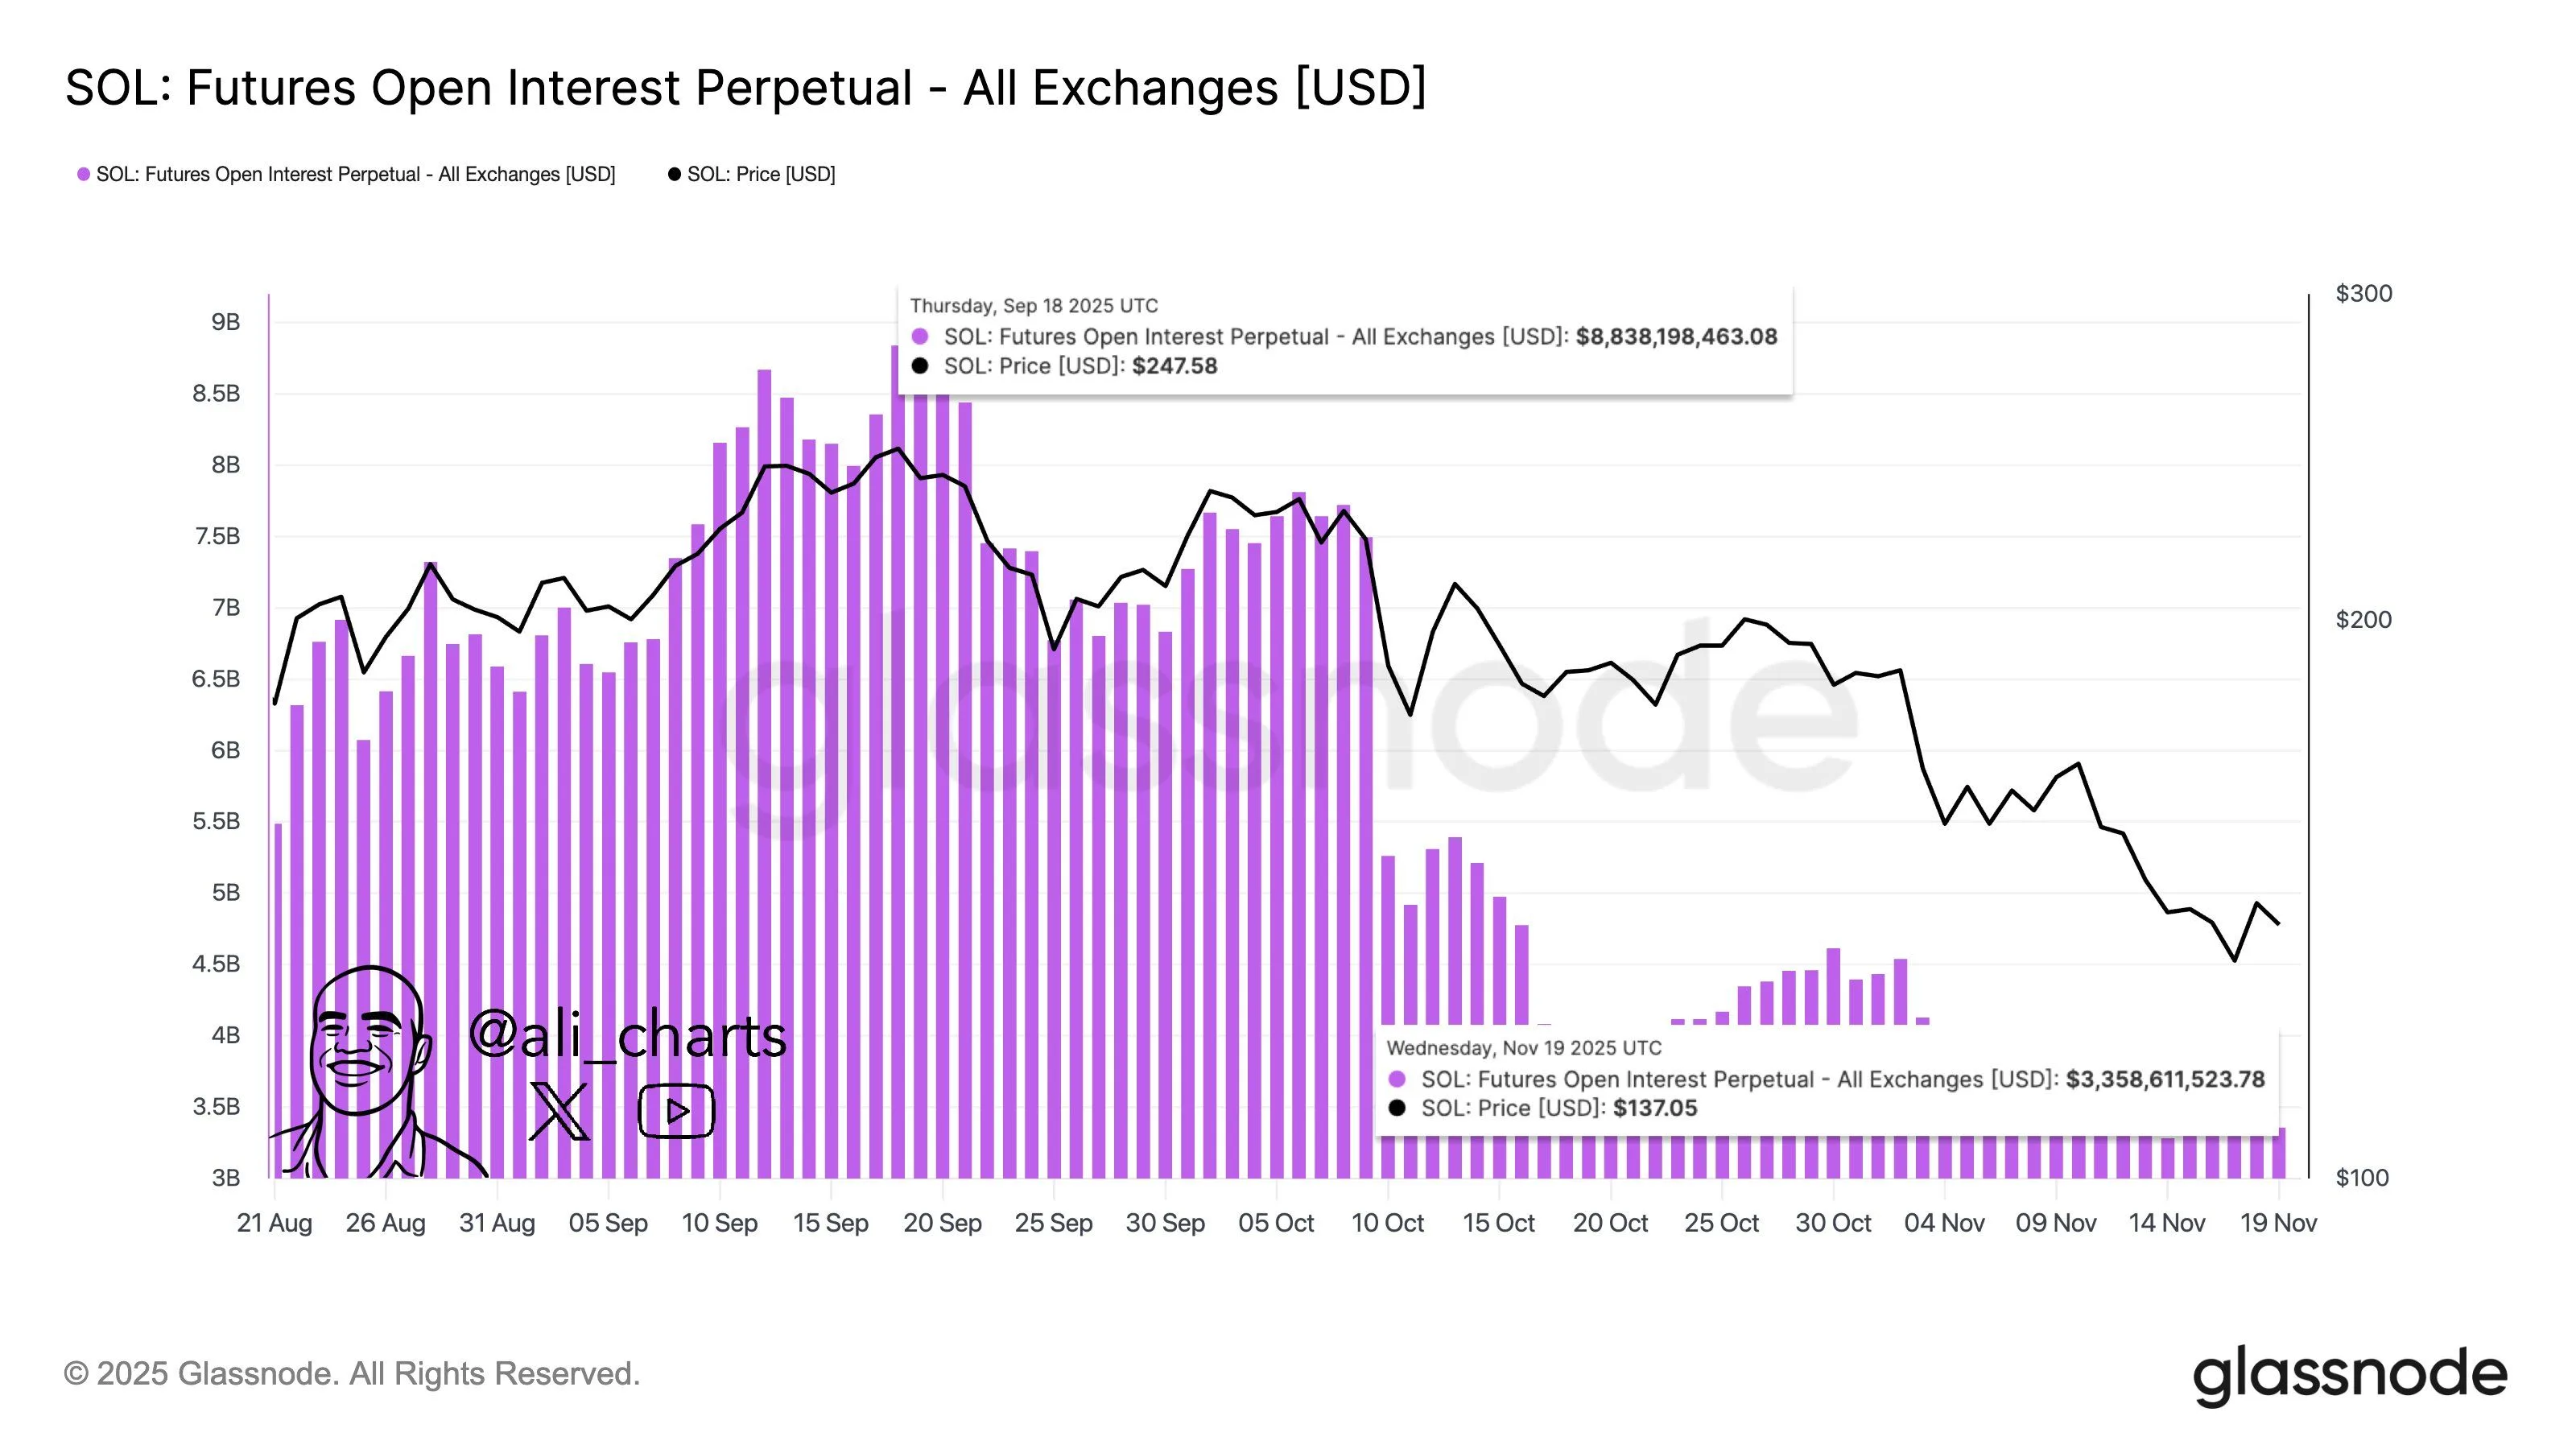
Source: X

Open interest dropped from $8.84B to $3.36B over three months as stated in X by Ali Charts. That’s huge. But what does it mean?

  • Less speculation

  • Reduced leveraged positions

  • More spot-driven movement

  • Potential for sharp volatility bursts

OI resets often precede trend reversals. When price holds support during OI collapses, strong rallies can follow. But if both collapse together, deeper selling can unfold. Therefore, monitor how OI behaves near $127 support.

Market Context and 2025 Outlook

The launch of multiple ETFs in a single week creates a strong setup for Solana’s next cycle. Inflows show that institutions believe SOL can mirror Bitcoin’s ETF-driven breakout from 2024. The symmetrical-triangle structure that has formed over the past year still holds. A bounce at current support keeps the pattern intact and sets the stage for a higher-timeframe reversal.

The question everyone asks: can SOL replicate a similar 10x ETF rally? The answer depends on the strength of this support zone, ETF inflow consistency, and macro sentiment into Q1 2026.

Solana’s ecosystem growth, staking appeal, and real demand make it one of the strongest altcoins heading into next year. For now, traders watch the chart. Institutions watch inflows. The next move likely comes from whichever group acts first.

Source link

21 11, 2025

Dogecoin Price Drops 2% Today: Will DOGE Hold at $0.15 or Plummet Lower?

By |2025-11-21T12:28:18+02:00November 21, 2025|Crypto News, News|0 Comments

Jakarta, Pintu News – The Dogecoin price has recently struggled to stay above the $0.15 level, having recorded a 12% decline in the past week. The crypto asset has also failed to hold an important support level of $0.20, further reinforcing the downward trend.

This drop reflects the broader negative trend in the crypto market, which fell by 1.95% in the past 24 hours and 12% over the past week. The falling prices of major cryptocurrencies such as Bitcoin , Ethereum , Solana , Cardano , and XRP also signal weakening overall market conditions.

Dogecoin Price Drops 2.36% in 24 Hours

Source: Pintu Market

On November 21, 2025, Dogecoin experienced a 2.36% correction over a 24-hour period, with its price settling at $0.1521, or approximately IDR 2,529. Throughout the day, DOGE traded within a range of IDR 2,664 to IDR 2,451.

At the time of writing, Dogecoin’s market capitalization is estimated at around IDR 387.37 trillion, with a 24-hour trading volume reaching approximately IDR 39.61 trillion.

Read also: Dogecoin (DOGE) to Surge Above $0.20? Check out the Latest Analysis!

Dogecoin price approaches important technical zones, potentially experiencing a surge

The Dogecoin price is currently approaching a crucial technical level as it is on the verge of forming a bearish pattern. Dogecoin’s price movement pattern suggests a possible exit from this structure, which has previously been accompanied by significant price spikes.

This meme coin is also still holding in an important support zone, which is one of the supporting factors for a potential price recovery.

Based on the analysis, if Dogecoin manages to break out of the wedge pattern (narrowing downward pattern), the coin has a chance to experience a surge like the previous rally, which could even increase by more than 430%.

Dogecoin Price Drops 2% Today: Will DOGE Hold at alt=
Source: TradingView via Coingape

With market conditions starting to move in a favorable direction, investors are now closely monitoring whether DOGE is capable of repeating the big surge or creating a significant new rally.

21Shares Launches Dogecoin ETF with Leverage

21Shares has just launched a leveraged ETF that tracks the movement of Dogecoin. The ETF is designed to provide twice the performance of Dogecoin’s daily movements, but the investment result is reduced by the associated fees and expenses.

Read also: Bitcoin Price Drops to $88,000 — Is a Major Rebound Coming, According to On-Chain Data?

The launch coincides with FalconX’s acquisition of 21Shares, which aims to combine expertise in institutional trading and ETFs. Through this acquisition, FalconX is looking to expand its operations in the United States, Europe, and Asia-Pacific regions by leveraging 21Shares’ capabilities in crypto ETF products.

Russell Barlow will remain as CEO of 21Shares, which will continue to operate independently under FalconX. This is the second acquisition for FalconX after previously acquiring Arbelos Markets and Monarq Asset Management.

What’s Next for DOGE Price?

Dogecoin’s current price has decreased by about 1%, and is at $0.1506. If the Dogecoin price drops below the $0.15 level, it will most likely test the next major support around $0.14.

Conversely, if DOGE manages to maintain or reclaim the $0.15 support level, then the next area of resistance is expected to be in the range of $0.17 to $0.18, based on the full Dogecoin price prediction report.

The Moving Average Convergence Divergence (MACD) indicator shows bearish pressure. The MACD histogram indicates a downward trend as the blue line is below the orange line.

Source: TradingView via Coingape

Meanwhile, the Average Directional Index (ADX) indicator, which stood at 36.57, shows that the market trend is quite strong. The figure also hints at a clear direction of market movement, which in this case tends to reinforce the potential bearish pressure.

That’s the latest information about crypto. Follow us on Google News to get the latest crypto news about crypto projects and blockchain technology. Also, learn crypto from scratch with complete discussion through Pintu Academy and stay up-to-date with the latest crypto market such as bitcoin price today, xrp coin price today, dogecoin and other crypto asset prices through Pintu Market.

Enjoy an easy and secure crypto trading experience by downloading Pintu crypto app via Google Play Store or App Store now. Also, get a web trading experience with various advanced trading tools such as pro charting, various types of order types, and portfolio tracker only at Pintu Pro.


*Disclaimer

This content aims to enrich readers’ information. Pintu collects this information from various relevant sources and is not influenced by outside parties. Note that an asset’s past performance does not determine its projected future performance. Crypto trading activities have high risk and volatility, always do your own research and use cold cash before investing. All activities of buying and selling bitcoin and other crypto asset investments are the responsibility of the reader.

Reference:


Source link

21 11, 2025

ADA Is Sleeping. $NNZ Coin Is the Awake and Aggressive Presale Bet

By |2025-11-21T10:27:10+02:00November 21, 2025|Crypto News, News|0 Comments

($NNZ) continues to accelerate through its structured 28-stage presale. Just days ago, the price moved from $0.0000151 to $0.0000187, triggering Stage 4, with Stage 5 expected soon if buying pressure remains consistent.

Current presale metrics:

  • Token holders: 164

  • Total raised: $33,569.93

The project’s design is the core of its appeal. Unsold tokens are burned at every stage close, liquidity will be locked at launch, and the supply is fixed at 280 billion $NNZ. The referral system adds an extra layer of fair growth by granting 10 percent bonuses to both the referrer and the buyer, with rewards delivered instantly.

Whales are paying attention to Noomez because it offers structured catalysts such as the Noom Gauge, Vault events, Stage X Million Airdrops, and the Noom Engine.

The presale concentrates the strongest potential gains, creating a cycle that is already generating crazy early traction. For those aiming to enter before stage progression accelerates, many traders are choosing to buy from their official site and position ahead of the next pricing jump.

Source link

21 11, 2025

Mt. Gox Shifts $953M in BTC, DSNT Pumps 58% as Presale Snipers Inject Over $555k in Stage 2

By |2025-11-21T08:25:37+02:00November 21, 2025|Crypto News, News|0 Comments

Crypto markets are on edge after Mt. Gox suddenly moved 10,608 BTC worth $953M, its first major transfer in eight months. Fears are renewing about another possible liquidity shock.

Bitcoin is already under correction pressure, and institutional inflows are slowing. XRP price prediction models are now rapidly readjusting.

DeepSnitch AI continues to move higher despite the uncertainty unfolding in the crypto sector. Its presale is up 58% so far and has raised more than $555K. Traders are now relying on DeepSnitch AI for monitoring whale wallets like Mt. Gox, so they can make decisions before the masses.

Mt. Gox’s $953M Bitcoin move sparks fresh sell-off anxiety

The defunct Japanese exchange transferred 10,608 BTC to a new wallet, which is its first major move since March. Large Mt. Gox movements have led to BTC sell-offs in the past.

Mt. Gox still holds 34,689 BTC, which is more than enough to shake market liquidity if even a fraction hits exchanges.

Mt. Gox has yet again pushed back the timeline for giving creditors their Bitcoin back. The deadline is now October 31, 2026, so the BTC supply won’t hit the open market any time soon.

The sudden whale-sized movement raises concerns that Mt. Gox might be getting ready to liquidate some of the remaining stash that would add pressure to markets that are already fragile.


Mt. Gox Shifts 3M in BTC, DSNT Pumps 58% as Presale Snipers Inject Over 5k in Stage 2DeepSnitch AI hasn’t flinched. Its presale momentum is climbing despite the chaos. Its trajectory is steadily going upwards. Early-stage coins look safer than big caps during panic dips. There’s also the powerful suite of trading tools that are vital for presale investors looking to navigate an uncertain market.

DeepSnitch AI: The panic-proof play of 2025

DeepSnitch AI isn’t impacted by market swings, so its presale is steadily ticking upwards with more than $555K raised to date. Presales feed on momentum rather than react to whale moves.

Traders are relying on the five autonomous AI agents that scan whale wallets, sentiment, and liquidity changes 24/7. These tools eliminate the information gap. What used to be institutional-only intelligence is now available to everyday traders.

Many people are now seeing early-stage projects with high upside. The problem with this approach is knowing which projects are trustworthy and which to avoid.

DeepSnitch AI’s AuditSnitch is the perfect tool for these individuals. It allows you to analyze token data to check to see if it’s sketchy or legit. This means you can avoid scams and focus on projects that can deliver real value.

DeepSnitch AI is one of the few early-stage plays that traders genuinely believe could deliver 100x upside. It’s still at an early stage, which is why many people are fleeing from high-cap coins and into the DeepSnitch AI presale before it’s too late to get the big upside.


2. XRP price prediction: $3 target returns as liquidity rotates

The recent crypto market volatility has led to a big uptick in demand for XRP price prediction models. XRP often catches the flight from Bitcoin to mid-cap coins when there are major BTC whale events like the Mt. Gox news.

Long-term catalysts remain intact for Ripple despite the short-term noise. Traders see the volatility as a chance to revisit aggressive XRP price prediction targets.

There is still a good level of XRP institutional adoption, so the XRP long-term outlook remains strong even during market turbulence. XRP price prediction models point towards a run back towards $3 from the current $2.15 levels in the short term. Its aggressive expansion and gradual global regulatory clarity mean that the XRP future value outlook is bright.

3. Bitcoin: Wobbles as Mt. Gox moves $953M in BTC

Some analysts immediately warned that Mt. Gox was preparing to sell. So far, there has been no moving of funds from the wallet to exchanges. BTC is still holding the $90K to $92K range also.

The continuing market uncertainty means that more BTC volatility is likely ahead. Another unexpected macro shock or unexpected Mt. Gox sales could lead to a BTC correction zone of $72K to $82K. The bull case is a possible rally in the medium term past the $150K mark if there’s whale accumulation and Fed rate cuts.

Final verdict: Mt. Gox shakes BTC, but DeepSnitch AI stays strong

The Mt. Gox wallet activity created a new level of uncertainty across the crypto market. BTC wobbled, and every major XRP price prediction had to readjust.

DeepSnitch AI kept climbing while everything else wobbled, and that’s exactly why investors are paying attention. It’s up 58% so far and has plenty of runway left. Traders see this as an asymmetric play that has the potential to skyrocket 100x.

Visit the official DeepSnitch AI presale page today.

FAQs

Why is DeepSnitch AI getting so much attention right now?

Presales aren’t correlated to BTC fear or XRP institutional adoption, so DeepSnitch AI is gaining in utility and hype.

What is DeepSnitch AI’s upside?

Unlike the moderate XRP price prediction, it offers early-stage gains that established coins can’t match, which is why analysts see it as having 100x potential.

Why are investors moving toward presales over established coins?

Investors are looking for price stability, rising demand, and early-stage exponential upside.

Source link

21 11, 2025

Solana Price Prediction: SOL Leads Market Recovery as Double-Bottom Eyes a Push Towards $160

By |2025-11-21T06:25:00+02:00November 21, 2025|Crypto News, News|0 Comments

Solana price is showing renewed strength across multiple timeframes, reclaiming key levels and attracting fresh attention as participants watch for confirmation of a sustained recovery.

The crypto market may still be mixed, but Solana price has quietly stepped into the spotlight with a sharp recovery that’s building momentum across several charts. From 4H trend reclaims to fresh double-bottom signals, SOL is starting to show the kind of structure traders look for at the start of a turnaround.

Solana current price is $137.46, down 2.48% in the last 24 hours. Source: Brave New Coin

Solana Price Leads the Market With Strong 4H Recovery

Solana Price continues to outperform the broader market, reclaiming the 4H trend level ahead of every other major asset. The chart shared by Trader Cobb shows SOL breaking above short-term resistance near $143–$145, with price now trading firmly above the EMA cluster, signalling momentum rotation back to the upside. The candle expansion is clean, the wicks are tight, and buyers are clearly stepping in with conviction.

Solana Price Prediction: SOL Leads Market Recovery as Double-Bottom Eyes a Push Towards 0

Solana reclaims its 4H trend ahead of the entire market, signaling renewed strength as buyers step back in with conviction. Source: Trader Cobb via X

One key detail is that SOL didn’t just bounce, it reclaimed a level, which is far more meaningful. Historically, when SOL Solana price takes back the 4H structure before its peers, it tends to lead the next rotation leg. This early reclaim strengthens the case that buyers may be regaining control after weeks of heavy distribution.

Double-Bottom Structure Eyes a Push Towards $160

Momentum extends further on the intraday chart shared by GTradeCrypto, where Solana price has now broken the descending channel while simultaneously forming a textbook double bottom around $131 to $133. Both lows are clean, reactive, and supported by oversold readings on RSI. This combination often forms the foundation for strong continuation moves.

Double-Bottom Structure Eyes a Push Towards $160

Solana breaks its descending channel and forms a clean double bottom, setting sights on the $160 measured-move target. Source: GTradeCrypto via X

The measured move target from the double-bottom pattern points directly towards $160, which aligns with the upper channel boundary and the next high-volume node. With SOL now trading around $140, the short-term resistance to clear sits around $146–$148. If bulls hold these reclaimed levels, the path towards $160 becomes far more attainable.

Strong Bullish Triggers Continue to Support Sentiment

Away from charts, the broader fundamentals shared by Solana Sensei highlight a string of bullish catalysts that continue to accumulate. Solana remains #1 in app revenue, #1 in DEX volume, and has now achieved over 650 days of uptime, proving its stability. Even more importantly, multiple major institutions, including Fidelity, VanEck, Canary, and 21Shares, now have SOL ETFs live or approved.

This steady stream of ecosystem growth is likely to have an important impact on SOL’s price as well. Moreover, these structural positives help strengthen the medium-term outlook for SOL as well.

On-Chain Volume Supporting Bullish Bias

Vibhu’s data highlights one of Solana’s most impressive developments: SOL/USDC on-chain volume outpaced all centralized exchanges combined. This is a significant milestone, and it speaks to behavioral change across participants who increasingly prefer Solana’s low-fee, high-speed environment over CEX trading.

On-Chain Volume Supporting Bullish Bias

Solana’s on-chain SOL/USDC volume surpasses all major CEXs for the first time. Source: Vibhu via X

The shift has been building for months, but last week’s spike marks the first time on-chain liquidity surpassed aggregated CEX liquidity. This type of inflection is often a precursor to long-term market share dominance. It also highlights that even during drawdowns, Solana’s real activity continues to expand.

Solana Price Prediction: Cup-and-Handle Structure Developing

While some market participants point to a potential head-and-shoulders formation, the chart shared by the dude suggests another interpretation: a developing cup-and-handle structure. The weekly range between $128–$180 remains intact, and despite volatility, Solana price has not broken below the key macro support band.

Solana Price Prediction: Cup-and-Handle Structure Developing

Solana continues to defend its weekly range as a potential cup-and-handle pattern forms, keeping the broader bullish structure intact. Source: dude via X

The bearish scenario requires a return to double-digit, a view that historically would imply a market cap below $50B, which remains a stretch given the strength of Solana’s fundamentals. From a technical standpoint, as long as the base of the range stays protected, the structure remains constructive and still leans towards the handle-completion breakout later in the cycle.

Final Thoughts: Can Solana Recovery Sustain?

Solana is once again positioning itself as one of the strongest large-cap performers. From early trend reclaims on the 4H to intraday double-bottom formations, the technical picture is improving across multiple timeframes. ETF inflows, growing user activity, and surging on-chain volume reinforce Solana’s position at the center of the market’s shift toward high-performance blockchains.

While short-term volatility remains part of the landscape, the deeper fundamentals and technical setups suggest SOL is preparing for a broader recovery phase. If buyers continue defending support zones and momentum sustains, the next leg towards $160–$180 becomes increasingly viable.


Source link

21 11, 2025

BTCUSD News Today, Nov 20: Bitcoin Trading Volume Surges Amid Renewed Interest

By |2025-11-21T04:24:07+02:00November 21, 2025|Crypto News, News|0 Comments

The Bitcoin trading volume has surged, drawing notable attention from investors and analysts in Singapore. As of today, BTCUSD is priced at $86,979.99, marking a slight decline from previous highs. The increase in trading activity suggests a possible shift in investor sentiment towards Bitcoin, which has experienced an 18.43% increase over the past year. This uptick in volume may indicate bullish tendencies as traders capitalize on price fluctuations in the cryptocurrency market.

Bitcoin Trading Volume Surge

Over recent days, Bitcoin trading volume has hit 1,599,846,314, surpassing its average of 1,017,515,369. This significant uptick highlights increased participation among traders. The renewed interest in Bitcoin is reflected in social media discussions and trading platforms, pointing to potential bullish behavior among investors. Bitcoin‘s current status in the market shows diverse opinions, but the rising volume signifies a potentially positive outlook.

Impact on Bitcoin Price

Despite the recent slide in Bitcoin’s price to $86,979.99, the trading volume indicates strong underlying interest. Historically, a surge in volume often precedes significant price movements. The slight uptick observed earlier in the week suggests that investors might be positioning for future gains. The year’s high of $126,296 shows potential for growth. However, the current technical indicators, such as the RSI at 28.01, suggest the asset is oversold, potentially positioning it for a rebound.

In the broader cryptocurrency market, trends indicate a growing acceptance and adaptation among investors. This aligns with global financial movements towards digital assets. Bitcoin’s role as a market leader makes its volume spikes significant for the overall sector. Recent forecasts put Bitcoin’s monthly target at $100,096.72, pointing to continued optimism. Although short-term volatility remains, the greater trajectory suggests positive longer-term trends.

BTC Price Prediction and Investor Sentiment

Market predictions for Bitcoin remain cautiously optimistic. Current forecasts suggest a potential climb to $138,747.08 in the coming quarter. Sentiment among traders might be mixed due to short-term hurdles, but long-term investors often see these downturns as buying opportunities. An investor on X commented, noting Bitcoin’s resilience and potential for gain beyond current levels. The market’s pulse suggests that investors are closely watching these developments as they plan their strategies.

Final Thoughts

For investors in Singapore, the recent surge in Bitcoin trading volume is a crucial indicator of market dynamics. Despite a short-term pullback in price, the increased volume reflects potential bullish trends and a confidence among traders betting on a future rally. This renewed interest might drive Bitcoin closer to its forecasted price targets, offering chances for strategic investments. Always stay informed about fluctuations and market sentiments. Platforms like Meyka provide timely financial insights to help navigate these changes effectively.

FAQs

What does a surge in Bitcoin trading volume mean?

A surge in trading volume generally means increased interest and activity in the market. This could indicate potential price movements as traders engage more actively.

How does Bitcoin’s oversold status affect its price?

An oversold status often suggests that Bitcoin is undervalued, which might lead to a price rebound as traders take advantage of lower prices to buy in.

What are the price predictions for Bitcoin?

Current forecasts suggest Bitcoin could reach $100,096.72 monthly and $138,747.08 quarterly, indicating positive investor sentiment despite short-term volatility.

Disclaimer:

The content shared by Meyka AI PTY LTD is solely for research and informational purposes. 
Meyka is not a financial advisory service, and the information provided should not be considered investment or trading advice.

Source link

21 11, 2025

Will This Explosive Crypto Hit $1?

By |2025-11-21T02:22:56+02:00November 21, 2025|Crypto News, News|0 Comments

BitcoinWorld

Polygon MATIC Price Prediction 2025-2030: Will This Explosive Crypto Hit $1?

As the cryptocurrency market continues to evolve, investors are closely watching Polygon MATIC for its potential growth. With the blockchain ecosystem expanding rapidly, many wonder if MATIC price can surge to the coveted $1 mark in the coming years. This comprehensive analysis examines the factors that could drive Polygon cryptocurrency to new heights.

What is Polygon MATIC and Why Does It Matter?

Polygon MATIC serves as a layer-2 scaling solution for Ethereum, addressing critical issues like high gas fees and slow transaction times. The platform has gained significant traction among developers and users seeking efficient blockchain solutions. Understanding the fundamentals of Polygon cryptocurrency is essential for making informed MATIC price prediction assessments.

Current MATIC Technical Analysis and Market Position

Recent MATIC technical analysis reveals several key patterns that could influence future price movements. The token has demonstrated resilience during market downturns while showing strong momentum during bullish periods. Key technical indicators to monitor include:

  • Support and resistance levels
  • Moving averages convergence
  • Trading volume patterns
  • Relative strength index readings

Polygon MATIC Price Prediction 2025: The Road to Recovery

Our Polygon MATIC analysis for 2025 suggests potential growth driven by several factors. The continued adoption of layer-2 solutions and ecosystem expansion could push MATIC price toward higher valuations. Market experts project a trading range between $0.80 and $1.20, depending on broader market conditions and specific Polygon developments.

Scenario Low Estimate High Estimate
Bearish Market $0.60 $0.85
Neutral Market $0.80 $1.10
Bullish Market $1.00 $1.40

MATIC Price Prediction 2026-2028: Sustained Growth Phase

The mid-term outlook for Polygon cryptocurrency appears promising as the platform continues to innovate. With potential mainstream adoption and technological advancements, MATIC technical analysis indicates steady appreciation. Key growth drivers include:

  • Enterprise adoption of Polygon technology
  • Expansion into new blockchain use cases
  • Strategic partnerships and ecosystem growth
  • Regulatory clarity in major markets

Long-term MATIC Price Prediction 2029-2030: Reaching New Heights

Looking toward the end of the decade, our Polygon MATIC forecast becomes increasingly optimistic. If current growth trajectories continue and the platform maintains its competitive edge, MATIC price could experience significant appreciation. The convergence of blockchain technology with traditional finance could create unprecedented opportunities for Polygon cryptocurrency.

Factors That Could Impact MATIC Technical Analysis

Several variables could influence the accuracy of any MATIC price prediction. Understanding these factors is crucial for comprehensive crypto investment decisions:

  • Overall cryptocurrency market sentiment
  • Regulatory developments worldwide
  • Technological advancements and platform upgrades
  • Competition from other layer-2 solutions
  • Ethereum network developments and their impact

Risks and Challenges in Polygon Cryptocurrency Investment

While the potential for growth exists, investors must consider the risks associated with MATIC crypto investment. Market volatility, regulatory uncertainty, and technological challenges could impact price trajectories. A balanced approach to Polygon MATIC investment should account for both opportunities and potential setbacks.

Expert Insights on MATIC Price Prediction Accuracy

Industry analysts emphasize that while technical analysis provides valuable insights, cryptocurrency markets remain inherently unpredictable. The most reliable MATIC price prediction models incorporate multiple data points and consider both fundamental and technical factors. Successful Polygon cryptocurrency investment requires continuous monitoring and adaptability.

FAQs About Polygon MATIC Investment

What makes Polygon different from other cryptocurrencies?
Polygon stands out as a layer-2 scaling solution specifically designed to enhance Ethereum’s capabilities, focusing on improved transaction speed and reduced costs.

How does MATIC technical analysis differ from other cryptocurrencies?
MATIC technical analysis considers both general market trends and specific platform developments, including network upgrades and adoption metrics unique to the Polygon ecosystem.

What is the current circulating supply of MATIC?
The circulating supply and total tokenomics are important factors in any MATIC price prediction, with specific details available through official Polygon documentation.

Can Polygon MATIC reach $5 by 2030?
While ambitious targets exist, reaching $5 would require significant market capitalization growth and widespread adoption beyond current projections.

Where can I safely purchase and store Polygon cryptocurrency?
MATIC is available on major exchanges including Binance, Coinbase, and Kraken, with storage options ranging from exchange wallets to hardware solutions like Ledger.

Conclusion: The Future of Polygon MATIC Investment

The journey ahead for Polygon MATIC presents both exciting opportunities and significant challenges. While reaching $1 appears achievable within the projected timeframe, sustained growth will depend on continuous innovation, market adoption, and favorable industry conditions. Investors should approach MATIC crypto investment with careful research and risk management strategies, recognizing both the potential rewards and inherent uncertainties in the dynamic cryptocurrency landscape.

To learn more about the latest cryptocurrency trends, explore our article on key developments shaping Polygon MATIC institutional adoption and blockchain innovation.

This post Polygon MATIC Price Prediction 2025-2030: Will This Explosive Crypto Hit $1? first appeared on BitcoinWorld.

Source link

21 11, 2025

Dogecoin Price Prediction: Key Market Insights, Strategic

By |2025-11-21T00:21:57+02:00November 21, 2025|Crypto News, News|0 Comments

Dogecoin Price Prediction: Key Market Insights, Strategic Investor Positioning

Rising interest in meme oriented assets has positioned Dogecoin as one of the more closely watched tokens entering 2025, especially as trading volumes strengthen and short term volatility draws new investors. The introduction highlights how community driven momentum, technical structure, and shifts in overall market confidence shape its current trajectory. It also emphasizes how Dogecoin fits into broader market patterns, giving investors a clearer sense of how its trend development compares to other popular assets in the crypto sector.

The influence of emerging projects like Bitcoin Hyper (https://bitcoinhyper.com/) is becoming increasingly relevant as new communities expand and attract significant attention from retail investors. Bitcoin Hyper (https://bitcoinhyper.com/) continues to gain traction through steady growth, stronger engagement, and rising visibility, which creates new competitive energy across the meme ecosystem. This dynamic can introduce both additional support and strategic pressure for Dogecoin depending on the broader cycle. The introduction explains how these evolving conditions reshape investor behavior and encourage more adaptive, forward looking strategies.

Current Dogecoin Market Trends, Volatility Signals, Trading Behavior, and Short Term Price Growth Scenarios

Current market movement around Dogecoin shows a blend of steady retail interest and recurring volatility phases that continue to define its short term performance. Trading activity has strengthened during periods of broader market optimism, allowing Dogecoin to capture liquidity spikes that often precede quick upward moves. At the same time, price pullbacks remain common due to profit taking and rapid sentiment shifts among short term traders. These fluctuations highlight the importance of monitoring volume surges, market depth, and social sentiment, since they frequently signal whether Dogecoin is preparing for consolidation or renewed acceleration.

Short term price growth scenarios for Dogecoin depend largely on how traders react to shifts in market momentum, especially during periods of heightened volatility. When buying pressure increases alongside improving sentiment, Dogecoin often experiences fast percentage gains driven by speculative behavior and community fueled engagement. However, if market conditions weaken or liquidity thins out, the token can easily enter corrective zones before recovering. Understanding these dynamics helps investors identify when the trend is building strength, when caution is needed, and how short term opportunities may form during rapid market rotations.

Key Technical Indicators, Momentum Shifts, Analyst Commentary, and Forward Looking Dogecoin Price Outlook

Key technical indicators surrounding Dogecoin often reveal early signals of trend direction, especially when market momentum begins to shift. Traders closely observe moving averages, relative strength patterns, and changes in trading volume to understand how strong or fragile the trend may be. Analyst commentary frequently highlights the importance of identifying whether Dogecoin is building bullish continuation or facing weakening momentum. These insights help investors recognize when the market is entering accumulation, preparing for breakout conditions, or cooling down after strong upward moves, allowing more informed decision making.

Forward looking outlook for Dogecoin depends on how these technical signals align with broader market sentiment and liquidity flows. When momentum indicators strengthen alongside improving fundamentals in the meme sector, Dogecoin often reacts quickly with accelerated price movement. Conversely, if indicators turn neutral or bearish, the token may enter slower consolidation phases before gaining direction again. Analysts emphasize that consistent monitoring of trend health, volatility structure, and psychological levels provides a clearer roadmap for future performance and potential price expansions during favorable cycles.

Key Technical Indicators:

Moving averages revealing trend strength and potential breakout zones

Relative strength patterns indicating overbought or oversold market conditions

Volume behavior showing shifts in market participation and directional confidence

Bitcoin Hyper: Rapidly Emerging Meme Token With Strong Utility, Expanding Community Support, and Increasing Market Recognition

Bitcoin Hyper (https://bitcoinhyper.com/) is gaining attention as a rapidly growing meme token that combines expanding utility with strong community momentum. Its current price is approximately 0.04883 USD, which places it in an accessible range for early investors seeking high growth potential. The project aims to merge meme culture with functional use cases, creating a more balanced position within the market. With increasing visibility, rising engagement, and broader recognition across the crypto space, Bitcoin Hyper is shaping a presence that appeals to both speculative traders and long term followers.

Further development of Bitcoin Hyper (https://bitcoinhyper.com/) depends on how well the team executes planned features, expands the ecosystem, and maintains strong communication with the community. Continuous interest from retail investors, along with growing demand during active market cycles, could support upward movement if the project delivers on its roadmap. The current price level invites attention from investors who see opportunity in early stage tokens with utility driven narratives. Analysts point out that its future trajectory will rely heavily on adoption, listing progress, and overall market sentiment.

How Dogecoin Mirrors Overall Crypto Market Psychology, Liquidity Flows, Investor Confidence, and Broader Sentiment Dynamics

Dogecoin often reflects the broader psychology of the crypto market because its movements closely follow shifts in liquidity, investor confidence, and general sentiment. When optimism rises across major assets, Dogecoin typically experiences stronger inflows as traders seek high energy tokens that respond quickly to market momentum. In periods of uncertainty, its price can soften just as fast, showing how reactive it is to emotional and speculative behavior. This sensitivity gives insight into how retail participants feel about the market, making Dogecoin a useful gauge for understanding crowd behavior, risk appetite, and short term sentiment cycles.

Buchenweg, Karlsruhe, Germany

For more information about Bitcoin Hyper (HYPER) visit the links below:

Website: https://bitcoinhyper.com/

Whitepaper: https://bitcoinhyper.com/assets/documents/whitepaper.pdf

Telegram: https://t.me/btchyperz

Twitter/X: https://x.com/BTC_Hyper2

Disclosure: Crypto is a high-risk asset class. This article is provided for informational purposes and does not constitute investment advice.

CryptoTimes24 is a digital media and analytics platform dedicated to providing timely, accurate, and insightful information about the cryptocurrency and blockchain industry. The enterprise focuses on delivering high-quality news coverage, market analysis, project reviews, and educational resources for both investors and enthusiasts. By combining data-driven journalism with expert commentary, CryptoTimes24 aims to become a trusted global source for emerging trends in decentralized finance (DeFi), NFTs, Web3 technologies, and digital asset markets.

This release was published on openPR.

Source link

20 11, 2025

ADA risks decline to $0.30 as whales begin selling

By |2025-11-20T22:20:53+02:00November 20, 2025|Crypto News, News|0 Comments

Cardano (ADA) is down 2% on Thursday as whales accelerate distribution. Despite the selling activity and price decline, ADA’s open interest has grown steadily over the past month.

Sustained weak prices force whales to begin distribution

Cardano whales flipped from accumulation to selling over the past week following sustained risk-off sentiments across the crypto market.

Wallets holding 10M-100M tokens reduced their collective holdings by 370M ADA in the past seven days. This cohort had been buying the dip since mid-October, only to exhaust their momentum last week.

ADA Supply Distribution. Source: Santiment

In particular, selling pressure accelerated on Wednesday, as indicated by a spike in the Age Consumed metric, which tracks the movement of older tokens.

The move also coincided with a $19 million jump in profit-taking. However, the majority of ADA’s selling activity in November has been from investors realizing losses. ADA is down nearly 30% since the beginning of the month.

Cardano’s derivatives offer glimmer of hope

On the derivatives side, Cardano’s open interest in ADA terms increased by 30% to 1.64 billion ADA over the past week, continuing its recovery path, which began a month ago despite declining prices.

ADA Open Interest. Source: Coinglass

The Binance Long to Short Ratio indicates the rise could be tilted toward bullish positioning, as the number of top accounts and positions longing ADA outpaces shorts by 2.8 and 1.7, respectively. However, ADA’s Funding Rates remain moderate at 0.0077%, with negative flashes over the past week.

ADA risks decline to $0.30 if it fails to hold a key support range

ADA has shaved 2% off its value, extending its weekly decline to 20% at the time of publication on Thursday.

The Layer 1 token is testing the key support range between $0.45-$0.42. A failure to hold $0.42 could see ADA find support around the $0.30 psychological level.

ADA/USDT daily chart

On the upside, ADA has to recover $0.45 and clear the 20-day Exponential Moving Average (EMA) resistance to retest the $0.60 psychological level.

The Relative Strength Index (RSI) and Stochastic Oscillator (Stoch) are in oversold territory, indicating a strong bearish momentum. However, oversold conditions in the RSI and Stoch could spark a short-term reversal.

Source link

20 11, 2025

XRP at crossroads as support weakens amid ETF inflows

By |2025-11-20T20:19:55+02:00November 20, 2025|Crypto News, News|0 Comments

Ripple (XRP) steadies above the critical $2.00 level on Thursday, as bulls push to regain control as volatility and bearish sentiment persist across the crypto market.

XRP needs the support of institutional investors through the recently launched Exchange Traded Funds (ETFs) and other related investment products to ensure stability above $2.00 support and sustain its recovery in the fourth quarter.

XRP ETF demand signals institutional appetite

XRP spot ETFs extended their inflow streak with nearly $16 million streaming in on Wednesday. There are two XRP ETFs listed in the United States (US): Canary Capital’s XRPC and Bitwise XRP. Combined, they have a total net inflow of approximately $293 million, with net assets averaging $268 million.

Since their October 28 debut, XRP ETFs have not experienced outflows, underscoring the growing risk appetite in altcoin-related investment products. 

On the other hand, the XRP derivatives market has remained relatively muted since the October 10 flash crash. The futures Open Interest (OI) averages $3.79 billion on Thursday, down from Wednesday’s $3.85 billion, according to CoinGlass data.

OI is a measure of the notional value of outstanding futures contracts; hence, a steady rise is required to support an XRP rebound in the near term.

Technical outlook: XRP seeks stability amid downward pressure

XRP holds above its short-term support at $2.00 on Thursday, as bulls strive to shape the trend in upcoming sessions. The cross-border remittance token remains below the 50-day Exponential Moving Average (EMA), the 100- and 200-day EMAs at $2.45, $2.57 and $2.54, respectively, with all three sloping lower.
The 50-day EMA running beneath the 200-day EMA highlights a Death Cross pattern, which reinforces a bearish setup. At the same time, the Moving Average Convergence Divergence (MACD) indicator remains below its signal and under the zero line, with the negative histogram slightly widening, suggesting strengthening bearish momentum.
The Relative Strength Index (RSI) at 37 stays under the midline, indicating sellers have the upper hand. A descending trend line from $3.66, XRP’s record high reached on July 18, caps rebounds, with resistance seen near $2.72.

XRP/USDT daily chart

Overhead, the SuperTrend indicator descends near $2.58, aligning with the 200- and 100-day EMAs to form a heavy resistance band at $2.54-$2.57. The moving averages continue to roll over, so any bounce would face the first cap at the 50-day EMA at $2.45, and a daily close above that barrier could ease downside pressure.
The MACD indicator’s stance beneath zero reinforces a bearish bias. Beneath these trend filters, bears remain in control; a break above $2.72 would be needed to improve the tone. Holding below the cited averages keeps risk skewed lower.

(The technical analysis of this story was written with the help of an AI tool)

Source link

Go to Top