Solana is priced near $125.69 with a live market cap around $70,780,655,373 and a 24-hour volume near $2,306,325,895, ranking #7 on CoinMarketCap with roughly 563,155,830 SOL in circulating supply. In the broader tape, Bitcoin is near $88,485.13 with a market cap of about $1,767,069,049,489, while Ethereum is near $2,993.90 with a market cap of about $361,347,912,973.
That macro backdrop matters because when BTC and ETH stabilize, capital often rotates into high-beta majors like SOL before it later chases smaller narratives.
Solana sits in the sweet spot where liquidity is deep enough for large flows, yet narrative momentum can still move price faster than the slowest large caps.
Why Solana Demand Keeps Returning
Solana remains one of the most used consumer-oriented chains because its throughput and low fees make on-chain activity feel instant. That user experience is a real moat in cycles where traders want speed, cheap execution, and a constant stream of new launches. When meme and NFT activity heats up, Solana often benefits because it can absorb high transaction bursts without pricing out smaller users.
This is why SOL tends to respond quickly when risk appetite returns. Still, it is important to separate network popularity from price multiples. At a ten of billions valuation, SOL can trend strongly, but it is less likely to deliver the life-changing percentage jumps that micro caps can produce.
Technical Indicator View Using Classic Signals
A disciplined 2026 outlook uses confirmation instead of wishful forecasting. Start with the 200-day moving average because it often acts like the market’s long-term trend line. When SOL holds above the 200-day average for weeks, the market is usually signaling that demand is absorbing supply. Next, watch the 50-day moving average for trend acceleration. If the 50-day line is rising and price respects it on pullbacks, momentum is typically constructive.
Then check RSI. Readings in the 50 to 60 zone often indicate healthy momentum with room to run, while repeated failures to hold 50 can warn that rallies are being sold. MACD is your trend change detector. A bullish cross that stays supported by steady volume is more meaningful than a one-day pop.
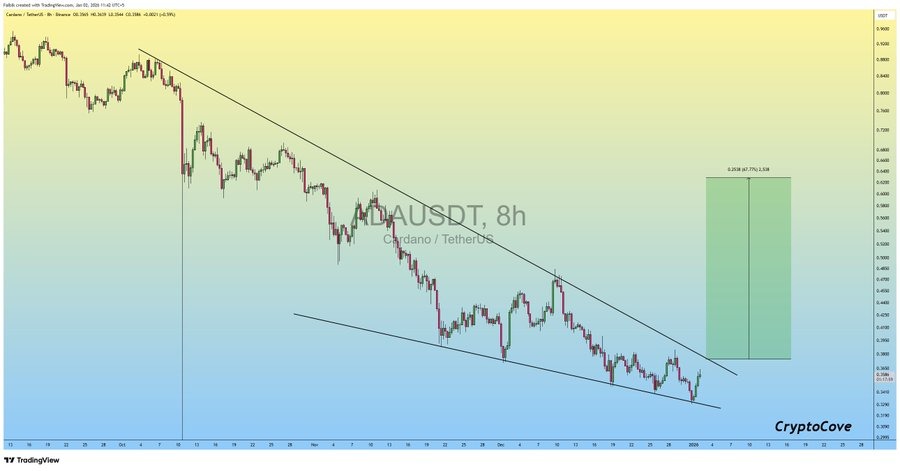
Finally, use simple support and resistance planning. Solana often builds a base, tests the ceiling multiple times, then breaks when volume expands. A confirmed breakout usually includes a daily close above resistance and a successful retest that turns that level into support.
Solana Price Prediction Scenarios for 2026
Base case. SOL continues a grind higher as the market normalizes, with pullbacks that find buyers at key moving averages. In this scenario, traders look for higher lows on the weekly chart, an RSI staying above 50, and a steady slope in the 50-day moving average.
Bull case. A strong risk-on year pushes users and liquidity back into high-activity chains. If Solana keeps attracting launches and on-chain flows, the price can trend into new ranges, especially if BTC remains firm and ETH sentiment stays positive.
Bear case. If macro conditions tighten or liquidity dries up, SOL can consolidate for longer and sweep downside support zones before recovering. That does not break the long-term thesis, but it can delay the breakout timing and raise opportunity cost.
Pepeto Micro Cap Rotation Built on Ethereum
Solana can be a strong major, yet the biggest percentage moves in crypto usually happen at the micro-cap layer when retail attention concentrates. Pepeto is positioned for that lane on Ethereum mainnet, combining meme culture with real utility so the story is both simple and usable.
Pepeto (https://pepeto.io/) ecosystem includes PepetoSwap, positioned as a zero-fee swap; Pepeto Bridge for cross-chain movement; and Pepeto Exchange, a verified meme exchange where all volume routes through $PEPETO. That routed volume design is the demand engine. The goal is for swap, bridge, and exchange activity to continuously pull usage through the token rather than relying on a single hype moment.
Pepeto supply is fixed at 420T tokens (https://pepeto.io/#tokenomics) . Staking APY is marketed around 216% , which can tighten circulating supply and reduce future sell pressure if early buyers choose yield. Security posture is supported by audits from SolidProof and Coinsult.
The community is presented as more than 100,000 members, adding social gravity that often attracts liquidity in meme cycles.
The live presale snapshot shows 1 PEPETO equals $0.000000175 with $7.14M raised. For traders hunting the best crypto to buy now, Pepeto is framed as the next 100x meme coin style asymmetry because the starting valuation is small and the participation path is straightforward.
How to Buy Pepeto
Use a direct, clean process. Go to (https://pepeto.io/) and confirm you are on the official site before connecting anything. Connect a Web3 wallet, choose payment in ETH, USDT, BNB, or a bank card via Web3Payments, then enter your amount and approve the transaction.
Right after buying, you can stake from the same flow to start earning the high APY before launch (https://pepeto.io/en/staking). The official site also advertises a $700,000 giveaway, so treat copycat links as a red flag and type the domain manually.
Solana’s 2026 outlook is strongest when classic indicators confirm the trend and the market stays risk-on, but its large valuation naturally moderates extreme multiples. Pepeto is positioned as the faster retail rotation bet on Ethereum, with routed ecosystem demand, staking-driven supply tightening, and audited infrastructure layered onto a meme narrative, positioning it as a Best Crypto Presale.
In every cycle, the window with the best risk reward usually appears before the next price step and before the crowd arrives.
To stay ahead of key updates, listings, and announcements, follow Pepeto on its official channels only:
Website: https://pepeto.io
X (Twitter): https://x.com/Pepetocoin
Telegram: https://t.me/pepeto_channel
Instagram: https://www.instagram.com/pepetocoin/
Windows like this belong to those who secure position before momentum ignites, because once participation explodes, this entire access channel collapses.
Contact: Dani Bonocci
Website: https://www.tokenwire.io
Phone: +971586738991
SOURCE: Pepeto
Press release distribution
This release was published on openPR.

 forecast 2026: Bitcoin price forecast 2026: Will BTC USD rally or crash toward ,000? Analysts break down the bull and bear cases")


 Price Jumps 8% Today as Whales Buy Return")