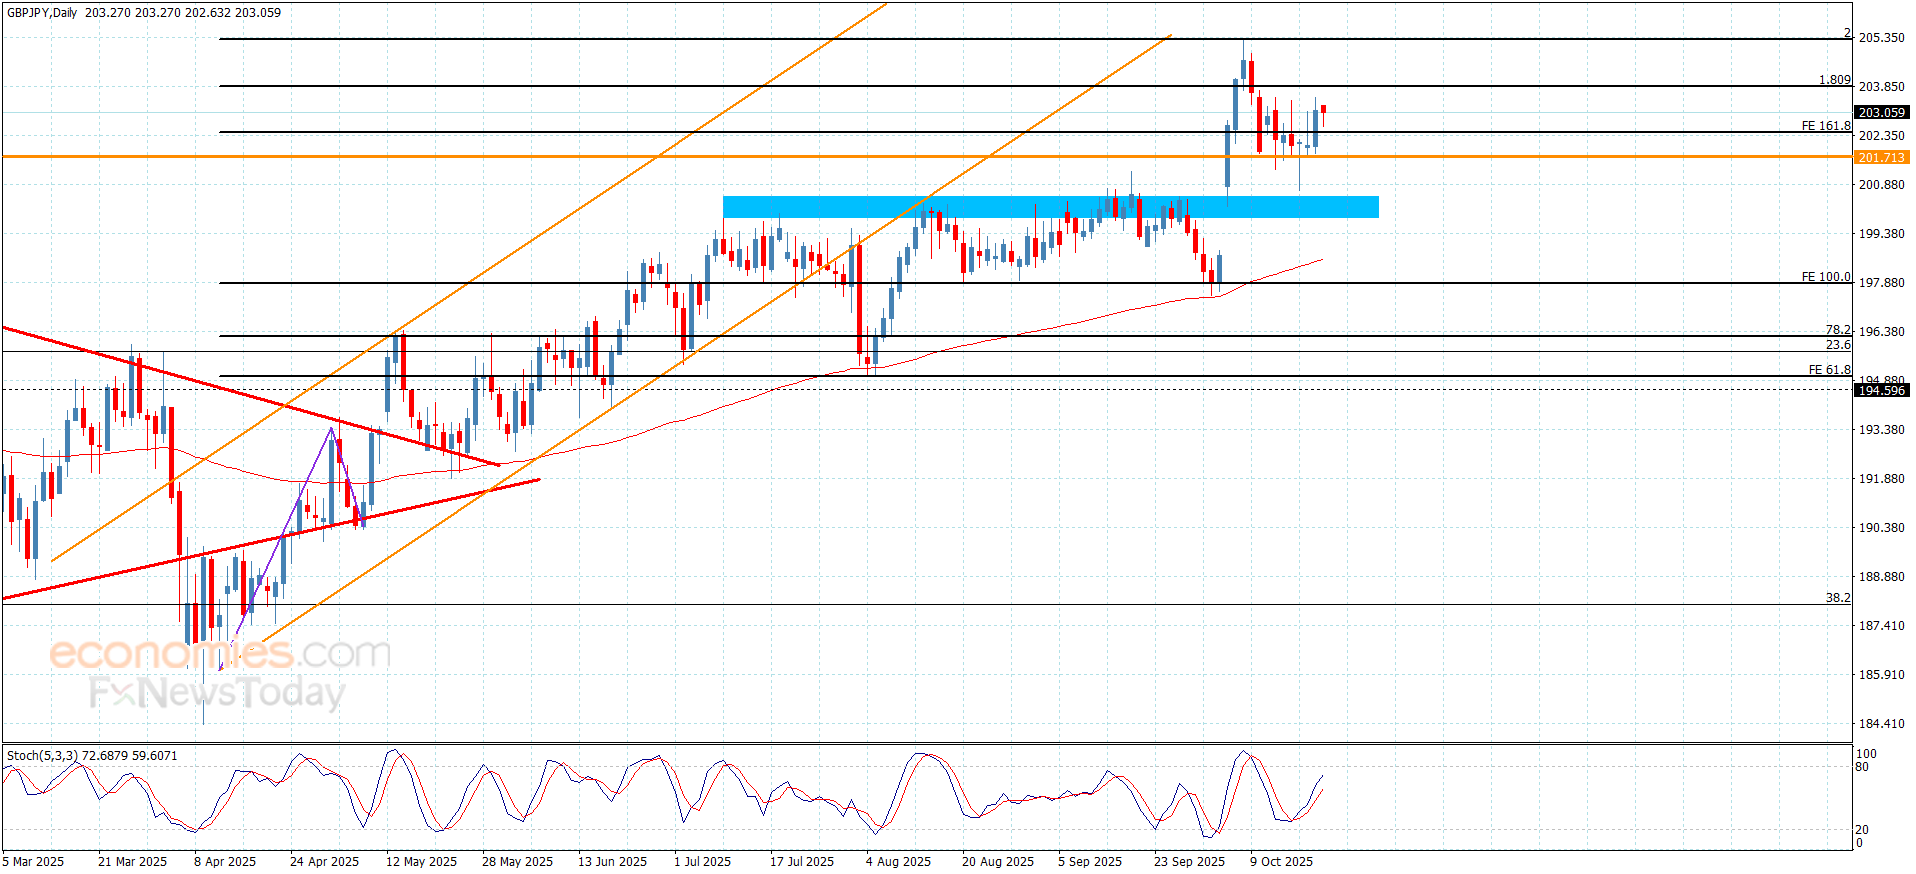
The GBPJPY pair confirmed the stability of the bullish scenario by forming a new bullish rally yesterday, achieving the initial target by hitting 203.50 level, to settle above $161.8 Fibonacci extension level at 202.50.
The continuation of providing positive momentum by the main indicators will increase the strength of the bullish track, to expect attacking the barrier at 203.95, and surpassing it will open the way for reaching new stations that might begin from 204.60 and 205.25, while changing the trend and begin the bearish corrective track requires forming sharp decline to settle below the extra support at 201.70.
The expected trading range for today is between 202.60 and 203.95
The Pound US Dollar (GBP/USD) exchange rate slipped further on Wednesday after softer-than-expected UK inflation data increased bets on a Bank of England (BoE) interest rate cut before year-end.
At the time of writing, GBP/USD was trading around $1.3328, down approximately 0.28% from the start of the session.
The Pound (GBP) came under pressure after the Office for National Statistics (ONS) reported that consumer price inflation held steady at 3.8% in September, missing forecasts of a rise to 4.0%.
Core CPI fell sharply from 4.6% to 3.5%, while services inflation stabilised at 4.75%, below expectations of 4.8% and 0.3 percentage points under the BoE’s latest projection.
The weaker data indicates that underlying price pressures are cooling faster than policymakers anticipated, particularly as food prices — a key concern for the BoE — unexpectedly declined on the month.
According to ING, the figures delivered a clear dovish signal for the central bank and increased downside risks for the Pound.
As the bank noted: “The September UK inflation reading released this morning is sending a dovish signal to the Bank of England and weighing on the pound. Headline inflation remained unchanged at 3.8% (consensus 4.0%), while core slowed down from 4.6% to 3.5% and services CPI stabilised at 4.75% versus expectations of 4.8% and 0.3pp below the BoE’s latest forecast. Our UK economist notes that the main dovish surprise comes from food prices – a big concern for the BoE of late – which actually fell on the month and are now 0.5pp below the BoE’s August forecasts.”
Save on Your GBP/USD Transfer
Get better rates and lower fees on your next international money transfer.
Compare TorFX with top UK banks in seconds and see how much you could save.
Markets responded by increasing expectations for a BoE rate cut before the end of 2025, driving gilt yields lower and keeping Sterling under pressure across major currency pairs.
The US Dollar (USD), meanwhile, found modest support during Wednesday’s European session amid cautious market sentiment and lingering global growth concerns.
With the ongoing US government shutdown continuing to delay key data releases, investors turned their attention to upcoming commentary from Federal Reserve officials for policy cues.
Policymakers have broadly maintained a cautious tone, acknowledging softening inflation but insisting that rates must stay restrictive until the 2% target is clearly within reach.
GBP/USD Forecast: Central Bank Commentary to Steer Direction
Looking ahead, movement in the Pound to US Dollar exchange rate will likely hinge on upcoming speeches from both Bank of England and Federal Reserve policymakers.
If BoE officials hint that cooling inflation is paving the way for policy easing, GBP could remain under pressure into the weekend.
Conversely, any hawkish signals from Fed speakers may lend the ‘Greenback’ further support, keeping GBP/USD subdued through the second half of the week.
Like this piece? Please share with your friends and colleagues:
International Money Transfer? Ask our resident FX expert a money transfer question or try John’s new, free, no-obligation personal service! ,where he helps every step of the way,
ensuring you get the best exchange rates on your currency requirements.
The GBPJPY pair confirmed the stability of the bullish scenario by forming a new bullish rally yesterday, achieving the initial target by hitting 203.50 level, to settle above $161.8 Fibonacci extension level at 202.50.
The continuation of providing positive momentum by the main indicators will increase the strength of the bullish track, to expect attacking the barrier at 203.95, and surpassing it will open the way for reaching new stations that might begin from 204.60 and 205.25, while changing the trend and begin the bearish corrective track requires forming sharp decline to settle below the extra support at 201.70.
The expected trading range for today is between 202.60 and 203.95
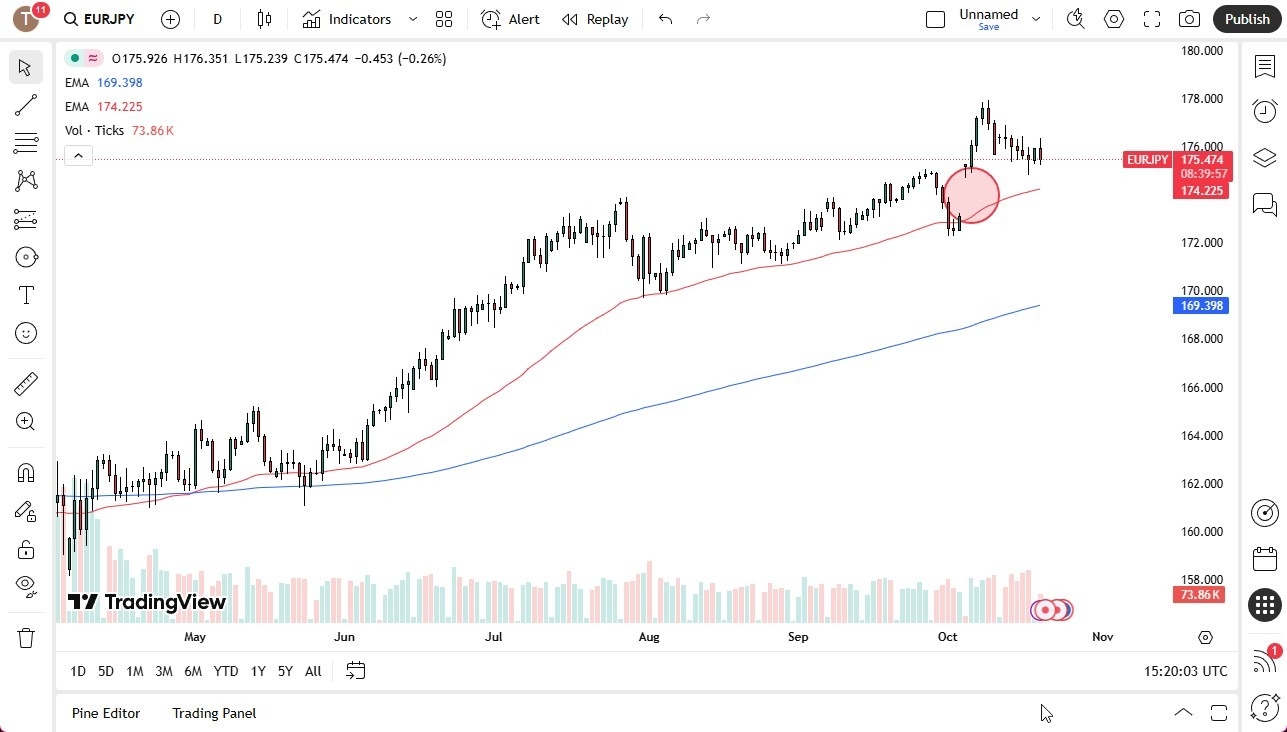
The euro initially rallied against the Japanese yen during trading on Monday but has turned around to show signs of weakness again.
The ¥176 level seems to be an area that’s a bit of a magnet for price, but the most important thing to pay attention to on the chart is the fact that there is a massive gap underneath current pricing that could come into the picture to offer a bit of support.
Furthermore, the 50 Day EMA sits at the ¥174.22 level and is rising, so that does give us a little bit of support there as well.
Trend Continuation
We have been in an uptrend for some time, and I do believe that it will continue eventually, and that each pullback does tend to offer a bit of support and, more importantly, value. Ultimately, the Bank of Japan is in a situation where it probably cannot do much, at least not enough to turn the markets around. While we could fall in order to fill the gap, meaning that we could drop all the way back down to the ¥173.25 level, I still think there are plenty of buyers between here and there to at least cushion the fall, and then eventually turn things around. Ultimately, this means that I have no real interest in shorting this market, despite the fact that it does seem like it is struggling a bit in this general vicinity.
With all of that being said, this is a market that I think eventually has to deal with the 170 Ian level, which is an area that has acted like significant resistance. If we can break above that level, it would obviously be very bullish, and it could send this market much higher. In that environment, I see the ¥180 level as being very likely, perhaps even higher than that. Remember, this doesn’t have much to do with the euro and everything to do with the Japanese yen. This pair will move in the same direction and overall attitude as many other JPY-denominated markets.
Christopher Lewis has been trading Forex and has over 20 years experience in financial markets. Chris has been a regular contributor to Daily Forex since the early days of the site. He writes about Forex for several online publications, including FX Empire, Investing.com, and his own site, aptly named The Trader Guy. Chris favours technical analysis methods to identify his trades and likes to trade equity indices and commodities as well as Forex. He favours a longer-term trading style, and his trades often last for days or weeks.
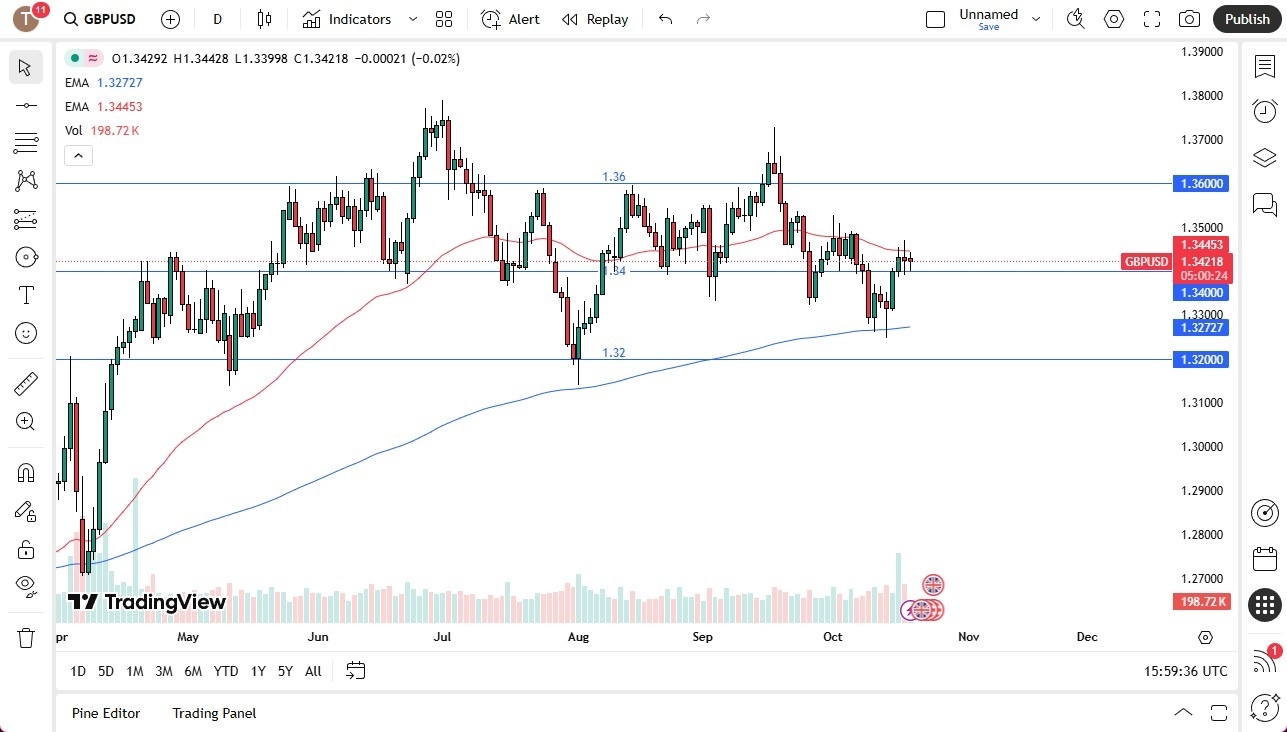
The British pound is starting to roll over slightly from the 50-day EMA as well. Although bearish, I wouldn’t worry too much about it because we’re basically in the middle of the overall consolidation. So, therefore, we’re essentially at fair value. I do favor the US dollar over the pound. Although the British pound is a little bit of an outlier considering how it performs against the US dollar, even as we were falling during 2024, it was falling less rapidly against the greenback than many other currencies. Conversely, on the way back up, the British pound was one of the best performers. So it’s got a history of fighting the dollar a little bit more. So although it does look weaker than strong, I’m not overly concerned. I think we will stay in this range for the time being.
EUR/GBP Technical Analysis
And finally, when it comes to triangulation between the euro, the pound, and the dollar, it makes sense that the euro and the pound look pretty much the same. That’s because they’re pretty neutral towards each other. The euro is currently sitting right out of the 50-day EMA against the British pound, right in the middle of a larger consolidation area.
I think this is essentially trying to tell us something important, and that’s where the dollar goes, which will dictate where everything moves in the first two pairs in this analysis. This is about the dollar and not really about the pound and the euro. There is no strength in the euro versus the pound or vice versa. Over the longer term, the euro has risen quite nicely, but going back to the last three months or so, we’ve been pretty sideways between 0.86 and 0.8750. I don’t see that changing anytime soon.
For a look at all of today’s economic events, check out our economic calendar.
During the Monday trading session, the British pound has been fairly quiet against the US dollar.
We are in a range at the moment and trying to figure out exactly whether or not the buyers can push the market higher, if we are, in fact, going to start to fall apart.
As things stand right now, it’s probably worth noting that the 50 Day EMA has offered resistance, but it’s also worth noting that the high price from the Friday session still would qualify as a “lower high” if we were in fact to drop from here.
Questions Remain
I think there are still a lot of questions asked about whether or not this trend can continue, as we had pulled back rather significantly, but we also have the situation where the market had been so bullish previously. The one thing that I do know is that the British pound has been much stronger against the US dollar than most other currencies, so if this pair starts to fall apart, I think that tells you that the US dollar is about to get very strong, and therefore punish not only the British pound, but other weaker currency such as the Japanese yen, Canadian dollar, New Zealand dollar, and so on.
Alternatively, if this pair rises, then it tells is that the US dollar is probably going to soften a bit, but I actually would prefer to buy the British pound in that environment, because it has outperformed and therefore I don’t feel that there’s any reason to go looking somewhere else to really take advantage of a weaker US dollar. Ultimately, this is a very choppy currency pair, and I think that will continue to be the case in this market, and I think we remain rangebound. In fact, the larger consolidation area, I believe, is between the 1.37 level and the 1.35 level. We are currently right around the middle of that, meaning that we are essentially near “fair value.”
Christopher Lewis has been trading Forex and has over 20 years experience in financial markets. Chris has been a regular contributor to Daily Forex since the early days of the site. He writes about Forex for several online publications, including FX Empire, Investing.com, and his own site, aptly named The Trader Guy. Chris favours technical analysis methods to identify his trades and likes to trade equity indices and commodities as well as Forex. He favours a longer-term trading style, and his trades often last for days or weeks.
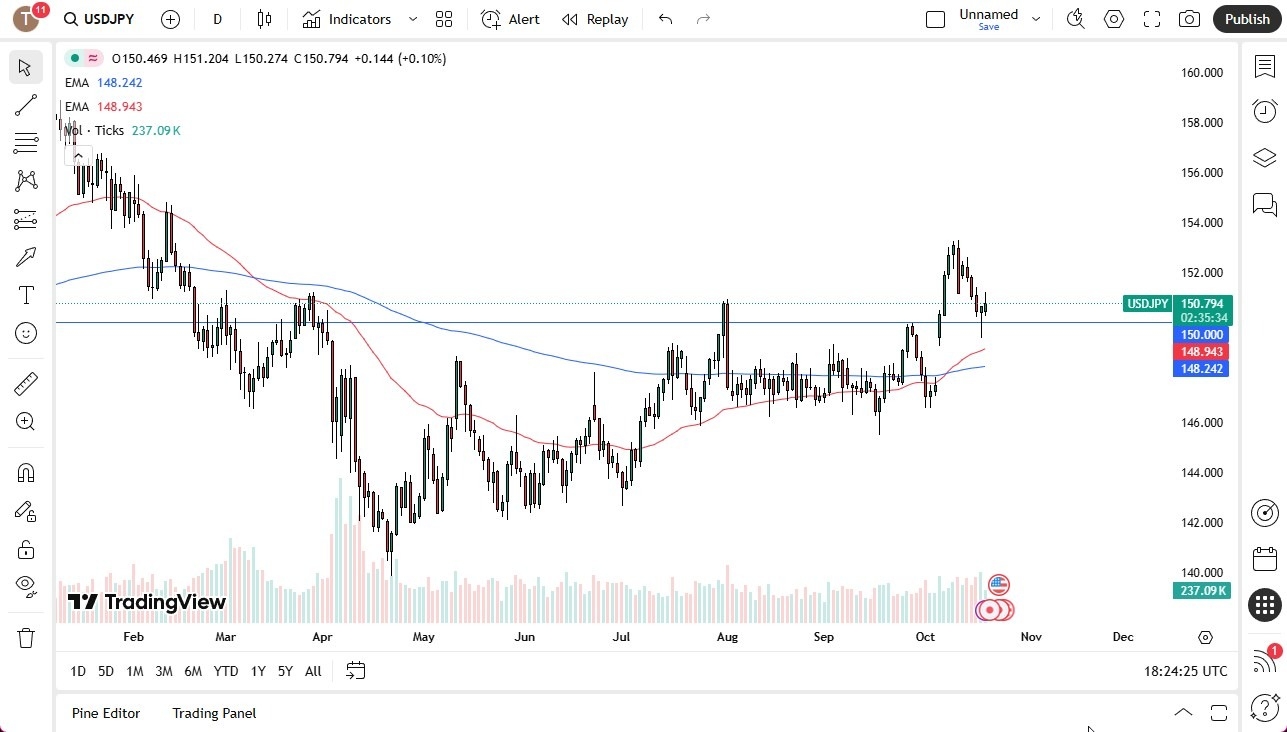
The U.S. dollar strengthened sharply against the yen on Monday, rebounding from ¥150 support with a bullish hammer formation. Analysts expect continued upside toward ¥153, supported by yield differentials, while pullbacks remain buying opportunities above ¥147.
The U.S. dollar has rallied significantly during the trading session on Monday against the Japanese yen, kicking off perhaps the next leg higher as the ¥150 level has often offered a bit of support, with the Friday candlestick showing itself as a hammer.
The hammer, of course, is a very bullish sign, and therefore I think you have to look at this as a market that is probably trying to reach towards the ¥153 level.
If we break down below the hammer from the Friday session, then we start to look at the 50-day EMA, which is an indicator that a lot of people will be watching. And there’s a gap underneath there that is supported by the 200-day EMA.
Ultimately, this is a market that I think continues to see a lot of upward trajectory, mainly due to the fact that the interest rate differential continues to favor the U.S. dollar. And I just don’t see how that changes anytime soon. Ultimately, this is a market that has been breaking out for a while.
I Collect Swap When I Can
And as you get paid at the end of the day, if you’ve been watching me for several months, all the way back to somewhere in June, I think I have started to tout the strength of the idea of being long in this market, and I have been long in this market for quite some time.
At this point, it’s going to be more of a grind to the upside than anything else, but you get paid to wait, and I think that’s a huge advantage. If we were to break down below the ¥147 level, then okay, things change. But until then, this looks like a market where short-term dips offer the possibility of buying opportunities to take advantage of as market participants continue to shun the Japanese yen for a whole host of economic reasons in that country.
Christopher Lewis has been trading Forex and has over 20 years experience in financial markets. Chris has been a regular contributor to Daily Forex since the early days of the site. He writes about Forex for several online publications, including FX Empire, Investing.com, and his own site, aptly named The Trader Guy. Chris favours technical analysis methods to identify his trades and likes to trade equity indices and commodities as well as Forex. He favours a longer-term trading style, and his trades often last for days or weeks.
Support Levels for EUR/USD Today: 1.1600 – 1.1550 – 1.1480.
Resistance Levels for EUR/USD Today: 1.1700 – 1.1780 – 1.1850.
EUR/USD Trading Signals:
Buy the EUR/USD from the support level of 1.1560, target 1.1800, and stop 1.1480.
Sell the EUR/USD from the resistance level of 1.1730, target 1.1600, and stop 1.1800.
Technical Analysis of EUR/USD Today:
According to recent trading, the EUR/USD pair has broken through a key resistance area at the key psychological support level of 1.1600, indicating that the uptrend may be gaining momentum. However, the price appears to be retreating to this broken resistance level, which has now become support, potentially attracting more buyers willing to join the rally. According to reliable trading platforms, the current price zone corresponds to the 50% and 61.8% Fibonacci retracement levels at 1.1637 and 1.16157, respectively, extending from the previous swing low at 1.1545 to the swing high at 1.1728. These technical areas may be sufficient to control losses and trigger a rebound to or above the previous highs.
Consequently, if the broken resistance zone and the Fibonacci levels hold as a base, the EUR/USD pair may resume its ascent and could target the psychological upward level of 1.18000 later. On the other hand, a break below these support areas could indicate a weakening of the upward momentum, leading to a deeper correction toward the swing low.
Therefore, if the broken resistance area and Fibonacci levels hold as a bottom, the EUR/USD pair may resume its upward trend, potentially targeting the psychologically significant 1.18000 level later. Conversely, a break below these support areas could indicate weakening upward momentum, leading to a deeper correction towards the swing low. Meanwhile, the 100-period simple moving average (SMA) is below the 200-period simple moving average (SMA) on the short-term timeframe, suggesting that the strongest trend was previously downward. However, the price has broken both SMAs, indicating a potential shift in momentum. The 200-period simple moving average appears to be stabilizing, suggesting that upward pressure may be increasing.
The stochastic indicator is also rising from the oversold zone, reflecting a return of buying interest. The oscillator has plenty of room to rise before reaching the overbought zone, so buyers may take control for a longer period, bringing the EUR/USD pair back to the swing high or achieving new highs above 1.17288. The Relative Strength Index (RSI) is also trending upward from the mid-range, confirming the increasing upward momentum. As long as the oscillator maintains its upward trend, the price may continue to follow the same trend.
Trading Tips:
The bullish shift in EUR/USD is at its beginning. Therefore, the currency pair may be influenced by upcoming economic data and central bank commentary as traders assess monetary policy expectations for both regions, while the US government shutdown may further weigh on the US Dollar.
EUR/USD Trading Awaits US Inflation Figures
According to Forex trading, the euro appears to be better supported at this stage; it just needs something to spark a continued recovery. This spark could come from the release of US inflation data, scheduled for the end of the week. The US dollar is likely to decline if US inflation meets or falls below expectations, which would push the EUR/USD exchange rate to extend its recent recovery to 1.1750.
In general, Markets expect US CPI inflation to reach 3.1% in September, up from 2.9% in August, while core inflation is expected to reach 3.1%. Any reading above expectations will naturally strengthen the dollar, as investors will have no choice but to lower their expectations for future interest rate cuts, a development typically considered supportive of the US dollar. Before the US inflation data is released, the euro will be subject to the Eurozone Purchasing Managers’ Index (PMI) survey, which will provide insight into the region’s economic performance in October. A strong set of PMIs will support the euro against the dollar, as they will support the European Central Bank’s stance on maintaining interest rates at their current level.
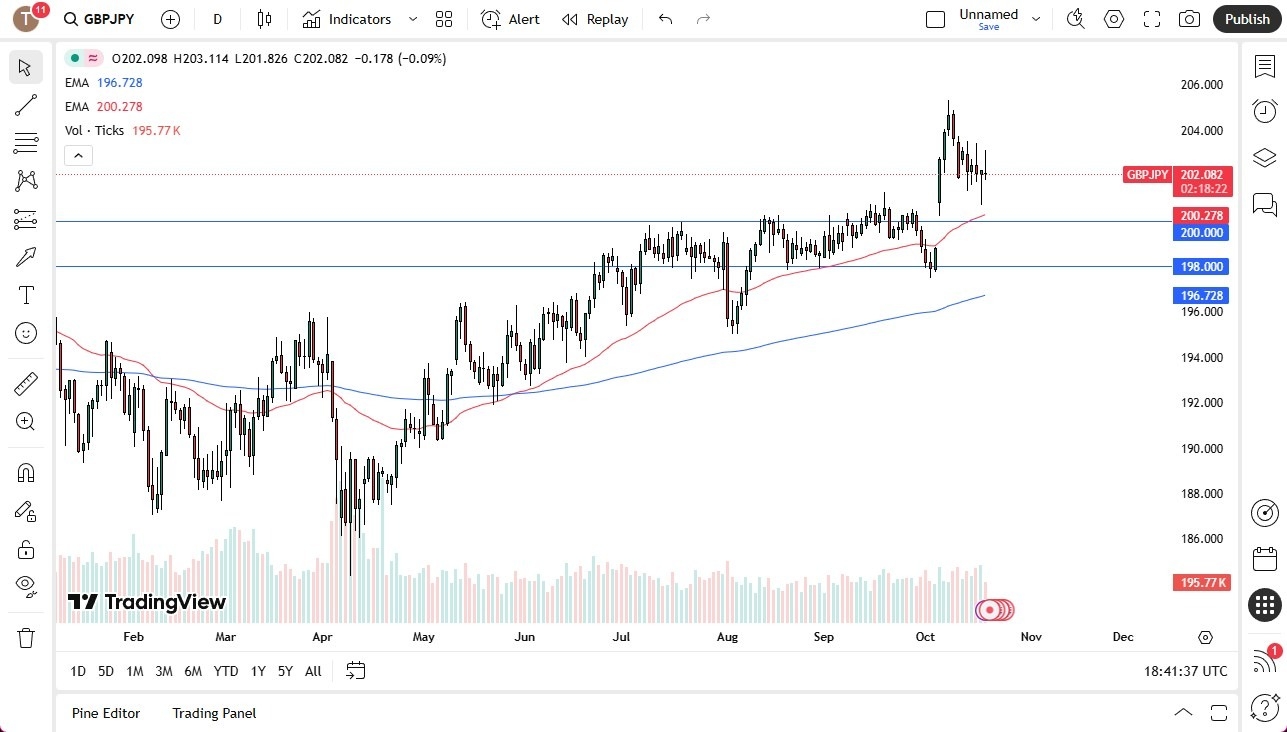
The British pound faces consolidation against the Japanese yen near ¥202 after volatile sessions.
Support lies around ¥200 and resistance at ¥204–¥205, with the broader trend remaining bullish and positive carry favoring long positions.
The British pound initially rallied during the trading session on Monday against the Japanese yen. As we continue to see a lot of noisy trading over the last four sessions, we have seen a hammer, an inverted hammer, a hammer, and then another inverted hammer. With that being said, it looks very much like a market that is stuck at the ¥202 level. Even if we break down from here, I think there’s a lot of support near the ¥200 level, which also has the 50-day EMA coming into the picture.
The Importance of the 50-day EMA
The 50-day EMA is a famous trend-following type of indicator that I think will attract a lot of attention. And the fact that it’s right there at that ¥200 level, of course, has even more people paying attention to it. If we can break above the ¥204 level, then it opens up the possibility of the ¥205 level rather quickly.
Overall, we are in a positive trend, with the British pound offering a positive swap against the Japanese yen. And when you look around the forex world at the moment, all of the yen-related pairs look the same. They all gapped higher, pulled back a bit, and now they look as if they are trying to at least grind to the upside.
That being said, this is a very noisy couple of sessions, so I don’t think we’re in the all clear to get overly bullish yet. But you get the payment at the end of every day via swap to at least make this pair work out over the longer term, assuming that the trend continues. I see nothing on this chart that changes that trend anytime soon.
Christopher Lewis has been trading Forex and has over 20 years experience in financial markets. Chris has been a regular contributor to Daily Forex since the early days of the site. He writes about Forex for several online publications, including FX Empire, Investing.com, and his own site, aptly named The Trader Guy. Chris favours technical analysis methods to identify his trades and likes to trade equity indices and commodities as well as Forex. He favours a longer-term trading style, and his trades often last for days or weeks.
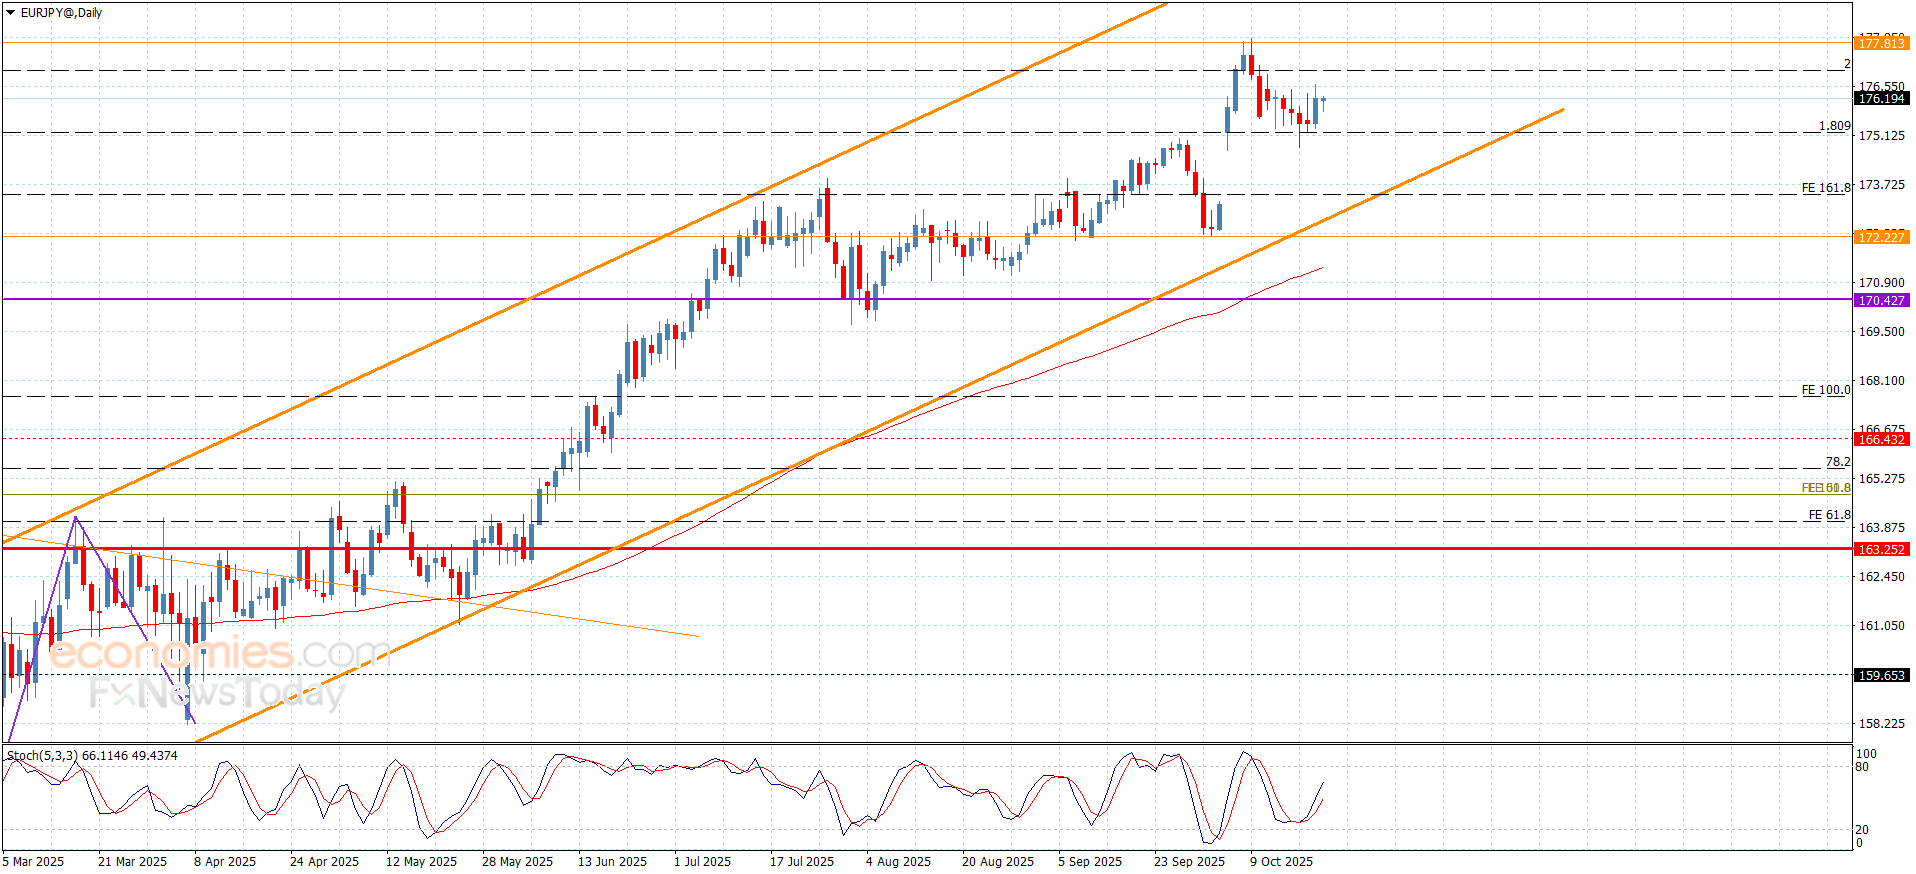
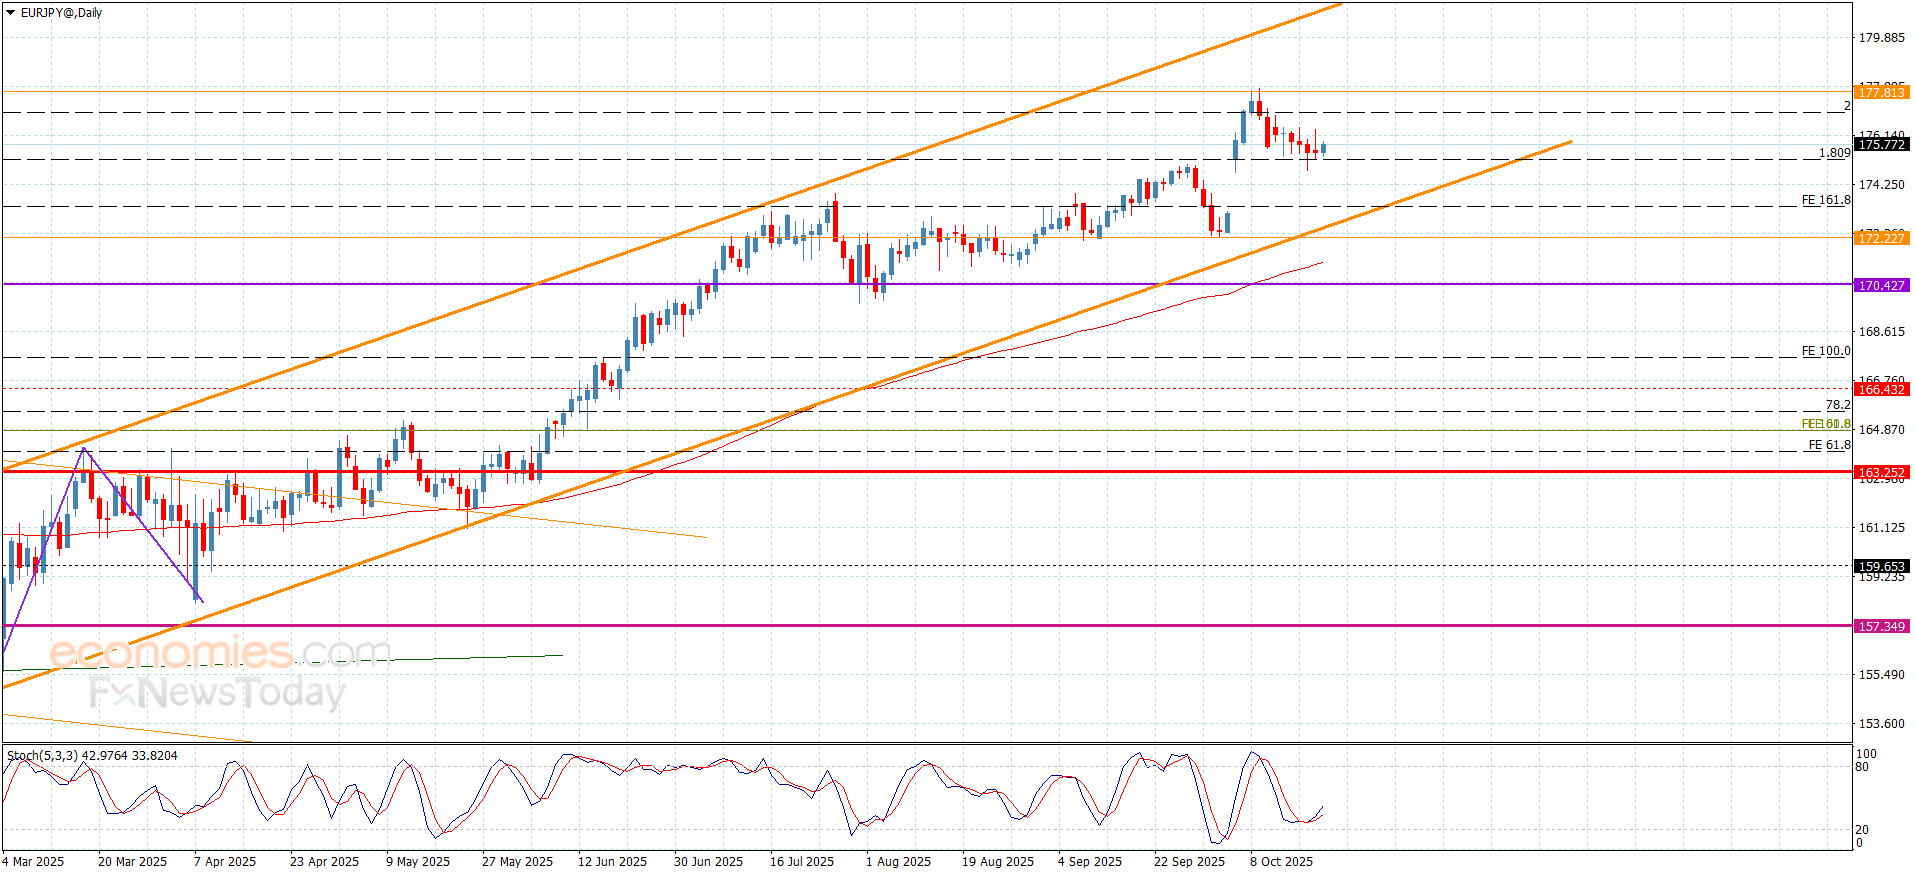
Despite the weakness of the EURJPY pair last trading, its stability within the bullish channel’s levels and the continuation of forming extra support at 175.25 level supports our bullish suggestion in the near trading, to keep waiting for targeting 177.05 level reaching the top at 177.85.
Note that reaching below the current support and providing negative close will force it to activate the bearish corrective track, reaching 174.15 initially, and breaking this level will force it to decline towards 173.40, approaching the support of the main bullish channel.
The expected trading range for today is between 175.25 and 177.05