The Pound to US Dollar (GBP/USD) exchange rate was muted on Tuesday as Sterling struggled to gain traction after weaker-than-expected UK PMI data.
At the time of writing, GBP/USD was trading at around $1.3501, virtually unchanged from the start of the session.
The Pound (GBP) slipped in the wake of September’s flash PMIs, which revealed disappointing results across both the manufacturing and services sectors.
The manufacturing index dropped from 47.0 to 46.2, moving deeper into contraction, while the services PMI fell from 54.2 to 51.9, missing forecasts for a softer decline to 53.5.
As the services sector accounts for the bulk of UK economic activity, the sharp slowdown to a four-month low weighed heavily on sentiment.
Analysts pointed to subdued client confidence and lingering political and economic uncertainty as key drags, leaving Sterling struggling for support through the session.
The US Dollar (USD), meanwhile, traded steadily against most major peers. Investors largely held positions ahead of further commentary from the Federal Reserve.
Save on Your GBP/USD Transfer
Get better rates and lower fees on your next international money transfer.
Compare TorFX with top UK banks in seconds and see how much you could save.
On Monday, new policymaker Stephen Miran had argued that US interest rates remain around 200 basis points too high, putting some mild pressure on the Greenback.
On Tuesday, attention shifted to Fed Chair Jerome Powell’s upcoming speech, with traders bracing for any dovish signals that could spark renewed Dollar selling.
GBP/USD Forecasts: Central Bank Commentary in Focus
Looking ahead to Wednesday, GBP/USD is likely to take direction from a slate of speeches by Federal Reserve and Bank of England officials.
With no major data scheduled, markets will be watching closely for any policy hints that could reshape interest rate expectations on either side of the Atlantic.
Beyond central bank commentary, broader risk appetite may also steer price action.
A shift towards risk-on sentiment could lend the Pound fresh support, while a more cautious market tone would likely see GBP/USD remain under pressure.
Like this piece? Please share with your friends and colleagues:
International Money Transfer? Ask our resident FX expert a money transfer question or try John’s new, free, no-obligation personal service! ,where he helps every step of the way,
ensuring you get the best exchange rates on your currency requirements.
The GBP/USD forecast remains subdued as UK PMI data signals slowing growth.
Fiscal deterioration and rising gilt yields weigh heavily on Sterling sentiment.
The Fed’s hawkish tilt offsets the recent rate cut, supporting the dollar against the GBP.
The British pound came under renewed selling pressure on Tuesday after the UK PMI for September came in downbeat. The Composite PMI slipped to 51.0 against the expected 52.7 and previous 53.5. It suggests that business activity continues to expand, albeit at a slower pace. The manufacturing PMI showed a deeper contraction, falling to 46.2, below the consensus of 47.0, while services cooled to 51.9 from 54.2.
–Are you interested in learning more about MT5 brokers? Check our detailed guide-
Chief Economist at S&P Global Market Intelligence, Chris Williamson, flagged a litany of concerning news, including weak overseas demand, rising job losses, and declining business confidence. The slowdown comes against the backdrop of a strained UK fiscal outlook.
The UK public finances further declined in August as borrowing rose to £18 billion, the highest level in five years. Cumulative borrowing in the current fiscal year already exceeds official forecasts, leading to higher gilt yields. Markets are now bracing for Rachel Reeve’s autumn budget in November, which could signal fiscal tightening or more spending pressure.
Meanwhile, the Bank of England kept interest rates unchanged at 4.0% last week and reiterated its gradual approach to easing amid stubborn inflation above 2%. The fear of stagflation also persists as growth stagnates while inflation lingers higher.
On the US side, the Federal Reserve delivered its first rate cut in 2025. Still, Fed Chair Powell struck a hawkish tone, warning of weakness in the labor market while emphasizing the Fed’s commitment to controlling inflation. The retail sales data and jobless claims reinforced US growth momentum.
The combination of a hawkish Fed and a fragile UK fiscal situation is weighing on the GBP/USD, which is currently consolidating at 1.3500 after falling to the 1.3450 area last week.
Key Events Ahead
US PMIs: The US PMIs could weigh on the pair as the data is important for the Fed to gauge economic sentiment.
Jerome Powell’s speech: Markets await fresh guidance from the Fed Chair on future rate cuts and labor market conditions.
Comments from Fed officials: Michele Bowman, Raphael Bostic, Stephen Miran, and Beth Hammack may shape near-term USD expectations.
UK Autumn Budget (November): Investors will watch whether Chancellor Reeves signals fiscal tightening or additional borrowing.
Upcoming UK data: Inflation, retail sales, and consumer confidence figures will be key in shaping BoE policy expectations.
GBP/USD technical forecast: Key MAs to set trend
GBP/USD 4-hour chart
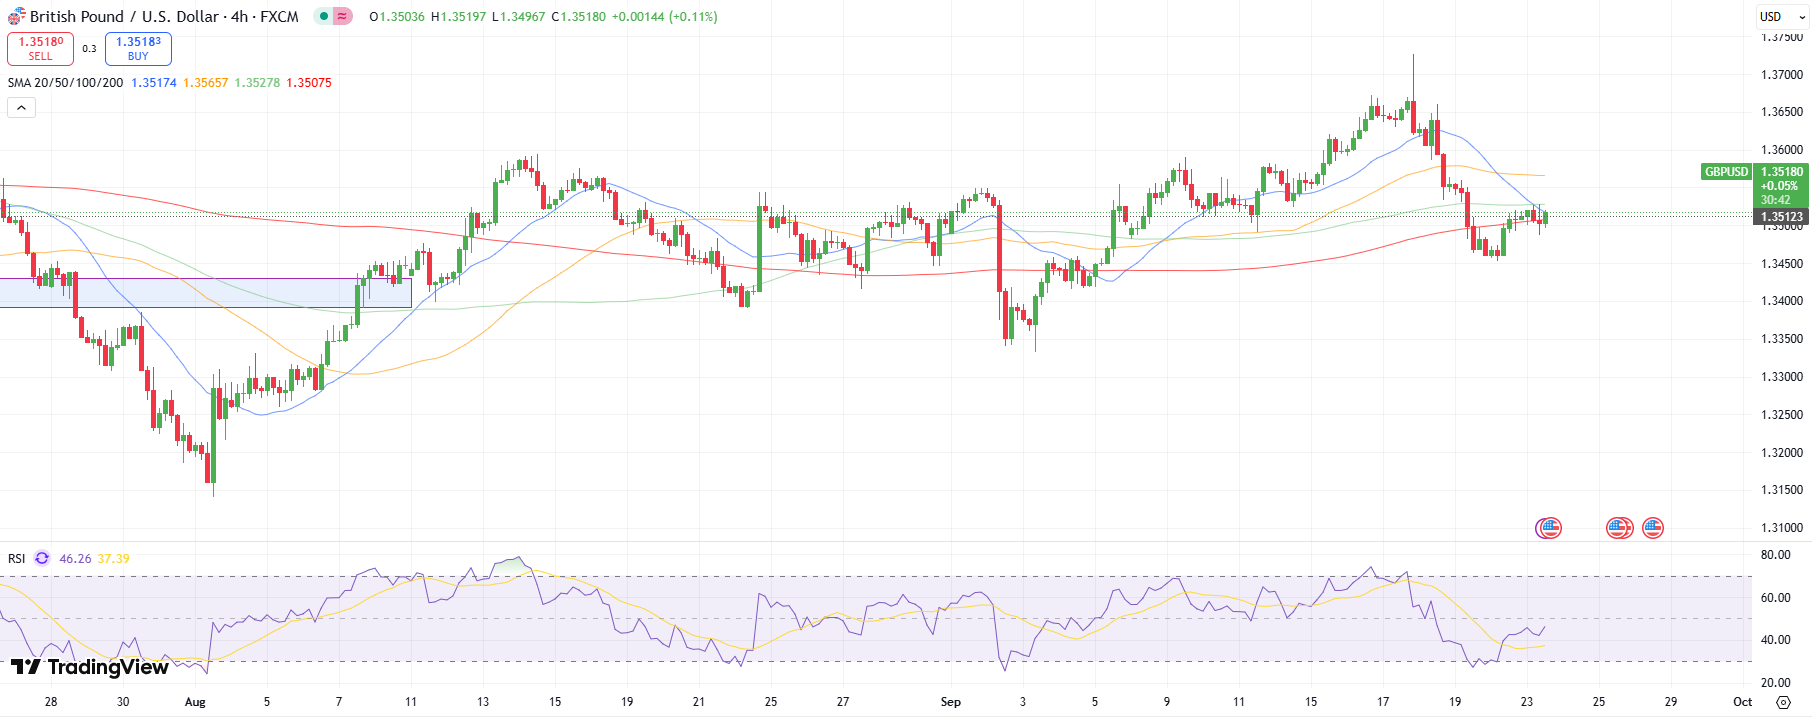
The GBP/USD price wobbles around the key MAs around 1.3500 on the 4-hour chart. A sustained breakout of the 200-period MA could ignite a selling momentum leading to a deeper correction. The RSI is now out of the oversold region but remains below the 50.0 mark, indicating a prevailing weakness.
The immediate support appears at 1.3500 ahead of the previous week’s lows of 1.3450 and then 1.3400. On the upside, 1.3550 remains the immediate target for the bulls ahead of 1.3600.
Looking to trade forex now? Invest at eToro!
68% of retail investor accounts lose money when trading CFDs with this provider. You should consider whether you can afford to take the high risk of losing your money.
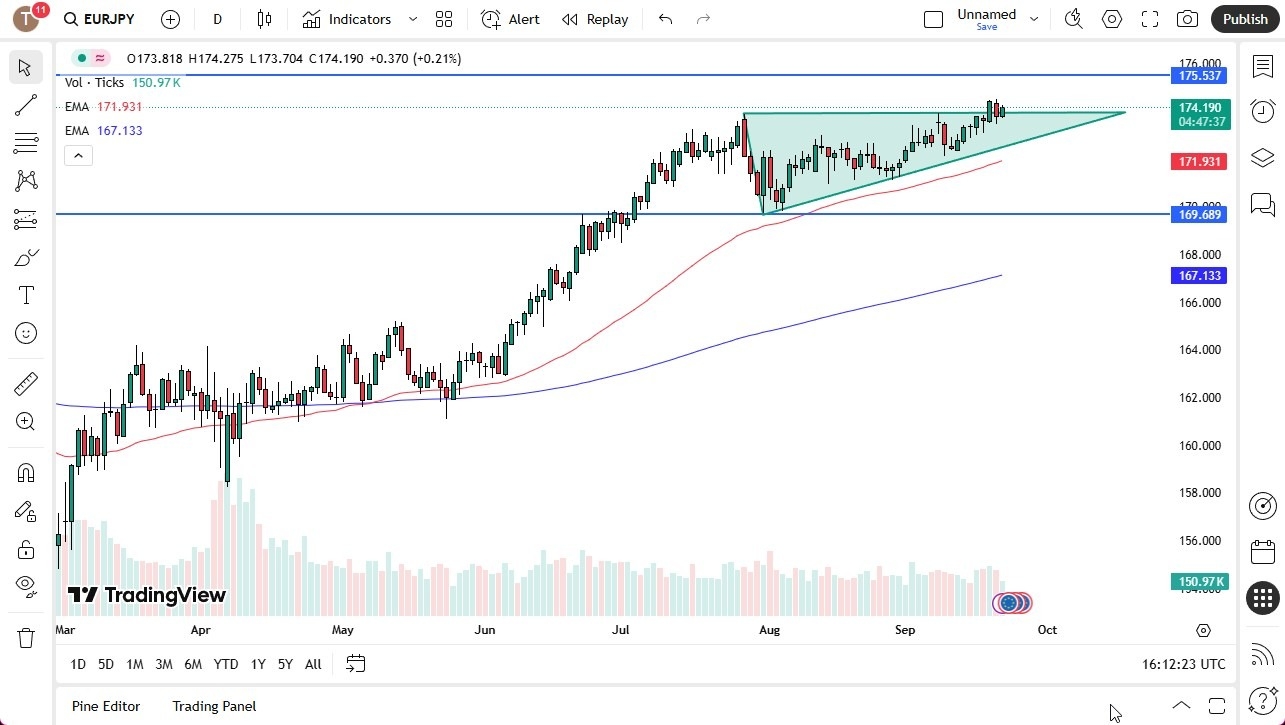
The euro has shown itself to be a little bit positive against the Japanese yen during trading on Monday as we continue to dance around the top of an ascending triangle. Ultimately, this is a market that I think could go looking for a major swing high at the 175.53 yen level, but it is going to have to build up a little bit of momentum. Quite frankly, the markets are waning back and forth between risk on or risk off behavior.
But as long as we get some type of risk appetite out there, I think you’ve got a very real shot at the Euro rising against the Japanese yen and perhaps trying to hit that 175.53 yen level.
Pullbacks Remain Attractive
Short-term pullbacks should see plenty of support all the way to the bottom of the triangle, which does of course have an uptrend line. And then we have the 50 day EMA sitting just below the 172 yen level. I do not wish to short this pair of the interest rate differential favors Europe, although there are higher paying currencies out there that you can trade against the yen. But this one looks like it’s particularly stable. It’s a matter of just collecting your swap at the end of every day and waiting for the market to rise. At least that’s the theory that we have at the moment. If we do drop down below the 50 day EMA, then we could get a move down to the 169.69 yen level, but right now it doesn’t look like it wants to do that. And therefore, I think we’ve got a situation where we continue to see buyers on dips and eventually a grind to the upside. The bank of Japan currently looks as if it may have to do something but right now it looks more likely to be loosening than tightening.
Christopher Lewis has been trading Forex and has over 20 years experience in financial markets. Chris has been a regular contributor to Daily Forex since the early days of the site. He writes about Forex for several online publications, including FX Empire, Investing.com, and his own site, aptly named The Trader Guy. Chris favours technical analysis methods to identify his trades and likes to trade equity indices and commodities as well as Forex. He favours a longer-term trading style, and his trades often last for days or weeks.
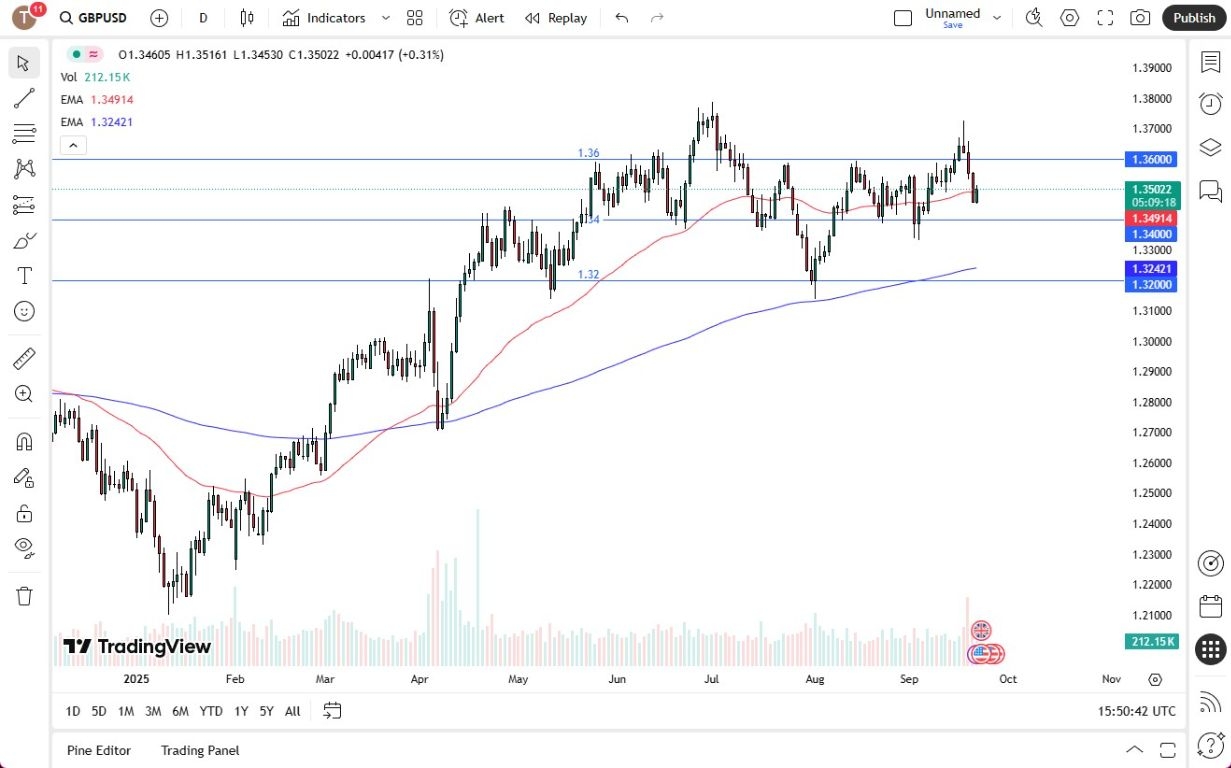
The British pound has rallied slightly during the trading session here on Monday, but you can see that we’re just hanging around the 50 day EMA. And it looks a lot like a market that is just simply going sideways after a significant drop over the course of three days. But uh this is still a market that is technically I guess up in an uptrend or maybe sideways. The 1.34 level should offer support as long as that holds. I think we’re more likely than not okay to the upside. But if we break down below 1.34, then we’ll see an acceleration of the US dollar strengthening against the British pound and probably other currencies to drop down to the 200 day EMA just above the 1.32 level. This is the so-called “line in the sand” for the trend from what I can see at the moment.
If We Do Break Lower
Anything below the 1.32 level could be rather ugly for the pound, and it probably sees the US dollar strengthening against not only the British pound but pretty much anything else and we could see just an absolute implosion to the 1.2750 level if that happens. On the upside if we can break above the 1.3750 level which has been historically important then I think the British pound is free to go looking to the 1.40 level, although it’s going to take some type of momentum to make that happen. I think we’re in a situation where people are a little concerned about the global economy. And if that’s the case, the dollar could catch a bid, so be careful with the position size, and recognize as quickly as possible if there is a major shift in risk appetite and sentiment in this market.
Christopher Lewis has been trading Forex and has over 20 years experience in financial markets. Chris has been a regular contributor to Daily Forex since the early days of the site. He writes about Forex for several online publications, including FX Empire, Investing.com, and his own site, aptly named The Trader Guy. Chris favours technical analysis methods to identify his trades and likes to trade equity indices and commodities as well as Forex. He favours a longer-term trading style, and his trades often last for days or weeks.
EUR/USD trades marginally lower on the day below 1.1800.
Mixed PMI data from Germany and the Eurozone make it difficult for the Euro to gather strength.
Markets await US PMI data and Fed Chair Powell’s speech.
EUR/USD stays under modest bearish pressure and trades below 1.1800 in the European session on Tuesday after closing in positive territory on Monday. The pair’s technical outlook points to a lack of bullish momentum as market focus shifts to US data and Federal Reserve (Fed) Chairman Jerome Powell’s speech.
Euro Price Today
The table below shows the percentage change of Euro (EUR) against listed major currencies today. Euro was the weakest against the US Dollar.
USD
EUR
GBP
JPY
CAD
AUD
NZD
CHF
USD
0.14%
-0.13%
0.00%
0.18%
0.07%
0.16%
-0.03%
EUR
-0.14%
-0.14%
-0.12%
0.09%
-0.01%
0.07%
-0.12%
GBP
0.13%
0.14%
0.06%
0.22%
0.13%
0.20%
0.01%
JPY
0.00%
0.12%
-0.06%
0.17%
0.11%
0.16%
0.06%
CAD
-0.18%
-0.09%
-0.22%
-0.17%
-0.10%
-0.02%
-0.21%
AUD
-0.07%
0.00%
-0.13%
-0.11%
0.10%
0.07%
-0.04%
NZD
-0.16%
-0.07%
-0.20%
-0.16%
0.02%
-0.07%
-0.19%
CHF
0.03%
0.12%
-0.01%
-0.06%
0.21%
0.04%
0.19%
The heat map shows percentage changes of major currencies against each other. The base currency is picked from the left column, while the quote currency is picked from the top row. For example, if you pick the Euro from the left column and move along the horizontal line to the US Dollar, the percentage change displayed in the box will represent EUR (base)/USD (quote).
Preliminary HCOB Manufacturing PMI in Germany declined to 48.5 from 49.8 in August, reflecting an ongoing contraction in the private sector’s economic activity. On a positive note, HCOB Services PMI improved to 52.5 from 49.3 in this period.
In the Eurozone, the HCOB Manufacturing PMI declined to 49.5 from 50.7, pointing to a contraction in the manufacturing sector, while the Services PMI edged higher to 51.4 from 50.5.
Assessing the survey’s findings, “cost inflation in the services sector, which the European Central Bank (ECB) watches closely, has eased slightly but remains unusually high given the fragile economic backdrop,” Dr. Cyrus de la Rubia, Chief Economist at Hamburg Commercial Bank (HCOB), said and added: “Selling prices have cooled more noticeably, which might just prompt the ECB to consider whether a rate cut before year’s end could be back on the table.” The Euro struggles to attract buyers following the PMI data.
In the second half of the day, the US economic calendar will feature flash S&P Global PMIs for September. Markets expect the Composite PMI to hold steady at 54.6. In case the PMI data come in better than forecast, the immediate market reaction is likely to support the USD and vice versa.
Later in the American session, Federal Reserve (Fed) Chair Jerome Powell will deliver a speech on the economic outlook at the Greater Providence Chamber of Commerce 2025 Economic Outlook Luncheon.
The CME Group FedWatch Tool shows that markets see about a 25% probability of one more 25 basis-points rate cut this year. In case Powell hints that they could lower rates twice more by the end of the year, citing worsening conditions in the labor market, investors’ positioning suggests that there is room for further USD weakness. On the other hand, the USD could stay resilient against its peers and cause EUR/USD to stretch lower if Powell suggests that they will not commit to an aggressive policy easing and assess incoming data before deciding on interest rates in the upcoming meetings.
EUR/USD Technical Analysis
The Relative Strength Index (RSI) indicator on the 4-hour chart declines toward 50, reflecting a lack of buyer interest.
On the downside, the Fibonacci 23.6% retracement of the latest uptrend aligns as the first support level at 1.1770. In case EUR/USD drops below this level and starts using it as resistance, 1.1730 (100-period Simple Moving Average (SMA) on the 4-hour chart) could be seen as the next support level before 1.1690-1.1700 (Fibonacci 38.2% retracement, 200-period SMA) and 1.1640 (Fibonacci 50% retracement).
Looking north, an interim resistance level could be spotted at 1.1800 (static level, round level) ahead of 1.1850 (upper limit of the ascending channel) and 1.1870 (end-point of the uptrend).
Euro FAQs
The Euro is the currency for the 19 European Union countries that belong to the Eurozone. It is the second most heavily traded currency in the world behind the US Dollar. In 2022, it accounted for 31% of all foreign exchange transactions, with an average daily turnover of over $2.2 trillion a day.
EUR/USD is the most heavily traded currency pair in the world, accounting for an estimated 30% off all transactions, followed by EUR/JPY (4%), EUR/GBP (3%) and EUR/AUD (2%).
The European Central Bank (ECB) in Frankfurt, Germany, is the reserve bank for the Eurozone. The ECB sets interest rates and manages monetary policy.
The ECB’s primary mandate is to maintain price stability, which means either controlling inflation or stimulating growth. Its primary tool is the raising or lowering of interest rates. Relatively high interest rates – or the expectation of higher rates – will usually benefit the Euro and vice versa.
The ECB Governing Council makes monetary policy decisions at meetings held eight times a year. Decisions are made by heads of the Eurozone national banks and six permanent members, including the President of the ECB, Christine Lagarde.
Eurozone inflation data, measured by the Harmonized Index of Consumer Prices (HICP), is an important econometric for the Euro. If inflation rises more than expected, especially if above the ECB’s 2% target, it obliges the ECB to raise interest rates to bring it back under control.
Relatively high interest rates compared to its counterparts will usually benefit the Euro, as it makes the region more attractive as a place for global investors to park their money.
Data releases gauge the health of the economy and can impact on the Euro. Indicators such as GDP, Manufacturing and Services PMIs, employment, and consumer sentiment surveys can all influence the direction of the single currency.
A strong economy is good for the Euro. Not only does it attract more foreign investment but it may encourage the ECB to put up interest rates, which will directly strengthen the Euro. Otherwise, if economic data is weak, the Euro is likely to fall.
Economic data for the four largest economies in the euro area (Germany, France, Italy and Spain) are especially significant, as they account for 75% of the Eurozone’s economy.
Another significant data release for the Euro is the Trade Balance. This indicator measures the difference between what a country earns from its exports and what it spends on imports over a given period.
If a country produces highly sought after exports then its currency will gain in value purely from the extra demand created from foreign buyers seeking to purchase these goods. Therefore, a positive net Trade Balance strengthens a currency and vice versa for a negative balance.
Despite the stability of the GBPJPY pair in the last period below the barrier at 200.45, but the continuation of the main indicators’ contradiction that pushed it to form sideways trading by its repeated stability near 199.60.
We will keep waiting for gathering the extra negative momentum, to ease the mission of forming new correctional waves, to target 198.60 level reaching the extra support at 197.80, while breaching the barrier will turn the bullish track back, to begin recording extra gains by its rally towards 200.90 and 201.55.
The expected trading range for today is between 198.60 and 200.40
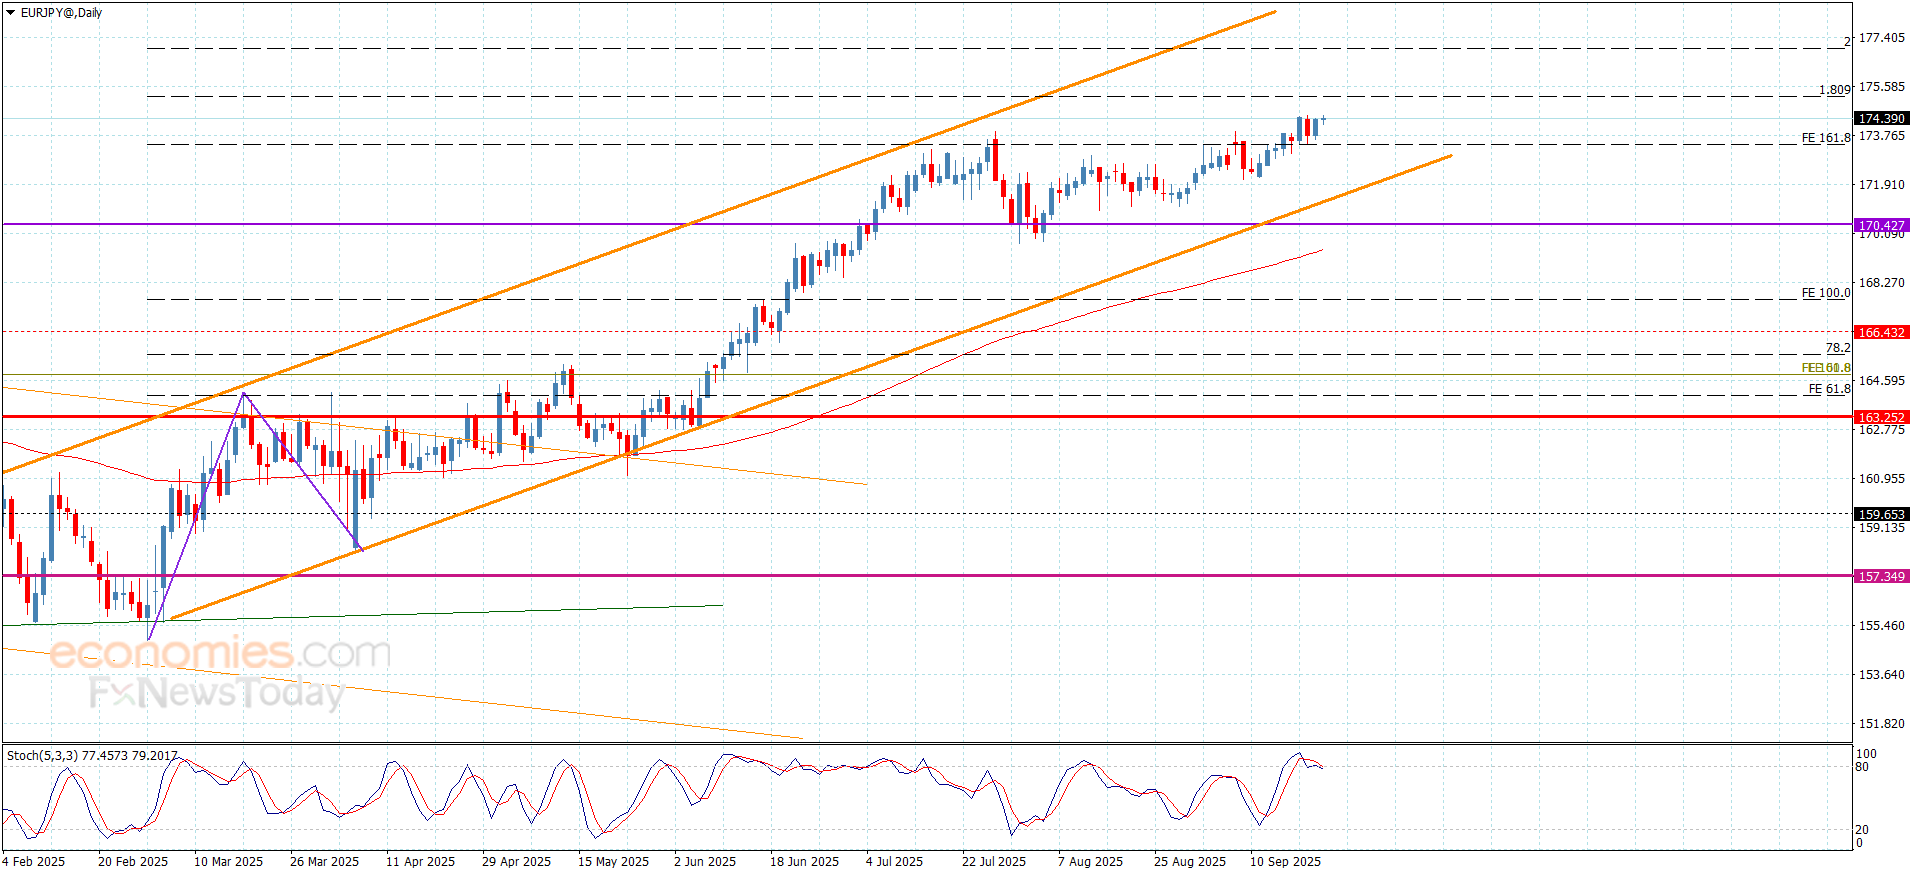
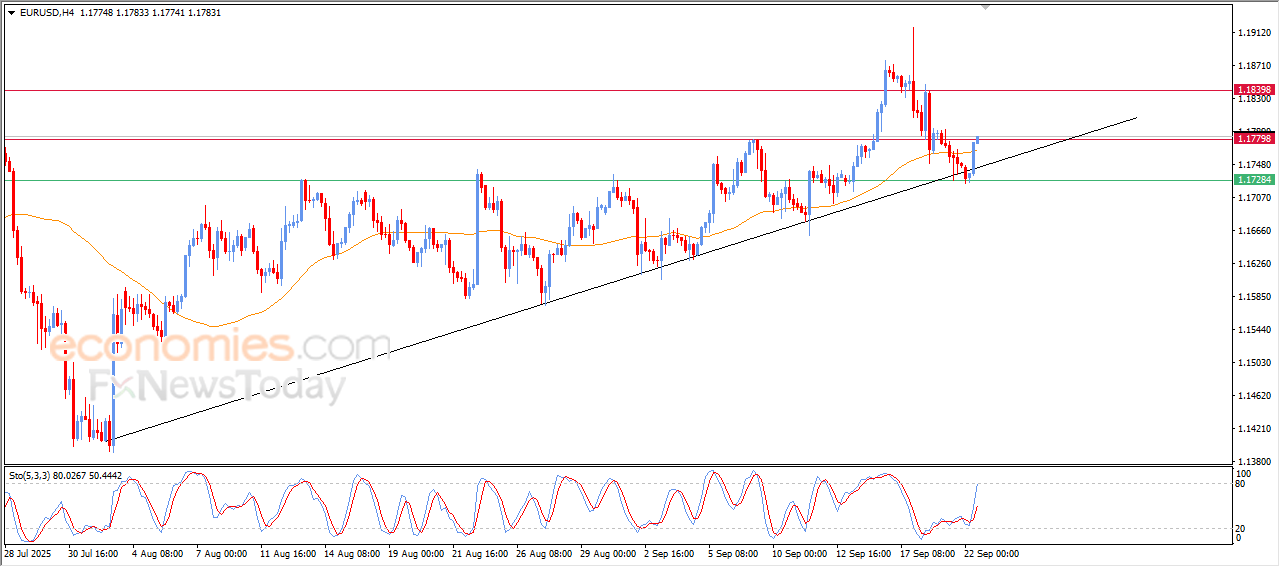
The EURJPY pair is forced to form bearish correction wave after hitting the target at 174.45, affected by stochastic attempt to exit the overbought level, noticing its fluctuation near the breached barrier, forming an extra support at 173.40.
The price success to settle above the current support will provide new chance for forming bullish waves, repeating the pressure on 174.40 level, and surpassing it will make it reach the next target near 175.20, while its surrender to the negative pressures by its move below the support will force it to delay the bullish attack, forming more of the correctional trading, to reach 172.80 initially, reaching the support of the bullish channel at 171.35.
The expected trading range for today is between 173.40 and 175.20
The Pound Sterling and the Euro currencies slipped to six-week lows near 1.1550 as UK fiscal worries resurfaced. Rising government borrowing, tighter budget risks and the Bank of England’s cautious policy stance weighed on sentiment.
Danske Bank now Pound-to-Euro exchange rate forecasts GBP/EUR sliding to 1.1235 over 12 months, while Macquarie expects a rebound towards 1.1765 into 2027.
GBP/EUR Forecasts: Fiscal fears return
Danske Bank forecasts that the Pound to Euro (GBP/EUR) exchange rate will weaken to 1.1235 on a 12-month view.
Macquarie notes potential short-term vulnerability, but expects GBP/EUR gains to 1.1765 by early 2027.
GBP/EUR dipped to 6-week lows near 1.1550 late in the week amid fresh concerns surrounding UK fundamentals.
According to Danske Bank; “We see domestic factors and the relative growth outlook between the UK and the euro area as becoming GBP negatives. This is further amplified by divergence in the fiscal policy outlook with UK fiscal policy set to be tightened in the Autumn.”
Macquarie played down the Pound risks; “Fiscal concerns occasionally make their presence felt and, when they do, the spectacle of sterling selling off in tandem with rising yields can be unsettling. But such episodes have been brief, and the present state of the UK yield curve can be largely explained by expectations for a persistently elevated policy rate, together with some spillover effects from a steepening of yield curves globally.”
The Bank of England held interest rates at 4.00% at the latest policy meeting, in line with strong consensus forecasts.
There was a 7-2 vote for the decision as Dhingra and Taylor voted for a further cut to 3.75%.
There was no significant shift in guidance with Bank Governor Bailey continuing to warn over the need for caution over any further cuts.
The latest government borrowing data was worse than expected with the August deficit at £18.0bn compared with £14.5bn the previous year.
Spending increased sharply over the year with central government’s current expenditure provisionally estimated as £89.1 billion from £81.3bn the previous year.
The data triggered fresh fears surrounding underlying fiscal trends as UK yields moved higher again.
RBC commented on the outlook; “Related to the Budget theme, we continue to see a strong sensitivity of GBP to moves in long-end rates. Typically, GBP should strengthen as yields rise, yet recently we have seen some “sell everything UK” moves where sterling, equities and bonds have all sold off in tandem as fiscal concerns sour investors perception of the UK.
Investment banks continue to discuss the outlook for BoE policy.
According to MUFG; “Recent data hasn’t produced any surprises and the bar for a November cut looks high after the finely balanced vote to cut in August. We continue to expect the next cut in December.”
MUFG added; “The onus will be on the data and there will be plenty of it between the next two meetings, and we suspect that Budget speculation will increasingly weigh on sentiment and activity. We then see gradual easing continuing in 2026 to a terminal rate of 3.25%.
Like this piece? Please share with your friends and colleagues:
International Money Transfer? Ask our resident FX expert a money transfer question or try John’s new, free, no-obligation personal service! ,where he helps every step of the way,
ensuring you get the best exchange rates on your currency requirements.
The euro rallied a bit in the early hours here on Monday to reach the 1.18 level. The 1.18 level is a large, round, psychologically significant figure that, of course, has been important multiple times. And if we can break above here, it opens up a move to the 1.19 level, possibly even the 1.20 level. Short-term pullbacks will continue to find plenty of momentum, I think, perhaps trying to break out, but there are a lot of questions out there about the risk appetite, and I think that will continue to be reflected in this pair. If we break down below the 1.17 level, we probably just sit right in that consolidation area for a while.
USD/JPY Technical Analysis
The US dollar initially tried to rally against the Japanese yen, but gave back the gains, and we find ourselves just sitting here. At the 200-day EMA, the Friday candlestick was a hammer. It looks like we might try to form some type of negative shooting star candle. So, I think this is a market that just really doesn’t have anywhere to be at the moment, with the 146 yen level offering support and the 149 yen level offering resistance.
EUR/USD clings to small daily gains above 1.1750 on Monday.
The technical outlook doesn’t yet point to a buildup of bullish momentum.
Markets await comments from ECB and Fed policymakers.
Following the bearish action seen in the second half of the previous week, EUR/USD corrects higher on Monday and trades above 1.1750. As investors await comments from central bank officials, the pair’s technical outlook doesn’t yet reflect a buildup of recovery momentum.
Euro Price Last 7 Days
The table below shows the percentage change of Euro (EUR) against listed major currencies last 7 days. Euro was the weakest against the Swiss Franc.
USD
EUR
GBP
JPY
CAD
AUD
NZD
CHF
USD
-0.24%
0.42%
0.16%
-0.23%
0.75%
1.58%
-0.27%
EUR
0.24%
0.69%
0.35%
0.00%
1.03%
1.78%
-0.04%
GBP
-0.42%
-0.69%
-0.26%
-0.67%
0.34%
1.09%
-0.83%
JPY
-0.16%
-0.35%
0.26%
-0.41%
0.63%
1.41%
-0.43%
CAD
0.23%
-0.01%
0.67%
0.41%
1.09%
1.77%
-0.16%
AUD
-0.75%
-1.03%
-0.34%
-0.63%
-1.09%
0.75%
-1.09%
NZD
-1.58%
-1.78%
-1.09%
-1.41%
-1.77%
-0.75%
-1.90%
CHF
0.27%
0.04%
0.83%
0.43%
0.16%
1.09%
1.90%
The heat map shows percentage changes of major currencies against each other. The base currency is picked from the left column, while the quote currency is picked from the top row. For example, if you pick the Euro from the left column and move along the horizontal line to the US Dollar, the percentage change displayed in the box will represent EUR (base)/USD (quote).
EUR/USD registered losses for three consecutive days to end the week as the US Dollar (USD) benefited from the Federal Reserve’s cautious tone on aggressive policy easing moving further.
Assessing the Fed’s policy outlook and the USD’s futures, “despite Fed Chair Jerome Powell’s cautionary tone, the FOMC has clearly shifted to a dovish stance where it sees multiple cuts, and the focus is now firmly on the employment side of the mandate,” noted ING analysts and added:
“Our call is for two more 25 basis-points cuts this year, and we see the cheapening of the Dollar’s funding cost as driving more depreciation in an already seasonally weak end of the year for the greenback.”
The US economic calendar will not feature any high-tier data releases on Monday. Several Fed policymakers will be delivering speeches during the American trading hours. In case Fed officials reiterate that they will not commit to a steady easing of the policy, citing upside risks to inflation, the USD could stay resilient against its rivals and make it difficult for EUR/USD to gather bullish momentum.
European Central Bank (ECB) Chief Economist Philip Lane and Governing Council Member Joachim Nagel will also be speaking in the second half of the day. ECB policymaker Mario Centeno said on Friday that the ECB’s next move is likely to be a rate cut, noting that he still sees inflation risks to the downside. Similar remarks from ECB officials could be negative for the Euro with the immediate reaction.
EUR/USD Technical Analysis
The Fibonacci 23.6% retracement of the latest uptrend aligns as a pivot level at 1.1770. In case EUR/USD fails to clear this level, technical buyers could be discouraged. In this scenario, 1.1730 (100-period Simple Moving Average (SMA) on the 4-hour chart) could be seen as the first support level before 1.1690-1.1700 (Fibonacci 38.2% retracement, 200-period SMA) and 1.1640 (Fibonacci 50% retracement).
Looking north, resistance levels could be spotted at 1.1800 (static level, round level), 1.1850 (upper limit of the ascending channel) and 1.1870 (end-point of the uptrend).
Euro FAQs
The Euro is the currency for the 19 European Union countries that belong to the Eurozone. It is the second most heavily traded currency in the world behind the US Dollar. In 2022, it accounted for 31% of all foreign exchange transactions, with an average daily turnover of over $2.2 trillion a day.
EUR/USD is the most heavily traded currency pair in the world, accounting for an estimated 30% off all transactions, followed by EUR/JPY (4%), EUR/GBP (3%) and EUR/AUD (2%).
The European Central Bank (ECB) in Frankfurt, Germany, is the reserve bank for the Eurozone. The ECB sets interest rates and manages monetary policy.
The ECB’s primary mandate is to maintain price stability, which means either controlling inflation or stimulating growth. Its primary tool is the raising or lowering of interest rates. Relatively high interest rates – or the expectation of higher rates – will usually benefit the Euro and vice versa.
The ECB Governing Council makes monetary policy decisions at meetings held eight times a year. Decisions are made by heads of the Eurozone national banks and six permanent members, including the President of the ECB, Christine Lagarde.
Eurozone inflation data, measured by the Harmonized Index of Consumer Prices (HICP), is an important econometric for the Euro. If inflation rises more than expected, especially if above the ECB’s 2% target, it obliges the ECB to raise interest rates to bring it back under control.
Relatively high interest rates compared to its counterparts will usually benefit the Euro, as it makes the region more attractive as a place for global investors to park their money.
Data releases gauge the health of the economy and can impact on the Euro. Indicators such as GDP, Manufacturing and Services PMIs, employment, and consumer sentiment surveys can all influence the direction of the single currency.
A strong economy is good for the Euro. Not only does it attract more foreign investment but it may encourage the ECB to put up interest rates, which will directly strengthen the Euro. Otherwise, if economic data is weak, the Euro is likely to fall.
Economic data for the four largest economies in the euro area (Germany, France, Italy and Spain) are especially significant, as they account for 75% of the Eurozone’s economy.
Another significant data release for the Euro is the Trade Balance. This indicator measures the difference between what a country earns from its exports and what it spends on imports over a given period.
If a country produces highly sought after exports then its currency will gain in value purely from the extra demand created from foreign buyers seeking to purchase these goods. Therefore, a positive net Trade Balance strengthens a currency and vice versa for a negative balance.