The main tag of Forex News Today Articles.
You can use the search box below to find what you need.
[wd_asp id=1]

12 01, 2025

Pound to Dollar Forecast for Week Ahead: Sell to 1.1750?

By |2025-01-12T23:25:08+02:00January 12, 2025|Forex News, News|0 Comments

January 12, 2025 – Written by Tim Boyer

MUFG recommends selling the Pound to Dollar (GBP/USD) exchange rate with a target of 1.1750.

There was a slide in UK bonds during the week with a jump in yields as the 10-year yield hit a 16-year high while the 30-year yield hit the highest level since 1998.

Upward pressure on US yields contributed to the selling of US bonds.

There were fears that the government’s economic strategy would unravel with pressure for fiscal tightening. There were fears over a negative impact on UK growth.

This combination undermined confidence in the pound, resulting in losses across all major currencies.

GBP/USD posted sharp losses with 14-month lows just below 1.2200.

MUFG expects that ongoing pressure on the UK bond market will work in tandem with further Pound selling; “If Gilt yields continue to push higher, adding to the UK government’s funding costs, doubts will continue to build over fiscal plans triggering a further loss of confidence in the GBP.”

Advertisement


It added, “We are not expecting the BoE or government to step up and support the Gilt market in the near-term, leaving it vulnerable to further near-term weakness.”

MUFG also noted the negative implications of higher energy prices.

US developments have added to pressure on global bond markets and contributed to upward pressure on UK bond yields, a twin negative for GBP/USD.

US non-farm payrolls increased 256,000 for December compared with consensus forecasts of around 165,000, while the November increase was revised slightly lower to 212,000 from the flash reading of 227,000.

The unemployment rate declined to 4.1% from 4.2% and compared with expectations of no change.

The University of Michigan consumer confidence data also recorded an increase in 5-year inflation expectations to a 16-year high.

Following the data, markets ruled out the potential for a Fed rate cut in January and considered that the chances of a March cut had dipped to around 25%.

Markets also considered that the Fed may only cut rates once during the year.

Bank of America, for example, now expects that there will not be any further rate cuts this year.

The US 10-year bond yield increased to above 4.75%, the highest level since October 2023, maintaining pressure on the UK bond market.

Seema Shah, chief global strategist at Principal Asset Management, noted the adverse global implications; “The important payroll beat will be good news for the U.S. economy and the US dollar, unwelcome news for equities as they seek interest rate relief, and punishing news for global bond markets, particularly UK gilts.”

She added, “For global bonds, the strength of the U.S. jobs report just adds to their challenges. The peak for yields has not yet been reached, suggesting additional stresses that several markets, especially the UK, can ill afford.”

Rabobank expressed concerns over the UK fundamentals; “the UK is a price taker in sovereign debt markets, particularly exposed to the whims of foreign/nonbank investors because of its fiscal deficit and its current account deficit.”

The bank’s economists expect that the government will have to announce further fiscal tightening in the March budget.

It added, “If so, that would work out disinflationary instead of inflationary, and that would give the BoE enough policy space to at least stick to their theme of gradualism.”

It expects quarterly interest rate cuts by the BoE.

SocGen added, “GBP/USD is likely to remain under pressure due to US economic strength and a widening US-Europe/Asia rate differential.”

Capital Economics chief UK economist Paul Dales put the developments in context; “This week’s leap in gilt yields creates more problems for the Chancellor and is an extra headwind for the economy. But it is not a crisis and the cause mostly originates overseas rather than being home-grown.”

Bank of America also noted the risk of dollar logs being cut; “A USD reversal, if it happens, could be amplified by trend follower unwinds.”

It did, however, add, “Lingering fiscal and inflation concerns, coupled with negative sentiment, suggest caution before re-entering GBP longs.”

UBS will still look to buy Pound dips; “While we do not expect significant near-term weakness, we think that investors should use further strength in the dollar to diversify into other preferred currencies, including the British pound and Australian dollar.”

Like this piece? Please share with your friends and colleagues:


International Money Transfer? Ask our resident FX expert a money transfer question or try John’s new, free, no-obligation personal service! ,where he helps every step of the way,
ensuring you get the best exchange rates on your currency requirements.

TAGS: Currency Predictions Pound Dollar Forecasts

Source link

12 01, 2025

Weekly Forex Forecast – 12/01: (Charts)

By |2025-01-12T21:24:38+02:00January 12, 2025|Forex News, News|0 Comments

Fundamental Analysis & Market Sentiment

I wrote on 5th January that the best trade opportunities for the week were likely to be:

The weekly profit of 0.90% equals 0.45% per asset.

Last week saw several key data releases, although the directional movement was average:

  1. US Average Hourly Earnings – as expected, showing a month-on-month increase of 0.3%.
  2. US FOMC Meeting Minutes – no real surprises, notable takeaway was warnings on inflation reaching 2% target.
  3. US Non-Farm Payrolls – there was a strong outperformance, with almost twice as many new jobs created than was expected.
  4. US JOLTS Job Openings – notably stronger than expected, mirroring the item above.
  5. US ISM Services PMI – a little better than expected.
  6. German Preliminary CPI (inflation) – slightly higher than expected.
  7. Australian CPI (inflation) – slightly higher than expected.
  8. Swiss CPI (inflation) – as expected.
  9. US Unemployment Claims – slightly lower than expected.
  10. US Unemployment Rate – an unexpected fall to 4.1%.
  11. Canadian Unemployment Rate – unexpectedly fell to 6.7% from 6.8%, when it was expected to rise to 6.9%.

Last week saw continued risk-off sentiment, with particular fears of President-Elect Trump’s recent tariff threats and of slowing growth data in many G20 nations. This was accompanied by an ongoing bullish focus on the US Dollar, with US treasury yields rising and the anticipated tariffs boosting the greenback and hitting other currencies, notably commodity currencies.

The British Pound and the Australian and New Zealand Dollars are notably weak in the Forex market, while the US Dollar and the Japanese Yen are strong.

The high-impact data last week showed that the US economy is still hot, which in turn boosts expectations of a slower pace of US interest rate cuts, and keeps the US Dollar advancing to new 2-year high prices.

Another standout issue last week was growing alarm at the state of the UK’s finances, with the new British government rapidly losing credibility in the market, which is sinking the British Pound. The British government is trying to weather the storm by stating its fiscal rules are “non-negotiable”.

The Week Ahead: 13th – 17th January

The coming week has an even more vital schedule of releases, so we are very likely to see increased market activity and volatility in the Forex market.

The coming week’s important data points are:

  1. US CPI (inflation)
  2. US PPI
  3. US Retail Sales
  4. UK CPI (inflation)
  5. UK GDP
  6. US Unemployment Claims
  7. UK Retail Sales
  8. Australian Unemployment Rate

Monday is a public holiday in Japan.

Monthly Forecast January 2025

For January, I forecasted that the USD/JPY currency pair would rise in value and that the EUR/USD currency pair would fall in value. The performance so far of this forecast is:

Weekly Forex Forecast – 12/01: (Charts)

Weekly Forecast 12th January 2025

Last week, I made no weekly forecast as there were no unusually strong price movements in currency crosses, which is the basis of my trading strategy.

The US Dollar was the strongest major currency last week, while the British Pound was the weakest. Volatility was slightly lower last week, with 26% of the most important Forex currency pairs and crosses changing in value by more than 1%. It is likely to remain at a similar level over the coming week.

You can trade these forecasts in a real or demo Forex brokerage account.

Key Support/Resistance Levels for Popular Pairs

Weekly Forex Forecast – 12/01: (Charts)

Technical Analysis

US Dollar Index

Last week, the US Dollar Index again printed a bullish candlestick that continued the long-term bullish trend, again bullishly breaking out to make its highest close in more than 2 years. The price is above its price from three and six months ago, suggesting a healthy long-term bullish trend in the greenback that should be exploitable. The weekly candlestick has little upper wick and closed above the previous week’s high. These are bullish signs.

I have plenty of fundamental reasons to be bullish on the US Dollar after seeing the US unemployment rate unexpectedly fall to 4.1% after higher-than-expected non-farm payrolls data last week. We also seeing US 10-Year Treasury Yields rising to levels not seen in several months, currently above 4.75%, which is helping boost the greenback.

The Dollar is likely to rise over the coming week. The price has room to rise to at least the next resistance level at 110.00.

Weekly Forex Forecast – 12/01: (Charts)

GBP/USD

The GBP/USD currency pair is in a valid long-term bearish trend. It fell strongly last week, with the weekly candlestick shown in the price chart below closing very near its low with little lower wick, suggesting bearish momentum. The price reached a 1-year low on unusually high volatility, which is another sign of momentum in this currency pair.

This pair was the biggest mover last week and is in focus because both currencies are newsworthy.

The US Dollar is advancing to new 2-year highs in a strong bullish trend, boosted by incoming President Trump’s policies and their likely momentary consequences of higher for longer interest rates. Rising US yields, especially 10-year yields, are pushing the greenback higher.

On the other hand, the British Pound has suddenly become very weak as the new British government becomes unpopular very quickly, with its fiscal projections and monetary policies beginning to be called into serious question by the capital markets. Bets against the British Pound using options have reached historically high levels.

I see this currency pair as an obvious sell.

Weekly Forex Forecast – 12/01: (Charts)

EUR/USD

The EUR/USD currency pair is in a valid long-term bearish trend. After a period of consolidation within this trend, the price has begun to move lower with stronger bearish momentum. The price reached a new 2-year low last week but was ultimately held by the support level at $1.0223.

This currency pair often has very reliable trends, so I am interested in being short, especially as the price is now trading in “blue sky”.

The Euro is not especially weak, with the bearish momentum being driven mostly by a strong US Dollar which is advancing almost everywhere.

I see this currency pair as a sell, in fact, it is probably the most reliable trade right now in the entire Forex market, with the possible exception of the GBP/USD currency pair, which is probably dragging the price here lower.

Weekly Forex Forecast – 12/01: (Charts)

USD/JPY

The USD/JPY currency pair was not impressive last week, as it was notable that the Japanese Yen was not willing to fall significantly against the very strong USD. This led to this currency pair being one of the few ones where the US Dollar made only a very small gain, ending the week quite a way off its highest daily close at ¥155.34.

I think this pair’s failure to seriously rise shows that the days of a weak Japanese Yen might really be coming to an end, even though this pair is technically in a long-term bullish trend. However, the weekly candlestick was not far from being a doji, showing indecision in the price action.

Another factor lowering my confidence in the bullish trend is that the Bank of Japan will eventually start implementing a more hawkish monetary policy. When that finally really starts to happen with the Bank of Japan’s next rate hike, the price will be very likely to start moving down, so the trend is vulnerable to policy.

The Yen is also benefitting from the flow out of stock markets looking for a safe haven.

Technically, a daily close above ¥155.34 could be a good long trade entry signal, but I doubt it.

Weekly Forex Forecast – 12/01: (Charts)

AUD/USD

Last week, the AUD/USD currency pair printed a very strongly bearish and large outside candlestick, closing right on its low, which was a new 4-year low. A look at the weekly chart below shows that the bearish momentum has been strong here since October, and the trend here has been stronger and clearer than any other trend in the Forex market, except maybe the one in the USD/CAD currency pair. It is difficult to image being more technically bearish. The linear regression analysis applied within the price chart below shows the strength and reliability of the trend over the past few months.

The story is really about US economic success and a more hawkish Fed boosting the greenback, while Australia is dealing with a weakening economy which will make more rate cuts a matter of necessity, and this will probably have to go increasingly deeper. Adding to the pressure on the Aussie is the fact that stock markets and other risky assets have been selling off, and the Aussie tends to perform poorly during periods of risk-off sentiment such as we have seen in recent days. On the other hand, the Aussie has been selling off even as several stock indices made record highs over recent months, so maybe this is not such a big factor.

This currency pair does not trend very reliably, so I don’t take long-term trades in it, but it certainly looks very weak. All the commodity currencies except maybe the Canadian Dollar are looking weak right now, so it might be an idea to use the AUD and the NZD together as the short component of any Forex trades you are making this week, or at least part of the short component by creating a basket. For example, if you were short two lots EUR/USD, you might also be one lot of AUD/USD long.

Weekly Forex Forecast – 12/01: (Charts)

Natural Gas Futures

Last week, Natural Gas futures printed a strong and quite large bullish candlestick, which closed right on its high at a new 4-year high closing price, after it made a new 4-year high price the previous week before giving up some of its earlier gains.

Natural gas has been driven higher by strong demand due to cold weather in the USA and Europe. However, there are obviously deeper factors at work which are pushing the price to new highs and triggering a real bullish breakout last week.

Taking long trades when major commodities break out to new 6-month highs has historically been a very profitable trading strategy, which is the main reason that I want to get long here when the market opens on Monday. This bullish price pattern shown in the chart below is just starting to show an expansion of volatility, and we could see a very strong rise as the price has plenty of room to advance, especially once it clears the big round number at $4.

Micro futures in natural gas are available at the CME, so this commodity can be quite affordable to trade. There are also ETFs which hold natural gas such as UNG but note that the price of UNG is looking much less bullish than natural gas futures are, so it might not be a good idea to use that right now.

Weekly Forex Forecast – 12/01: (Charts)

Corn Futures

Last Friday, Corn futures printed a strong and large bullish candlestick, which closed at a new 6-month high closing price. However, it is notable that the price has not cleared the inflection point at 475. I think once this is cleared, the price will look much more bullish, so more cautious traders might want to wait for the price to make a bullish breakout beyond 475.

Taking long trades when major commodities break out to new 6-month highs has historically been a very profitable trading strategy, which is the main reason that I want to get long here. However, I do not have as much faith in this trade as I do in the natural gas trade I outlined above.

Unfortunately, Corn futures are quite expensive and just too large for retail traders, but there is an ETF called CORN which can be used to participate in increases in the price of corn. Here, this ETF is outperforming the relevant futures, which puts a bit of a question mark above corn.

I think it will be wise to wait for a daily close above 475 in corn futures before going long.

Weekly Forex Forecast – 12/01: (Charts)

Bottom Line

I see the best trading opportunities this week as:

  • Short of the EUR/USD currency pair.
  • Long of Natural Gas futures.
  • Long of Corn futures following a daily close above 475 (CORN etf can also be used).

Ready to trade our  weekly Forex forecast? Check out our list of the top 10 Forex brokers in the world.

Source link

12 01, 2025

EUR/USD forecast remains bearish ahead of US CPI

By |2025-01-12T13:20:39+02:00January 12, 2025|Forex News, News|0 Comments

The EUR/USD fell to a new multi-year low of just shy of 1.0200, before bouncing modestly off its earlier lows. The currency pair is now on track to drop for the fourth consecutive month. In the last 15 weeks, it has only managed two small positive weekly closes. The bearish momentum has been gathering pace, owing largely to a strengthening US dollar. Meanwhile, weak growth in the Eurozone and China have also weighed on the single currency, not to mentioned ongoing political turmoil in Germany and France. Against this backdrop, the EUR/USD forecast remains bearish, and we could see the pair drop below $1.02 handle in the early parts of the week ahead.


EUR/USD forecast: Why has the dollar been rising?


The greenback has been supported by investors repricing US interest rates higher due, first and foremost, to expectations of inflationary policies under Donald Trump, when he takes office later this month. At the same time, we have seen surprising strength in US data. This was again highlighted by the non-farm payrolls report on Friday, pointing to a labour market that appears to be gaining momentum again. Consequently, traders have now shifted the full pricing of the next Fed rate cut all the way to the start of Q4. Consequently, US bond yields have pushed further higher, with the benchmark 10-year now yielding 4.76% – and getting closer to last year’s high of 5.02% that was hit in October, just before the Fed pivoted. Due to this hawkish repricing of US interest rates, the EUR/USD forecast remains bearish as we look forward to another week of volatility. US CPI and Chinese GDP are among the data highlight to watch.


EUR/USD forecast

Source: TradingView.com


So, how strong was the jobs growth?


Well, it was almost extremely robust. While revisions shaved about 8K off the previous two months’ figures, the December payrolls report significantly outperformed expectations. Markets reacted swiftly: stock index futures sold off, and the dollar gained strength against all major currencies, except the yen. The unemployment rate also declined to 4.1% from 4.2%, bolstering the argument for an extended pause in policy changes from the Fed. Meanwhile, average earnings met expectations, rising 0.3% month-over-month and 3.9% year-over-year, slightly down from 4.0%. The combination of strong headline job gains and steady wage growth highlights a resilient labour market.


Attention turns to US CPI and Chinese growth


Should CPI inflation data on Wednesday show signs of persisting, any calls for a rate cut in the first half of the year will be firmly dismissed again. In any case, the upside potential for the EUR/USD is likely to be limited until something changes fundamentally. Thus, if CPI is to cause a shift in the market, it will have to be significantly weaker to cause a major dent in the dollar’s bullish trend or the EUR/USD’s bearish trend.

On Friday, we will have some important data from China. In addition to GDP figures, the day will bring the latest retail sales and industrial production data from the world’s second-largest economy. China’s gloomy economic outlook has driven a surge in demand for Chinese bonds, pushing down yields, local stock prices, and the yuan. It has also had a negative influence on the EUR/USD exchange rate. Stronger data will be crucial to alleviating concerns about a potential deflationary spiral in the Chinese economy. But if data reveals weakening growth, then this should further weigh on Chinese assets, and undermine the EUR/USD forecast.


— Written by Fawad Razaqzada, Market Analyst

Follow Fawad on Twitter @Trader_F_R


Source link

12 01, 2025

EUR/USD forecast remains bearish ahead of US CPI

By |2025-01-12T09:19:11+02:00January 12, 2025|Forex News, News|0 Comments

The EUR/USD fell to a new multi-year low of just shy of 1.0200, before bouncing modestly off its earlier lows. The currency pair is now on track to drop for the fourth consecutive month. In the last 15 weeks, it has only managed two small positive weekly closes. The bearish momentum has been gathering pace, owing largely to a strengthening US dollar. Meanwhile, weak growth in the Eurozone and China have also weighed on the single currency, not to mentioned ongoing political turmoil in Germany and France. Against this backdrop, the EUR/USD forecast remains bearish, and we could see the pair drop below $1.02 handle in the early parts of the week ahead.


EUR/USD forecast: Why has the dollar been rising?


The greenback has been supported by investors repricing US interest rates higher due, first and foremost, to expectations of inflationary policies under Donald Trump, when he takes office later this month. At the same time, we have seen surprising strength in US data. This was again highlighted by the non-farm payrolls report on Friday, pointing to a labour market that appears to be gaining momentum again. Consequently, traders have now shifted the full pricing of the next Fed rate cut all the way to the start of Q4. Consequently, US bond yields have pushed further higher, with the benchmark 10-year now yielding 4.76% – and getting closer to last year’s high of 5.02% that was hit in October, just before the Fed pivoted. Due to this hawkish repricing of US interest rates, the EUR/USD forecast remains bearish as we look forward to another week of volatility. US CPI and Chinese GDP are among the data highlight to watch.


EUR/USD forecast

Source: TradingView.com


So, how strong was the jobs growth?


Well, it was almost extremely robust. While revisions shaved about 8K off the previous two months’ figures, the December payrolls report significantly outperformed expectations. Markets reacted swiftly: stock index futures sold off, and the dollar gained strength against all major currencies, except the yen. The unemployment rate also declined to 4.1% from 4.2%, bolstering the argument for an extended pause in policy changes from the Fed. Meanwhile, average earnings met expectations, rising 0.3% month-over-month and 3.9% year-over-year, slightly down from 4.0%. The combination of strong headline job gains and steady wage growth highlights a resilient labour market.


Attention turns to US CPI and Chinese growth


Should CPI inflation data on Wednesday show signs of persisting, any calls for a rate cut in the first half of the year will be firmly dismissed again. In any case, the upside potential for the EUR/USD is likely to be limited until something changes fundamentally. Thus, if CPI is to cause a shift in the market, it will have to be significantly weaker to cause a major dent in the dollar’s bullish trend or the EUR/USD’s bearish trend.

On Friday, we will have some important data from China. In addition to GDP figures, the day will bring the latest retail sales and industrial production data from the world’s second-largest economy. China’s gloomy economic outlook has driven a surge in demand for Chinese bonds, pushing down yields, local stock prices, and the yuan. It has also had a negative influence on the EUR/USD exchange rate. Stronger data will be crucial to alleviating concerns about a potential deflationary spiral in the Chinese economy. But if data reveals weakening growth, then this should further weigh on Chinese assets, and undermine the EUR/USD forecast.


— Written by Fawad Razaqzada, Market Analyst

Follow Fawad on Twitter @Trader_F_R


Source link

12 01, 2025

British Pound Technical Forecast: GBP/USD, GBP/JPY, EUR/GBP

By |2025-01-12T07:18:11+02:00January 12, 2025|Forex News, News|0 Comments

British Pound Talking Points:

  • It was a rough week for the British Pound, as GBP sold-off against all of the Euro, U.S. Dollar and Japanese Yen.
  • Next Wednesday is key as we’ll see the next release of UK CPI ahead of the release of US CPI data.

It was a brutal week for the British Pound as the currency lost against all of the U.S. Dollar, the Euro and the Japanese Yen. In the major pair of GBP/USD, a fresh yearly low came into play as the final four days of the week produced a move that dropped by more than 380 pips, at one point. Perhaps more disconcerting for Sterling bulls is where the move took place, as a prior support at 1.2300 was taken-out before a bounce developed from 1.2250. But even that couldn’t last as the Friday NFP report helped to produce another downside thrust in the move until price breached the 1.2200 level.

At this point, there’s no sign yet of bears letting up and the next major level of contention below current price is the 1.2000 psychological level that hasn’t traded since early-2023.


GBP/USD Weekly Price Chart

gbpusd weekly 11025Chart prepared by James Stanley, GBP/USD on Tradingview


GBP/USD


At this point the challenge on Cable is how established the move has become. As of this writing RSI is pushing back into oversold territory on the daily chart and this would be the first such occurrence of that since November. This, of course, does not preclude bearish continuation, but it does urge caution from chasing, and given prior short-term support structure, there are a few areas of note that bears can look to for lower-high resistance.

The psychological level of 1.2250 is of interest, after which the Fibonacci level I had looked at earlier in the week at 1.2297 comes into the picture. And above that is another Fibonacci level at 1.2367.


GBP/USD Daily Chart

gbpusd daily 11025Chart prepared by James Stanley, GBP/USD on Tradingview


GBP/JPY


GBP/JPY printed an evening star formation that confirmed on Wednesday, and that led to a strong sell-off on Thursday and Friday. But similarly, there were some items of note at key support zones last week. I had looked at the 193.61-194.11 zone in the Wednesday article as this is the bottom portion of a gap from back in 2008. That area led to a bounce on Thursday but sellers caught the break on Friday, making a strong push down to a fresh monthly low.

For next week, the focus is on deeper support, looking to the 190.81 Fibonacci level which is nearing confluence with a bullish trendline drawn from August and December swing-lows.


GBP/JPY Daily Price Chart

gbpjpy daily 11025Chart prepared by James Stanley, GBP/JPY on Tradingview


EUR/GBP


As of this writing EUR/GBP has gained 1.09% this week, which would stand as the largest weekly gain for the pair since January of 2023. The pair rallied up to the 23.6% retracement of the two-year-move, and this follows almost two months of stalling after sellers were unable to elicit any significant bearish continuation below .8260.


EUR/GBP Weekly Price Chart

eurgbp weekly 11025Chart prepared by James Stanley, EUR/GBP on Tradingview


EUR/GBP Shorter-Term


Given the breakout to a fresh two-month high, the next natural question is whether a bullish trend can follow Given prior price structure, there’s now support potential around prior resistance, and I’m tracking this from around .8311 up to .8328. And for next resistance, there’s a prior swing-high at .8448 before the psychological level of .8500 would come back into play.


EUR/GBP Daily Price Chart

eurgbp daily 11025Chart prepared by James Stanley, EUR/GBP on Tradingview


— written by James Stanley, Senior Strategist


Source link

12 01, 2025

British Pound Technical Forecast: GBP/USD, GBP/JPY, EUR/GBP

By |2025-01-12T05:17:22+02:00January 12, 2025|Forex News, News|0 Comments

British Pound Talking Points:

  • It was a rough week for the British Pound, as GBP sold-off against all of the Euro, U.S. Dollar and Japanese Yen.
  • Next Wednesday is key as we’ll see the next release of UK CPI ahead of the release of US CPI data.

It was a brutal week for the British Pound as the currency lost against all of the U.S. Dollar, the Euro and the Japanese Yen. In the major pair of GBP/USD, a fresh yearly low came into play as the final four days of the week produced a move that dropped by more than 380 pips, at one point. Perhaps more disconcerting for Sterling bulls is where the move took place, as a prior support at 1.2300 was taken-out before a bounce developed from 1.2250. But even that couldn’t last as the Friday NFP report helped to produce another downside thrust in the move until price breached the 1.2200 level.

At this point, there’s no sign yet of bears letting up and the next major level of contention below current price is the 1.2000 psychological level that hasn’t traded since early-2023.


GBP/USD Weekly Price Chart

gbpusd weekly 11025Chart prepared by James Stanley, GBP/USD on Tradingview


GBP/USD


At this point the challenge on Cable is how established the move has become. As of this writing RSI is pushing back into oversold territory on the daily chart and this would be the first such occurrence of that since November. This, of course, does not preclude bearish continuation, but it does urge caution from chasing, and given prior short-term support structure, there are a few areas of note that bears can look to for lower-high resistance.

The psychological level of 1.2250 is of interest, after which the Fibonacci level I had looked at earlier in the week at 1.2297 comes into the picture. And above that is another Fibonacci level at 1.2367.


GBP/USD Daily Chart

gbpusd daily 11025Chart prepared by James Stanley, GBP/USD on Tradingview


GBP/JPY


GBP/JPY printed an evening star formation that confirmed on Wednesday, and that led to a strong sell-off on Thursday and Friday. But similarly, there were some items of note at key support zones last week. I had looked at the 193.61-194.11 zone in the Wednesday article as this is the bottom portion of a gap from back in 2008. That area led to a bounce on Thursday but sellers caught the break on Friday, making a strong push down to a fresh monthly low.

For next week, the focus is on deeper support, looking to the 190.81 Fibonacci level which is nearing confluence with a bullish trendline drawn from August and December swing-lows.


GBP/JPY Daily Price Chart

gbpjpy daily 11025Chart prepared by James Stanley, GBP/JPY on Tradingview


EUR/GBP


As of this writing EUR/GBP has gained 1.09% this week, which would stand as the largest weekly gain for the pair since January of 2023. The pair rallied up to the 23.6% retracement of the two-year-move, and this follows almost two months of stalling after sellers were unable to elicit any significant bearish continuation below .8260.


EUR/GBP Weekly Price Chart

eurgbp weekly 11025Chart prepared by James Stanley, EUR/GBP on Tradingview


EUR/GBP Shorter-Term


Given the breakout to a fresh two-month high, the next natural question is whether a bullish trend can follow Given prior price structure, there’s now support potential around prior resistance, and I’m tracking this from around .8311 up to .8328. And for next resistance, there’s a prior swing-high at .8448 before the psychological level of .8500 would come back into play.


EUR/GBP Daily Price Chart

eurgbp daily 11025Chart prepared by James Stanley, EUR/GBP on Tradingview


— written by James Stanley, Senior Strategist


Source link

11 01, 2025

GBP/USD Weekly Forecast: Surprised US NFP Threatens Pound

By |2025-01-11T23:14:18+02:00January 11, 2025|Forex News, News|0 Comments

  • Business activity in the US services sector improved more than expected.
  • The US economy added 256,000 jobs in December.
  • US unemployment dropped to 4.1%, below estimates of 4.2%.

The GBP/USD weekly forecast suggests further weakness as the US dollar picks momentum after robust jobs data. 

Ups and downs of GBP/USD 

The GBP/USD pair had a bearish week as the dollar rallied amid upbeat US economic data. Figures revealed that business activity in the services sector improved more than expected. Meanwhile, employment numbers were mostly better than expected.

-Are you looking for tips for forex trading? Check out the details-

Notably, the nonfarm payrolls report on Friday showed an unexpected surge in job growth and a drop in the unemployment rate. The US economy added 256,000 jobs in December, compared to forecasts of 164,000. Meanwhile, unemployment dropped to 4.1%, below estimates of 4.2%. Consequently, Fed rate cut bets plunged, boosting the dollar.

Next week’s key events for GBP/USD

Next week, market participants will focus on inflation and retail sales data from the US and the UK. At the same time, the UK will release figures on manufacturing production and GDP. The US wholesale and consumer inflation numbers will shape the outlook for future Fed rate cuts. Recent reports have shown that inflation has paused its decline to the 2% target. Another upbeat report will lower expectations for rate cuts, boosting the greenback. 

Similarly, UK inflation and retail sales will guide the outlook for Bank of England rate cuts. Upbeat reports will lower bets for rate cuts, while downbeat numbers will further hurt the pound.

GBP/USD weekly technical forecast: Bears eye new lows below 1.2250

GBP/USD weekly technical forecastGBP/USD Weekly Forecast: Surprised US NFP Threatens Pound
GBP/USD daily chart

On the technical side, the GBP/USD price has punctured the 1.2250 support level to make a new swing low in the downtrend. The price trades well below the 22-SMA, showing bears are holding the reigns. Meanwhile, the RSI has entered the oversold region, suggesting solid bearish momentum.

-Are you looking for automated trading? Check our detailed guide-

GBP/USD has maintained a solid downtrend since the price broke below the 22-SMA. In all this time, the RSI has stayed in bearish territory but has failed to dip into the oversold region. This shows that bears still have more room to push the prices lower. Therefore, the break below the 1.2250 support will allow the price to reach lower support levels. 

Moreover, the trend will only reverse if the RSI shows fading momentum and the price breaks above the 22-SMA.

Looking to trade forex now? Invest at eToro!

67% of retail investor accounts lose money when trading CFDs with this provider. You should consider whether you can afford to take the high risk of losing your money.

Source link

10 01, 2025

Pound Sterling sellers retain control ahead of key inflation test

By |2025-01-10T21:00:45+02:00January 10, 2025|Forex News, News|0 Comments

  • The Pound Sterling returns to the red against the US Dollar, hitting 14-month lows.
  • GBP/USD licks wounds heading into the UK/US inflation showdown.
  • Pound Sterling remains vulnerable below the key 21-day SMA at 1.2530.

The Pound Sterling (GBP) resumed its bearish momentum against the US Dollar (USD), pushing GBP/USD to the lowest level in 14 months below 1.2200.

Pound Sterling kept falling

Nothing could stop Pound Sterling sellers as the GBP/USD pair faced a double whammy in the first full week of 2025. The week began on an upbeat note as risk appetite returned on China’s stimulus optimism and strong Caixin Services PMI data. The People’s Bank of China (PBOC) pledged over the weekend that it will step up financial support for technology innovation and consumption stimulation as part of a continued effort to boost economic growth, per Bloomberg. 

Positive risk sentiment weighed on the safe-haven USD, while helping the higher-yielding British Pound extend its previous week’s late rebound. However, the tide turned against the pair as inflation fears resurfaced on increased concerns over the potential impact of US President-elect Donald Trump’s immigration and trade policies, reviving the safe-haven demand for the US Dollar.  

Expectations of fewer interest rate cuts by the US Federal Reserve (Fed) this year, fanned by encouraging US Job Openings and Labor Turnover Survey and ISM Manufacturing and Services PMI data, drove US Treasury bond yields higher across the curve, adding to the upside in the Greenback.

The decline in the GBP/USD pair gathered traction midweek after the Pound Sterling came under intense pressure due to a sharp sell-off in the British government bond market, fuelled by investors’ anxiety about UK assets and the economic outlook.

The bond market rout extended on Thursday, with the yield on benchmark 10-year UK Gilts rising by as much as 0.12 percentage points to 4.921%, the highest since 2008. This smashed the pair to its lowest level since November 2023 at 1.2239 before it recovered some ground to near 1.2300.

GBP/USD licked its wound near multi-month troughs heading into Friday’s US Nonfarm Payrolls (NFP) data release. Investors remained wary of the sell-off in the global bond market and growing Chinese economic worries.

In the American session on Friday, the USD gathered strength against its rivals after the December jobs report showed that NFP rose by 256,000, beating the market expectation of 160,000 by a wide margin. Additionally, the Unemployment Rate edged lower to 4.1%, while the Labor Force Participation Rate remained unchanged at 62.5%. Pressured by the USD rally, GBP/USD declined sharply with the immediate reaction and declined below 1.2200.

Inflation data remain the central focus

After a week dominated by US economic events, attention also turns to the UK macro data amid a quiet start to a busy week.

The early part of the week lacks any top-tier UK data releases but the Producer Price Index (PPI) data from the US will grab some eyeballs on Tuesday.

The high-impact Consumer Price Index (CPI) inflation data from both sides of the Atlantic will stand out on Wednesday.

The UK monthly Gross Domestic Product (GDP) report and Industrial Production will be published on Thursday ahead of the US Retail Sales and Jobless Claims data.

Friday will feature the Chinese fourth-quarter GDP and December activity data, which could significantly impact risk sentiment and higher-yielding assets such as the British Pound.

The UK Retail Sales and the mid-tier US housing data will be published on the same day.

Apart from the data publication and speeches from Fed policymakers, Trump’s policy speculations and geopolitical developments will also emerge as potential market drivers.

GBP/USD: Technical Outlook

GBP/USD confirmed a downside break from the six-week-long falling wedge formation after closing Thursday below the lower boundary of the wedge at 1.2330.

The 14-day Relative Strength Index (RSI) languishes in negative territory near 30, indicating more scope for the downside.

Further, the 50-day Simple Moving Average (SMA) and the 200-day SMA Death Cross, confirmed last month, remains in play and acts as a headwind to the pair.

If sellers flex their muscles and keep the pair below the previous 14-month low of 1.2239, the next downside target is November 10 2023 low of 1.2187.

Further south, the 1.2100 demand area could offer some respite to buyers. If that support caves in, the 1.2050 psychological level will be tested.

Conversely, any recovery will need acceptance above 1.2511 to sustain. That level is the confluence of the 21-day SMA and the upper boundary of the wedge.

The pair will then challenge the 50-day SMA at 1.2639 toward the 200-day SMA at 1.2803.

Source link

10 01, 2025

Finds Buyers on Dips (Video)

By |2025-01-10T18:58:20+02:00January 10, 2025|Forex News, News|0 Comments

  • US dollar finds buyers on dips against the Japanese yen.
  • The US dollar plunged early during the trading session on Thursday but has turned around to show signs of life as it looks like the 158 yen level is going to continue to attract some buying pressure.
  • In general, this is a market that has been very bullish for a while, and should continue to be, mainly due to the interest rate differential between the two economies with the United States seeing interest rates rise and Japan still being almost nothing.

So, it makes sense as you will see traders hang on and get paid at the end of every day just to simply hold on to this USD/JPY pair. Furthermore, with the jobs number coming out on Friday, that could add more fuel to the fire, mainly due to the idea that perhaps the job market in America is still rather strong and if that’s the case then inflation is going nowhere and then by extension the federal reserve isn’t going to be cutting anytime soon. With this being said I think you’ve got a situation where people will continue to see a lot of noisy behavior but even if we were to pull back on Friday it would take something pretty drastic for me to believe that the uptrend is over. I think it would just be a simple hiccup along the way, and you could pick up cheap US dollars in that environment.

The 158 Yen Level

The 158 yen level has been important, but I think there’s also the 156 yen level as a floor and then again, the 155 yen level. Both of these could be areas where buyers come in. If the US dollar breaks out and clears the 159 yen level than 160 yen followed by 162 yen will be targeted. There really isn’t much the Bank of Japan can do other than try to bluff the market, which only works so long. So, I remain bullish of this market.

Want to trade USD/JPY forex analysis and predictions? Here’s a list of forex brokers in Japan to check out. 

Source link

10 01, 2025

Pound Sterling stabilizes but remains fragile

By |2025-01-10T14:56:34+02:00January 10, 2025|Forex News, News|0 Comments

  • GBP/USD fluctuates near 1.2300 in the European morning on Friday.
  • The 10-year UK gilt yield stays above 4.8%.
  • December labor market data from the US will be watched closely by market participants.

After dipping to its weakest level since November 2023 below 1.2250 in the European session on Thursday, GBP/USD erased a portion of its losses in the second half of the day. The pair trades in a narrow channel at around 1.2300 on Friday as investors keep a close eye on the action in the UK gilt markets while waiting for December labor market data from the US.

British Pound PRICE This week

The table below shows the percentage change of British Pound (GBP) against listed major currencies this week. British Pound was the weakest against the Canadian Dollar.

  USD EUR GBP JPY CAD AUD NZD CHF
USD   0.07% 1.12% 0.44% -0.28% 0.50% 0.63% 0.32%
EUR -0.07%   1.04% 0.33% -0.29% 0.48% 0.60% 0.29%
GBP -1.12% -1.04%   -0.70% -1.31% -0.56% -0.43% -0.75%
JPY -0.44% -0.33% 0.70%   -0.68% 0.11% 0.26% 0.13%
CAD 0.28% 0.29% 1.31% 0.68%   0.71% 0.86% 0.57%
AUD -0.50% -0.48% 0.56% -0.11% -0.71%   0.12% -0.19%
NZD -0.63% -0.60% 0.43% -0.26% -0.86% -0.12%   -0.31%
CHF -0.32% -0.29% 0.75% -0.13% -0.57% 0.19% 0.31%  

The heat map shows percentage changes of major currencies against each other. The base currency is picked from the left column, while the quote currency is picked from the top row. For example, if you pick the British Pound from the left column and move along the horizontal line to the US Dollar, the percentage change displayed in the box will represent GBP (base)/USD (quote).

The selloff in the UK gilts continued early Thursday, causing Pound Sterling to weaken against its major rivals. In the European morning on Friday, the yield on the 10-year UK gilt stays in positive territory at around 4.85%. Another leg higher in this yield could trigger a new bout of selloff in GBP. On the other hand, a downward correction could help GBP/USD hold its ground.

The US Bureau of Labor Statistics will publish the December employment data in the early American session on Friday. The market expectation is for Nonfarm Payrolls to rise by 160,000 following the 227,000 increase reported in November. In the same period, the Unemployment Rate is seen holding steady at 4.2%.

A positive surprise in NFP, with a reading above 200,000, could help the USD gather strength and force GBP/USD to stay on the back foot heading into the weekend. On the flip side, the USD could come under pressure if the NFP arrives below 150,000. In this scenario, GBP/USD could stage a rebound later in the American session. Investors, however, could refrain from betting on a steady recovery until the UK gilt market settles down.

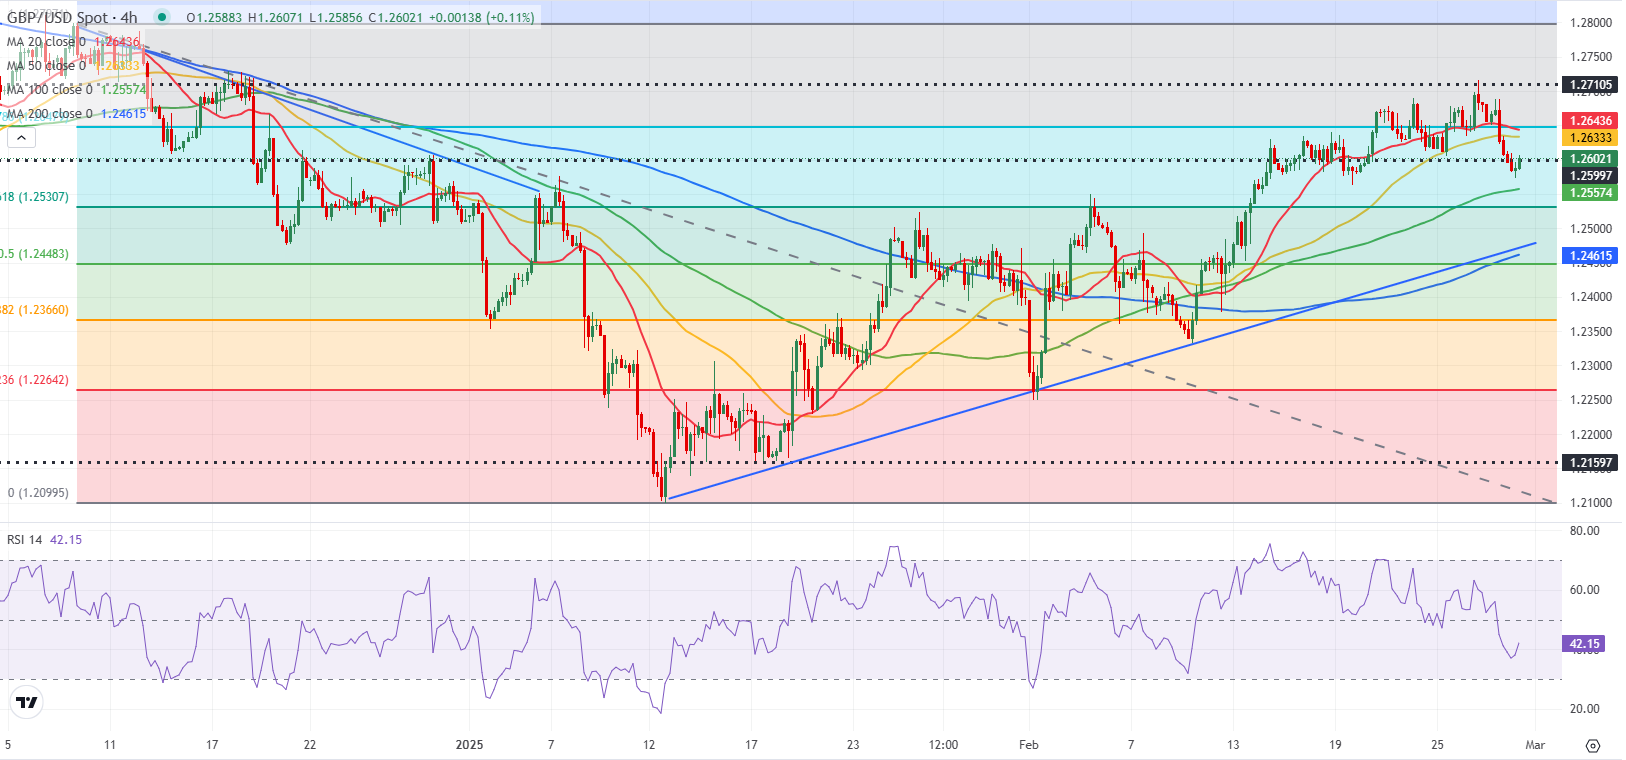
GBP/USD Technical Analysis

The Relative Strength Index (RSI) indicator on the 4-hour chart stays well below 40 and GBP/USD remains in the lower half of the one-month-old descending regression channel, highlighting the bearish bias.

On the downside, first support is located at 1.2250 (lower limit of the descending channel) before 1.2200 (static level, round level) and 1.2140 (static level from November 2023).  Looking north, first resistance could be spotted at 1.2360 (mid-point of the descending channel) ahead of 1.2400 (round level, static level) and 1.2440 (50-period Simple Moving Average).

UK gilt yields FAQs

UK Gilt Yields measure the annual return an investor can expect from holding UK government bonds, or Gilts. Like other bonds, Gilts pay interest to holders at regular intervals, the ‘coupon’, followed by the full value of the bond at maturity. The coupon is fixed but the Yield varies as it takes into account changes in the bond’s price. For example, a Gilt worth 100 Pounds Sterling might have a coupon of 5.0%. If the Gilt’s price were to fall to 98 Pounds, the coupon would still be 5.0%, but the Gilt Yield would rise to 5.102% to reflect the decline in price.

Many factors influence Gilt yields, but the main ones are interest rates, the strength of the British economy, the liquidity of the bond market and the value of the Pound Sterling. Rising inflation will generally weaken Gilt prices and lead to higher Gilt yields because Gilts are long-term investments susceptible to inflation, which erodes their value. Higher interest rates impact existing Gilt yields because newly-issued Gilts will carry a higher, more attractive coupon. Liquidity can be a risk when there is a lack of buyers or sellers due to panic or preference for riskier assets.

Probably the most important factor influencing the level of Gilt yields is interest rates. These are set by the Bank of England (BoE) to ensure price stability. Higher interest rates will raise yields and lower the price of Gilts because new Gilts issued will bear a higher, more attractive coupon, reducing demand for older Gilts, which will see a corresponding decline in price.

Inflation is a key factor affecting Gilt yields as it impacts the value of the principal received by the holder at the end of the term, as well as the relative value of the repayments. Higher inflation deteriorates the value of Gilts over time, reflected in a higher yield (lower price). The opposite is true of lower inflation. In rare cases of deflation, a Gilt may rise in price – represented by a negative yield.

Foreign holders of Gilts are exposed to exchange-rate risk since Gilts are denominated in Pound Sterling. If the currency strengthens investors will realize a higher return and vice versa if it weakens. In addition, Gilt yields are highly correlated to the Pound Sterling. This is because yields are a reflection of interest rates and interest rate expectations, a key driver of Pound Sterling. Higher interest rates, raise the coupon on newly-issued Gilts, attracting more global investors. Since they are priced in Pounds, this increases demand for Pound Sterling.


Source link

Go to Top