The main tag of Forex News Today Articles.
You can use the search box below to find what you need.
[wd_asp id=1]

11 12, 2024

US CPI in focus as cable hits resistance

By |2024-12-11T15:58:01+02:00December 11, 2024|Forex News, News|0 Comments

The GBP/USD has started to ease back as the dollar continues to make gains against other major currencies. The AUD/USD for example hit a 13-month low overnight, with a dovish RBA and concerns about Chinese demand weighing on the Aussie. Elsewhere, the EUR/USD is again testing waters around the 1.05 level amid speculation that the dollar will retain its yield advantage over the euro and other currencies once Trump’s expected spending spree and tax cuts are delivered next year. In contrast, the GBP/USD has only just started to turn lower again after staging a decent 2.5-week recovery from around 1.25 handle. Showcasing the GBP strength is the struggling EUR/GBP. With the latter testing the 0.82 support area, sterling is therefore trading at its best levels since March 2022 against the euro. But against the dollar, it has been held back. In fact, I reckon there is a good chance we may see the GBP/USD start to head lower again and may even go on to break 1.2500 support, once UK’s services inflation eases more significantly – possibly in early next year. If seen, that would allow the BoE to turn more dovish. So, the GBP/USD outlook remains bearish heading into 2025.


GBP/USD forecast: All eyes on US CPI


It’s been a quiet week on the European data front, with investors firmly focused on two key events: today’s US CPI release, due shortly at 13:300 GMT, and tomorrow’s ECB decision.


US CPI is expected to edge up to 2.7% year-over-year from 2.6%, serving as the final major data release before the Federal Reserve meets next week. While the Fed seems to have shifted its focus away from inflation, any upside surprise to the already elevated consensus forecast of 0.3% month-on-month for core inflation could boost the dollar.


While the December rate decision likely won’t hinge on this CPI print, an unexpectedly hot number could shape the Fed’s stance for early 2025. Following Friday’s softer-than-expected NFP report, markets are now almost fully pricing in a 25bps December rate cut, up from 70% last week. So far, this hasn’t significantly impacted the GBP/USD direction, but it has kept the upside limited, suggesting investors continue to prefer the dollar because of Trump’s forthcoming policies in 2025 expected to boost spending and cut taxes, thus keeping inflation risks alive.


Pound gaining strength against the euro


Compared to the euro, the pound has had the benefit of a more functioning government and a touch of fiscal stimulus. In contrast, the political gridlock currently gripping parts of continental Europe is a major reason why the euro is struggling. As a result, UK growth prospects for next year look a little brighter than the eurozone’s, although this doesn’t necessarily mean the GBP/USD will rise. Indeed, a potential shift in the BoE’s tone in February, as services inflation cools further, could pose a risk to the pound against all major currencies.


Technical GBP/USD forecast: Key levels to watch


GBP/USD forecast

Source: TradingView.com


From a purely technical point of view, the GBP/USD forecast is turning a little bearish again but with the CPI release due, u would probably wait until the data is out of the way before acting my views when it comes to trading the cable.


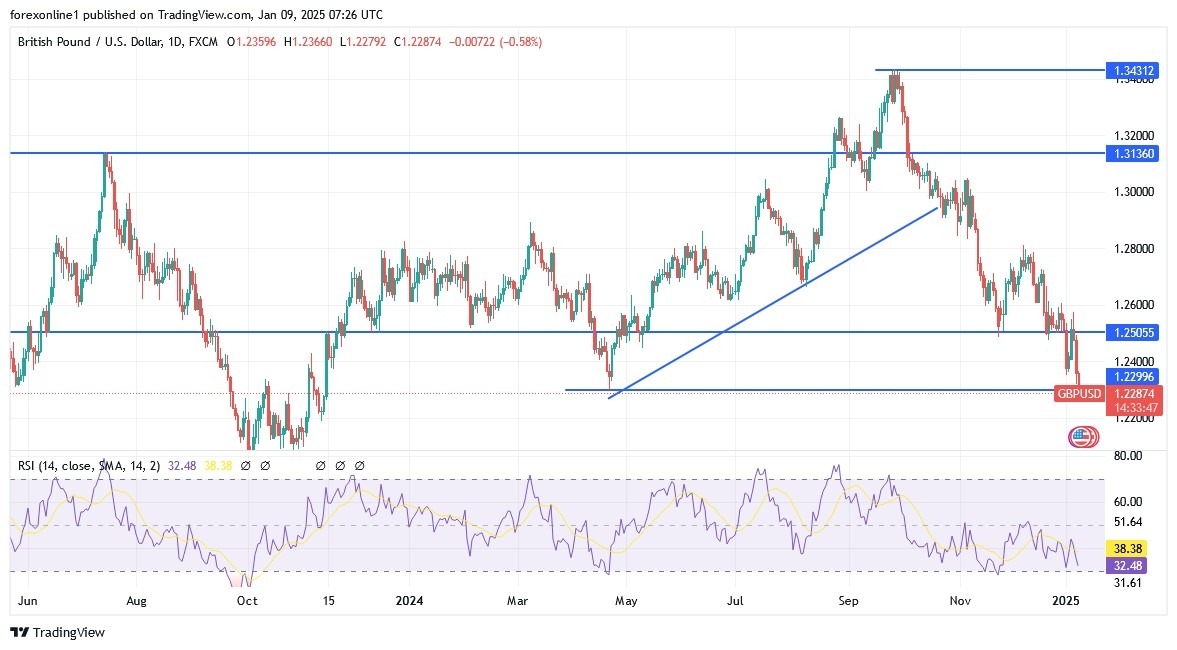
Anyway, key short-term support is at around 1.2715 area; if we break below here today decisively then this could pave the way for a drop to retest the bullish trend line (that has been re-established after a brief break) around 1.2600-1.26200 area. Below that level, we have the psychologically important 1.25 handle, which is basically where the cable last found support from after a brief breakdown to hit 1.2487 at its lowest point in November.


In term of resistance, the next level to watch in the event price continues to push higher is between the 1.2800 to 1.12870 range. Here, the cable had found both support and resistance in the past and is where the 200-day average also comes into play.


— Written by Fawad Razaqzada, Market Analyst

Follow Fawad on Twitter @Trader_F_R


Source link

11 12, 2024

USD/JPY, Oil Forecast: Two trades to watch

By |2024-12-11T13:57:24+02:00December 11, 2024|Forex News, News|0 Comments

USD/JPY tests the 200 SMA ahead of US CPI

  • US CPI is expected to rise 2.7% YoY
  • Japanese wholesale inflation rose to 3.7%
  • USD/JPY tests 200 SMA resistance

USD/JPY is rising for a third day as Japanese wholesale inflation accelerates ahead of US CPI.

The USD is  rising against its major peers ahead of the highly anticipated US CPI reading, which could provide further insight into the Federal Reserve’s outlook for rate cuts.

Expectations are for CPI to rise to 2.7% YoY up from 2.6%. On a monthly basis CPI is expected to rise 0.2% Meanwhile core inflation is expected to hold steady at 3.3%.

A hotter-than-expected inflation could see the market rein in rate cut expectations for next year. The market is pricing in an 86% probability of a 25 basis point rate cut in December, and are looking at around one rate cut per quarter in 2025.

Japanese corporate goods price index (CGPI), which measures the price companies charge for goods and services, increased 3.7% in November ahead of forecasts of 3.4%, marking the quickest pace no price increase since July 2023

The acceleration in wholesale inflation lifted expectations of a 25 basis point rate hike from the Bank of Japan on December 19 to 27%.

USD/JPY Forecast- technical analysis

USD/JPY has recovered from the 100 SMA support, rising back above 150 and is testing the 200 SMA resistance at 152.00.

Buyers will look to break above this level to test 153.85 the 61.8% Fib retracement of the 162 high and 139.50 low. Above here, 157.10, the 78.6% Fib level comes into play.

Failure to rise above the 200 SMA could see sellers test 150.00, the psychological level, ahead of 148.65, the December low, and the 100 SMA.

usd/jpy forecast chart

Oil rises for a third day on China optimism & ahead of the OPEC report

  • A looser monetary policy stance in 2025 lifts the demand outlook
  • OPEC’s monthly report to provide supply & demand clues
  • Oil trades in a familiar holding pattern.

Oil prices are heading higher for a third straight day, supported by optimism surrounding monetary policy change in China.

On Monday, Chinese authorities signaled they would adopt a looser monetary policy stance in 2025 to support the ailing economy.

The prospect of improved growth in China is helping to brighten the outlook for oil demand. In November, China imports rose for the first time in seven months, up 14% year over year.

Still, any changes to the Chinese monetary policy stance would be unlikely to do much in the case of further trade tariffs brought in by Trump.

Attention is now towards the OPEC monthly report, which could provide further insight into the supply and demand outlook. In previous reports group has highlighted increasing supply from outside of OPEC, possible supply surplus next year.

Separately, API oil inventory data shows that oil inventories rose 499k in the week ending Dec 6. Gasoline inventories rise by 2.85 million barrels. Expectations had been for a 900k increase in oil inventories and 1.7 million in gasoline.

Oil Forecast – technical analysis

Oil continues to consolidate in a familiar range, capped on the downside by 67.50 – 67 zone and o the upside by 71.50-72.50.

The longer-term trend is downward, with oil trading below its falling trendline dating back to September 2023 and its 200, 100, and 50 SMAs.

Sellers will look to take out the 67.50 support zone to test 65.25, the 2024 low, and 63.50, the 2023 low.

Buyers will need to rise above the 50 SMA at 70.50 to extend gains towards 71.50-72.50 zone – above here 75.00 comes into play.

oil FORECAST CHART

Source link

11 12, 2024

Euro retreats below key support ahead of US inflation report

By |2024-12-11T11:55:52+02:00December 11, 2024|Forex News, News|0 Comments

  • EUR/USD trades in the red near 1.0500 in the European morning on Wednesday.
  • The near-term technical outlook points to a bearish tilt.
  • November Consumer Price Index data from the US will be watched closely.

EUR/USD closed in negative territory on Tuesday and continued push lower toward the 1.0500 area early Wednesday, pressured by the renewed US Dollar (USD) strength. As market focus shifts to November Consumer Price Index (CPI) data from the US, the pair’s technical outlook points to a bearish tilt in the near term.

Euro PRICE This week

The table below shows the percentage change of Euro (EUR) against listed major currencies this week. Euro was the weakest against the US Dollar.

  USD EUR GBP JPY CAD AUD NZD CHF
USD   0.72% 0.04% 1.14% 0.23% 0.59% 1.22% 0.75%
EUR -0.72%   -0.66% 0.54% -0.41% -0.04% 0.58% 0.11%
GBP -0.04% 0.66%   1.04% 0.26% 0.62% 1.25% 0.78%
JPY -1.14% -0.54% -1.04%   -0.95% -0.48% -0.06% -0.32%
CAD -0.23% 0.41% -0.26% 0.95%   0.40% 0.99% 0.52%
AUD -0.59% 0.04% -0.62% 0.48% -0.40%   0.62% 0.15%
NZD -1.22% -0.58% -1.25% 0.06% -0.99% -0.62%   -0.48%
CHF -0.75% -0.11% -0.78% 0.32% -0.52% -0.15% 0.48%  

The heat map shows percentage changes of major currencies against each other. The base currency is picked from the left column, while the quote currency is picked from the top row. For example, if you pick the Euro from the left column and move along the horizontal line to the US Dollar, the percentage change displayed in the box will represent EUR (base)/USD (quote).

Rising US Treasury bond yields helped the USD outperform its rivals in the American session on Wednesday. Moreover, the risk-averse market environment allowed the currency hold its ground, causing EUR/USD to stretch lower.

The annual CPI inflation in the US is forecast to rise to 2.7% in November from 2.6% in October. On a monthly basis, the core CPI is expected to rise 0.3%, matching October’s increase. In case the monthly core CPI reading comes in above analysts’ estimate, the immediate reaction could boost the USD and drag EUR/USD lower. On the flip side, a reading of 0.2% lower in this data could have the opposite effect on the pair’s action.

On Thursday, the European Central Bank (ECB) will announce monetary policy decisions. Hence, EUR/USD’s reaction to US inflation data could remain short-lived.

EUR/USD Technical Analysis

EUR/USD dropped below 1.0520, where the 100-period Simple Moving Average (SMA) on the 4-hour chart meets the Fibonacci 23.6% retracement of the latest downtrend. Meanwhile, the Relative Strength Index (RSI) indicator turned south and fell below 40, reflecting a buildup of bearish momentum.

In case EUR/USD confirms 1.0520 as resistance, technical sellers could remain interested. In this scenario, 1.0440 (static level) could be seen as the next support before 1.0400 (end-point of the downtrend).

On the other hand, sellers could be discouraged if EUR/USD manages to reclaim 1.0520 and allow the pair to extend its recovery toward 1.0600 (Fibonacci 38.2% retracement) and 1.0630 (200-period SMA).


Source link

11 12, 2024

GBP Tests 50-Day EMA (Chart)

By |2024-12-11T09:54:13+02:00December 11, 2024|Forex News, News|0 Comments

  • In my daily analysis of the GBP/JPY pair, we have seen a lot of strength coming out of the British pound, or perhaps more to the point, we have seen a lot of weakness coming out of the Japanese yen.
  • The reason I say this is that the JPY has lost strength against multiple currencies not just the British pound itself.
  • That being said, this is a market that I want to lie, because when you get the direction of the GBP/JPY pair correct, you quite often get paid quite nicely.

Technical Analysis

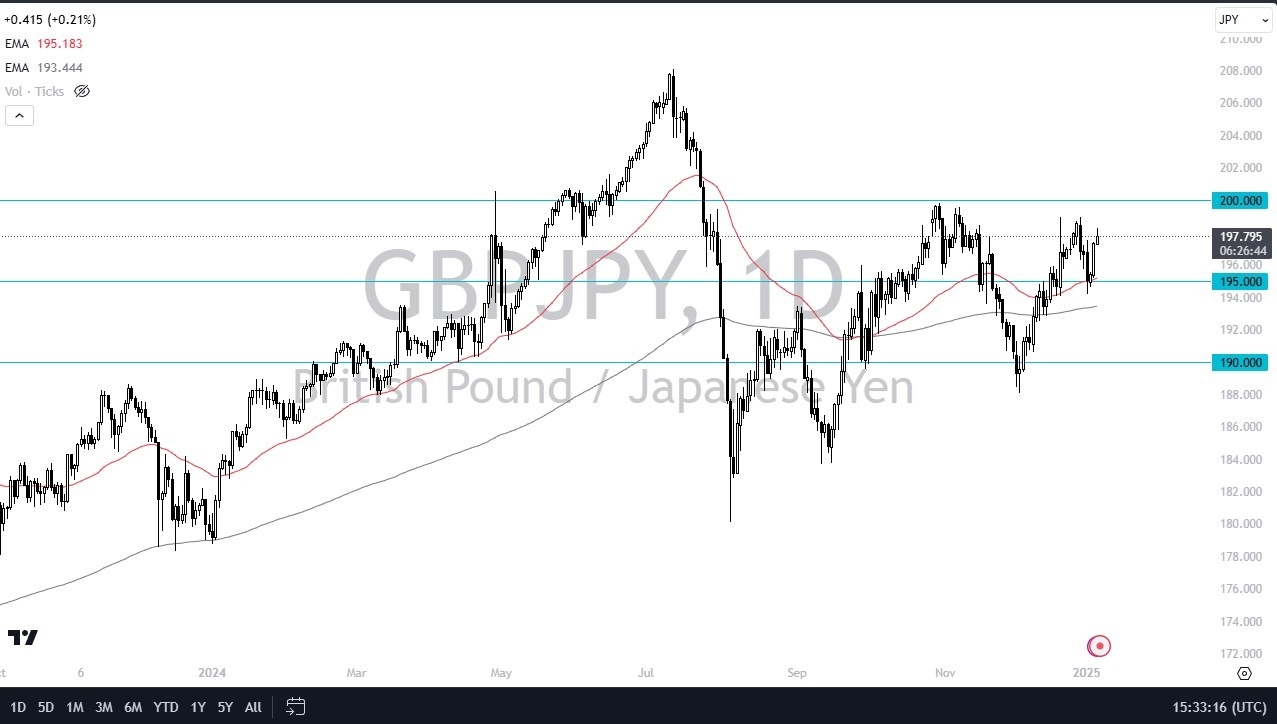
The technical analysis for the GBP/JPY pair is worth noting, as we are hanging around the 50 Day EMA indicator. If we can break above here, that’s yet another reason to think that the British pound will continue to ascend against the Japanese yen, but quite frankly it’s probably more important to keep in the back of your mind that the Japanese yen itself is getting pummeled by just about everything out there. This even includes the lonely Swiss franc!

Now that we are above the 200 Day EMA and we are starting to see the Stochastic Oscillator reach toward the high, I think we are going to see more momentum come into the picture. I think that the consolidation is over with after the massive drop, and it would not surprise me at all to see the British pound goes looking to the ¥200 level. I don’t think this is an easy move, nor do I think it happens overnight. However, in the meantime I think that we have got a situation where most traders are going to be looking for buying opportunities on short-term pullbacks. With this, think you need to be somewhat diligent with your position sizing, building up as you go along. If we were to somehow break above the ¥200 level, again something I’m not expecting to see this week, that opens up the next leg higher.

On the other hand, if we were to turn around a breakdown below the ¥191.50 level, then I think we might be in a little bit of trouble. I would also expect to see that JPY is strengthening almost everything else, something that you did a few weeks ago.

Ready to trade our daily Forex analysis? Here are the best regulated trading platforms UK to choose from. 

Source link

11 12, 2024

Heated Highs Ahead of US CPI

By |2024-12-11T03:51:12+02:00December 11, 2024|Forex News, News|0 Comments

Key Events

  • US CPI: Week’s catalyst for broader market volatility on Wednesday
  • Federal Reserve and BOJ Rate Decisions: Anticipated rate adjustments could shake markets.
  • Holiday Rallies: Potential delays in traditional Christmas rallies until 2025

USDJPY

As detailed in my previous article, USDJPY, Silver Forecast: Bullish Rebounds in Question, several bullish indicators emerged on Friday as USDJPY tested the 148.60 support level. This coincided with positive technical setups and market sentiment leaning towards a BOJ rate hike after the Fed’s expected rate cut in mid-December. Volatility risks remain on the horizon with US inflation data.

US Indices: Are There Any New Highs for 2024?

US indices started the year strong, recording successive highs before capping 2024 with December’s anticipated Santa Claus rally and New Year effect. This aligns with bullish momentum for Trump’s presidency.
Despite these highs, the Dow Jones faces bearish correction pressures from the 45,000 zone, driven by inflationary concerns, geopolitical instability, and profit-taking ahead of the holidays. As markets brace for 2025, the combination of these risks and uncertainties under Trump’s leadership sets the stage for volatility.

Get our exclusive guide to index trading in Q4 2024

Technical Analysis: Quantifying Uncertainty

USDJPY Forecast: Weekly Time Frame – Log Scale

USDJPY Analysis: USDJPY_2024-12-10_12-02-51

Source: Tradingview

USDJPY is still holding a bullish rebound from the key support at 148.60. The bullish indicators supporting the setup are:

  • The 3-day RSI rebounding from the neutral zone and moving average
  • Price action holding above the 20-period SMA following the November drop
  • The 150-mark continuing to serve as psychological support

If the 148.60 low holds firm, the next resistance is at 153.30, aligning with the lower boundary of the long-term trendline connecting consecutive lows from January 2023 to 2024. Longer-term resistance levels include 155, 157 and 160, reflecting significant Yen weakness and potential BOJ intervention risks. From the downside, the next level to watch at 146.80 in the event of further downside. Deeper declines could retest levels 144 and 140.

Dow Analysis: Daily Time Frame – Log Scale

Dow Analysis: US30_2024-12-10_12-17-42

Source: Tradingview

For a longer-term technical analysis of the Dow chart, the details are published in the following article EURUSD, Dow Forecast: On Edge Ahead of Key US Data

On the daily time frame, the Dow is consolidating near the 45,000 level, forming another top amid overbought RSI conditions and negative divergence. The psychological implications of the 45,000 mark and its Fibonacci extension reinforce the significance of this zone.
The 4H RSI reflects a rebound potential, aligning with recorded highs at 44,300 in November.

Upside momentum could resume with a firm close above 45,200, eyeing resistance at 47,000. Conversely, a break below 44,280 could extend retracement towards 43,300, 42,200, and 41,500.

Nasdaq Analysis: 3Day Time Frame – Log Scale

Nasdaq Analysis: NAS100_2024-12-10_12-41-39

Source: Tradingview

As previously mentioned in EURUSD, Nasdaq Forecast: Inflation Data and Holiday Volatility, Nasdaq fell short of the 2,700-mark on Monday following momentum slowdowns in the Dow and S&P ahead of the US CPI and FOMC meeting.
The 4H RSI, displayed on the daily chart, reflects a retest of the neutral zone as the price tests 21,400 support.

Further upside can be confirmed with a close above 21,800, eyeing resistance at 22,800. A break below 21,280 could deepen corrections to 21,140, 20,800, and 20,300, aligning with the bottom border of the primary uptrend since October 2022 lows.

— Written by Razan Hilal, CMT on X:@Rh_waves and Forex.com Youtube

Source link

11 12, 2024

EUR/USD outlook modestly negative ahead of US CPI, ECB

By |2024-12-11T01:50:25+02:00December 11, 2024|Forex News, News|0 Comments

The EUR/USD failed to hold ono its earlier gains on Monday, turning lower into the close. It has fallen further so far in today’s session with the European Central Bank’s rate decision and key US inflation data on the horizon. These events come just ahead of the Federal Reserve’s own rate decision, setting the stage for a pivotal couple of weeks. We think that the EUR/USD outlook leans modestly bearish, especially after Monday’s market optimism—fuelled by potential stimulus in China—provided a short-lived relief for risk assets.   


China’s export growth slows sharply, imports see steep decline


After announcing plans to adopt a “moderately loose” policy next year, fulling a rally in the likes of the AUD and China-linked stocks, it was China again which caused these moves to unwind. This time, it was data reminding everyone how weak the world’s second largest economy has become, and the need for the government to unleash monetary and fiscal support, just as concerns rise over potential trade tariffs from incoming US President Trump.


China’s latest trade figures reveal a sharp slowdown in export growth, rising 6.7% year-on-year to $312.3 billion. This marks a significant drop from October’s 12.7% expansion and falls short of the 8.5% growth forecast.  On the import front, the picture is even more concerning. Imports contracted by 3.9%, the steepest decline since September 2023, defying expectations of a modest 0.3% increase.


These figures suggest weakening global demand for Chinese goods, as businesses reduce reliance on China amid concerns over potential trade tariffs from Trump. Domestically, sluggish import activity points to softer demand despite recent economic stimulus efforts.  The data is bad news for Eurozone exports to China, and therefore another negative influence for the euro, even if the country has signalled more stimulus measures are on the way. On that front, investors will now focus on the Central Economic Work Conference, starting Wednesday, for more details on China’s fiscal strategies. 


US inflation data to take centre stage from mid-week


Ahead of the ECB’s rate decision, US inflation data will dominate midweek, with CPI due Wednesday and PPI on Thursday. CPI is expected to edge up to 2.7% year-over-year from 2.6%, serving as the final major data release before the Federal Reserve meets.


While the December rate decision likely won’t hinge on this CPI print, an unexpectedly hot number could shape the Fed’s stance for early 2025. Following Friday’s softer-than-expected NFP report, markets are now pricing in an 87% chance of a December rate cut, up from 70% last week. So far, this hasn’t significantly swayed the EUR/USD direction, but it has kept the upside limited, suggesting investors continue to prefer the dollar because of Trump’s forthcoming policies in 2025 expected to boost spending and cut taxes, thus keeping inflation risks alive. Against this backdrop, we maintain a bearish EUR/USD outlook.


ECB set to cut rates by 25 basis points


The next focal area of the EUR/USD traders will be the European Central Bank’s rate decision on Thursday. Analysts anticipate the ECB will implement a standard 25-basis-point rate cut at this meeting, bringing the deposit rate down to 3.15% from 3.40%. While there were whispers of a larger 50-bps cut, a more gradual approach seems likely, leaving the door open for additional rate reductions in 2025.


Monday’s release of Sentix Investor Confidence data could strengthen the case for more dovish policies. Beyond economic indicators, political uncertainty is also weighing on growth prospects, as budget talks in Berlin and Paris recently collapsed. If the ECB is more dovish than markets anticipate, the EUR/USD outlook could become even more bearish. 


Technical EUR/USD outlook: Key levels to watch

EUR/USD outlook

Source: TradingView.com


As per the 4-hour chart, price action continues to look heavy for the EUR/USD. The pair has repeatedly tested the 1.06 resistance zone (1.0595–1.0610) without securing a decisive break above it. A break above this range could trigger a short-squeeze rally toward 1.0700, with further targets around 1.0775/80. For now, however, the bulls remain on standby without a clear reversal signal. 


In fact, the downside risks are still greater and if the bullish trend line breaks, then that could put the bulls in a spot of bother. One particular area to watch is the 1.0500 support zone, which remains critical. A break below there could resume the bearish trend that began in September. For me the trigger is at 1.0472, which was the last low made prior to the most recent up move. A potential break below it could target the liquidity around 1.0333, the November low, followed by psychological levels like 1.0300 and 1.0200, potentially revisiting parity. 


In short…


The EUR/USD outlook stays modestly bearish, with selling pressure likely to return unless the ECB delivers a surprisingly hawkish message or US CPI figures are significantly softer than expected – unlikely on both fronts.


— Written by Fawad Razaqzada, Market Analyst

Follow Fawad on Twitter @Trader_F_R


Source link

10 12, 2024

USD/JPY Recovery at Trend Resistance

By |2024-12-10T23:49:36+02:00December 10, 2024|Forex News, News|0 Comments

Japanese Yen Technical Forecast: USD/JPY Daily / 240min Trade Levels

  • USD/JPY rebounds off key support into December- Monthly opening-range taking shape
  • USD/JPY rally now testing confluent downtrend resistance- risk for exhaustion / price inflection ahead
  • Resistance 151.74/99 (key), 153.02/40, 154.34- Support 148.73-149.60 (key), 146.14/65, 144.17/63

The US Dollar is up more than 2.1% off the monthly low against the Japanese Yen with USD/JPY rebounding off key testing support into the December open. The recovery has now extended into technical resistance at the November downtrend with major US inflation data on tap tomorrow. Battle lines drawn on the USD/JPY short-term technical charts.

Review my latest Weekly Strategy Webinar for an in-depth breakdown of this Yen setup and more. Join live on Monday’s at 8:30am EST.

Japanese Yen Price Chart – USD/JPY Daily

Chart Prepared by Michael Boutros, Sr. Technical Strategist; USD/JPY on TradingView

Technical Outlook: In last month’s Japanese Yen Technical Forecast we noted that USD/JPY was testing the median-line support and that, “the immediate focus is on a breakout of the weekly opening-range for guidance with the near-term threat lower while below 155.” Price broke lower the following week with USD/JPY plunging nearly 5.2% off the November high.

The decline rebounded off confluent support last week at the 2022 weekly high-close / 2023 high-week close (HWC) at 148.73-149.60. The immediate focus is on this recovery with the bulls testing confluent resistance today at 151.74/99– a region defined by the 38.2% retracement of the November decline, the 2022/2023 highs and the 200-day moving average. Looking for a possible reaction off this mark over the next few days.

Japanese Yen Price Chart – USD/JPY 240min

Japanese Yen Price ChartUSDJPY 240minUS Dollar v Yen Trade OutlookUSD JPY Technical Forecast12102024

Chart Prepared by Michael Boutros, Sr. Technical Strategist; USD/JPY on TradingView

A closer look at Japanese Yen price action shows USD/JPY trading within the confines of a descending pitchfork extending off the November highs with the upper parallel further highlighting resistance here at 151.74/99. A topside breach would expose the May low-day close (LDC) / 61.8% retracement at 153.02/40 backed by the November high-day reversal close at 154.34– a breach / close above this threshold would be needed to suggest a more significant low was registered last week / a larger trend reversal is underway.

A break below this key support zone would threaten resumption of the November downtrend towards the median-line (currently ~148), with subsequent objectives seen at 146.13/65 and the August low-day close (LDC) / January low-week close (LWC) at 144.17/63– both levels of interest for possible exhaustion / price inflection IF reached.

Get our exclusive guide to USD/JPY trading in Q4 2024

Bottom line: USD/JPY is rebounding off technical support into the start of the month with the advance now testing the first major resistance hurdle- looking for possible inflection here. From a trading standpoint, the focus is on a breakout of the weekly opening range (149.60-151.99) for guidance with the near-term recovery vulnerable while below the 200-day moving average.

Keep in mind we get the release of key US inflation data tomorrow with the November Consumer Price Index (CPI) on tap. Stay nimble into the release and watch the weekly close here for guidance. Review my latest Japanese Yen Weekly Forecast for a closer look at the longer-term USD/JPY technical trade levels.

USD/JPY Key Economic Data Releases

 US Japan Economic Calendar- USDJPY Key Data Releases- USDJPY Outlook 12-10-2024

Economic Calendar – latest economic developments and upcoming event risk.

Active Short-term Technical Charts

— Written by Michael Boutros, Sr Technical Strategist

Follow Michael on X @MBForex


Source link

10 12, 2024

Currency Pair of the Week – December 9, 2024

By |2024-12-10T21:48:09+02:00December 10, 2024|Forex News, News|0 Comments

The EUR/USD is our featured currency pair this week, owing to the fact we have the European Central Bank’s key rate decision and important inflation data from the US coming in a week before the Federal Reserve’s own decision on interest rates. Ahead of these macro events, the EUR/USD forecast remains modestly bearish, although the currency pair has found some love today thanks to optimism about more stimulus measures being introduced in China, one of the Eurozone’s major exports destinations.


What is driving the markets today?


China’s government announced they will embrace a “moderately loose” strategy next year, in a sign of greater easing ahead that has been hailed by investors hungry for more stimulus today. The news caused Chinese equities and nearly all Chinese-linked assets rally, from copper to commodity stocks in the FTSE. The euro also found some mild support on the view that a stimulus-driven recovery in China will help support eurozone exports into that region. But most of the gains were evidenced in currencies that have even closer trade ties with China, such as the AUD. All eyes are now on the Central Economic Work Conference due to start on Wednesday, for signals of more fiscal support from China.


How big of a cut should we expect from the ECB?


Well, analysts are expecting a standard 25 basis point rate cut at Thursday’s meeting of the Governing Council of the European Central Bank. There were talks of perhaps 50 basis points, which may still be under consideration. However, the ECB is more likely, in our view, to deliver a 25bp cut to take the deposit rate down to 3.15% from the current 3.40% and use the press conference to open the door to several further rate cuts in 2025. Today’s release of the latest Sentix Investor Confidence reading will certainly make the ECB’s doves more vocal. It is not just data that calls for looser policy: Governments in Paris and Berlin both collapsed over budget talks recently and this uncertainty is likely to weigh on growth further. The EUR/USD forecast could turn more bearish if the ECB turns out to be even more dovish than the market is expecting them to be right now.


EUR/USD forecast: CPI is this week’s key US data


US inflation data will be released this week, with CPI coming on Wednesday and PPI a day later. CPI is expected to rise to 2.7% y/y from 2.6% y/y previously. This will be the last set of key data before the Federal Reserve meets next week. Following Trump’s victory in the presidential election race, investors have sharply reduced their expectations about further US interest rate cuts in 2025. The upcoming December rate decision is unlikely to be impacted by this CPI report, unless we see a super-hot print. But whether the Fed will go ahead with a cut at its initial 2025 meetings will be influenced, among other key data highlights, by this CPI report, although it is employment that the Fed is now more focused on.


But after Friday’s somewhat of a softish NFP report, a 25-bps rate cut is now more likely than not. Indeed, market pricing of a December rate cut has risen to around 87% from 70% last week, although this has not yet had any further influence on the EUR/USD’s direction.


Technical EUR/USD forecast: Key levels to watch


EUR/USD forecast

Source: TradingView.com


The EUR/USD has now had a few attempts to break above the 1.06 resistance area (i.e., the 1.0595-1.0610 range). So far, it has failed to post a daily close above this range to tip the balance in the bulls’ favour. But will that change as we head deeper into the week remains to be seen. For now, at least, the bulls will need to remain patient as we don’t have a concrete reversal signal to work with. A daily close above this resistance area could potentially pave the way for a short-squeeze rally towards the 1.0700 area, possibly 1.0775/80.


But while the 1.06 resistance area holds, the risks remain skewed to the downside. As such a break below the 1.0500 area is still a scenario that looks more likely than a sharp rally. The 1.0500 level is the most important support to watch in so far as the short-term outlook is concerned. A daily close below the 1.0450-1.0500 area could see the EUR/USD resume its bearish trend that started back in September. If that happens, then the next downside target would be the liquidity resting below the recent lows of around 1.0333 area. Thereafter, you have the round handles like 1.0300 and 1.0200 as the subsequent targets en route to potentially parity.


All told, the EUR/USD forecast is modestly bearish, and we could see the selling resume unless US CPI is super soft, or the ECB is not as dovish as markets are expecting.


— Written by Fawad Razaqzada, Market Analyst

Follow Fawad on Twitter @Trader_F_R


Source link

10 12, 2024

Retreats below 1.2750 amid strong US Dollar

By |2024-12-10T19:47:00+02:00December 10, 2024|Forex News, News|0 Comments

  • Cable slides 0.17%, unable to sustain gains against a strengthening US Dollar Index, now at 106.36.
  • GBP/USD’s failure to surpass the 200-day SMA at 1.2820 signals potential for further pullback.
  • Downward pressure increases, with possible support targets at 1.2600 and the November 22 low of 1.2486.

The Pound Sterling tumbled after failing to clear the 1.2800 figure for the third consecutive day, trading at 1.2720, down over 0.17% daily. Cable erased its earlier minuscule gains amid a session characterized by US Dollar strength, with the US Dollar Index (DXY) up over 0.19%, at 106.36.

GBP/USD Price Forecast: Technical outlook

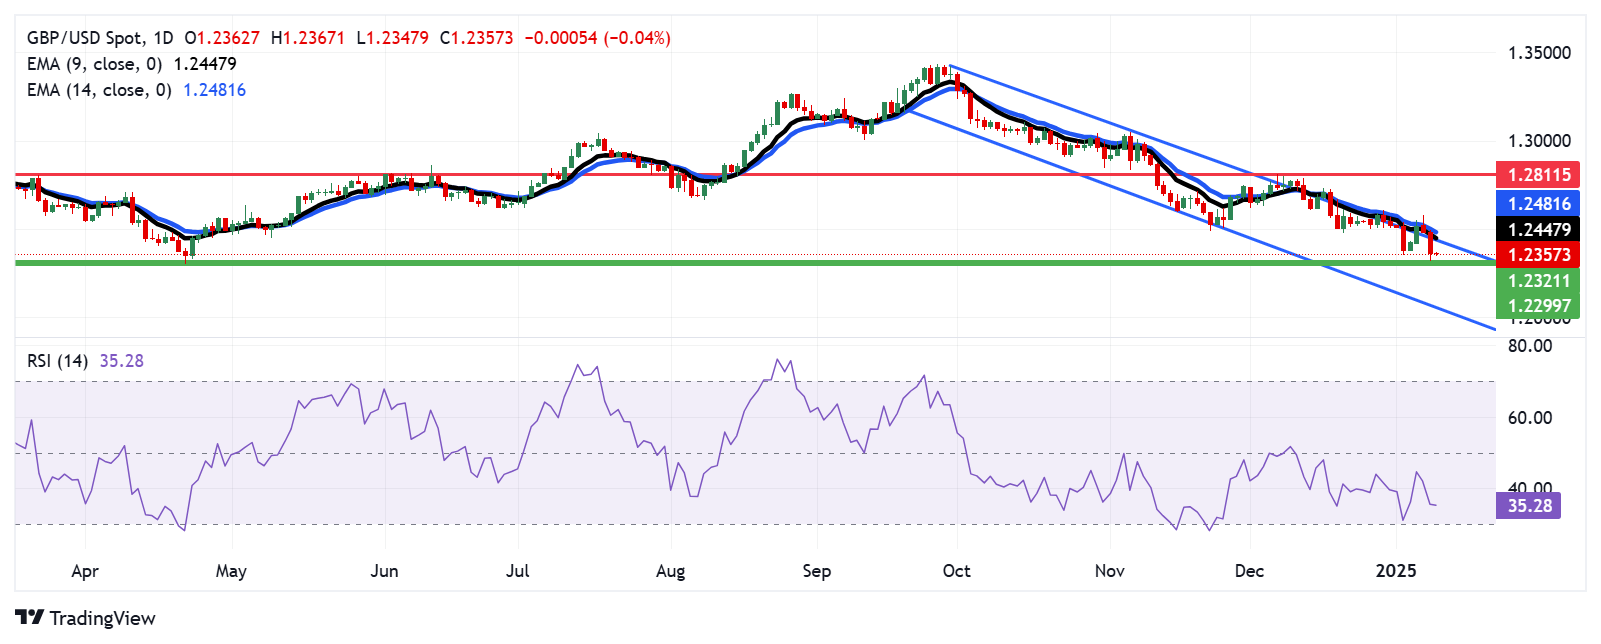
The GBP/USD consolidates as it recovers from falling to multi-month lows at around 1.2480s. On its way north, the pair cleared the 1.2600 figure and November 29 peak of 1.2749 before aiming toward the December 6 high at 1.2811. The failure to extend its gains past the 200-day Simple Moving Average (SMA) of 1.2820 opened the door for a pullback to current spot prices.

On the other hand, sellers are moving in, as shown by the Relative Strength Index (RSI) punching below its neutral line, indicating that they’re gathering steam. If GBP/USD drops below 1.2700, the pair could slide towards 1.2600 before challenging the November 22 swing low of 1.2486.

GBP/USD Price Chart – Daily

British Pound PRICE Today

The table below shows the percentage change of British Pound (GBP) against listed major currencies today. British Pound was the strongest against the New Zealand Dollar.

  USD EUR GBP JPY CAD AUD NZD CHF
USD   0.46% 0.17% 0.55% 0.15% 1.03% 1.15% 0.44%
EUR -0.46%   -0.28% 0.08% -0.32% 0.57% 0.69% -0.01%
GBP -0.17% 0.28%   0.33% -0.03% 0.85% 0.97% 0.27%
JPY -0.55% -0.08% -0.33%   -0.39% 0.50% 0.60% -0.09%
CAD -0.15% 0.32% 0.03% 0.39%   0.89% 1.01% 0.31%
AUD -1.03% -0.57% -0.85% -0.50% -0.89%   0.12% -0.58%
NZD -1.15% -0.69% -0.97% -0.60% -1.01% -0.12%   -0.69%
CHF -0.44% 0.01% -0.27% 0.09% -0.31% 0.58% 0.69%  

The heat map shows percentage changes of major currencies against each other. The base currency is picked from the left column, while the quote currency is picked from the top row. For example, if you pick the British Pound from the left column and move along the horizontal line to the US Dollar, the percentage change displayed in the box will represent GBP (base)/USD (quote).


Source link

10 12, 2024

Heated Highs Ahead of US CPI

By |2024-12-10T17:46:07+02:00December 10, 2024|Forex News, News|0 Comments

Key Events

  • US CPI: Week’s catalyst for broader market volatility on Wednesday
  • Federal Reserve and BOJ Rate Decisions: Anticipated rate adjustments could shake markets.
  • Holiday Rallies: Potential delays in traditional Christmas rallies until 2025

USDJPY

As detailed in my previous article, USDJPY, Silver Forecast: Bullish Rebounds in Question, several bullish indicators emerged on Friday as USDJPY tested the 148.60 support level. This coincided with positive technical setups and market sentiment leaning towards a BOJ rate hike after the Fed’s expected rate cut in mid-December. Volatility risks remain on the horizon with US inflation data.

US Indices: Are There Any New Highs for 2024?

US indices started the year strong, recording successive highs before capping 2024 with December’s anticipated Santa Claus rally and New Year effect. This aligns with bullish momentum for Trump’s presidency.
Despite these highs, the Dow Jones faces bearish correction pressures from the 45,000 zone, driven by inflationary concerns, geopolitical instability, and profit-taking ahead of the holidays. As markets brace for 2025, the combination of these risks and uncertainties under Trump’s leadership sets the stage for volatility.

Get our exclusive guide to index trading in Q4 2024

Technical Analysis: Quantifying Uncertainty

USDJPY Forecast: Weekly Time Frame – Log Scale

USDJPY Analysis: USDJPY_2024-12-10_12-02-51

Source: Tradingview

USDJPY is still holding a bullish rebound from the key support at 148.60. The bullish indicators supporting the setup are:

  • The 3-day RSI rebounding from the neutral zone and moving average
  • Price action holding above the 20-period SMA following the November drop
  • The 150-mark continuing to serve as psychological support

If the 148.60 low holds firm, the next resistance is at 153.30, aligning with the lower boundary of the long-term trendline connecting consecutive lows from January 2023 to 2024. Longer-term resistance levels include 155, 157 and 160, reflecting significant Yen weakness and potential BOJ intervention risks. From the downside, the next level to watch at 146.80 in the event of further downside. Deeper declines could retest levels 144 and 140.

Dow Analysis: Daily Time Frame – Log Scale

Dow Analysis: US30_2024-12-10_12-17-42

Source: Tradingview

For a longer-term technical analysis of the Dow chart, the details are published in the following article EURUSD, Dow Forecast: On Edge Ahead of Key US Data

On the daily time frame, the Dow is consolidating near the 45,000 level, forming another top amid overbought RSI conditions and negative divergence. The psychological implications of the 45,000 mark and its Fibonacci extension reinforce the significance of this zone.
The 4H RSI reflects a rebound potential, aligning with recorded highs at 44,300 in November.

Upside momentum could resume with a firm close above 45,200, eyeing resistance at 47,000. Conversely, a break below 44,280 could extend retracement towards 43,300, 42,200, and 41,500.

Nasdaq Analysis: 3Day Time Frame – Log Scale

Nasdaq Analysis: NAS100_2024-12-10_12-41-39

Source: Tradingview

As previously mentioned in EURUSD, Nasdaq Forecast: Inflation Data and Holiday Volatility, Nasdaq fell short of the 2,700-mark on Monday following momentum slowdowns in the Dow and S&P ahead of the US CPI and FOMC meeting.
The 4H RSI, displayed on the daily chart, reflects a retest of the neutral zone as the price tests 21,400 support.

Further upside can be confirmed with a close above 21,800, eyeing resistance at 22,800. A break below 21,280 could deepen corrections to 21,140, 20,800, and 20,300, aligning with the bottom border of the primary uptrend since October 2022 lows.

— Written by Razan Hilal, CMT on X:@Rh_waves and Forex.com Youtube

Source link

Go to Top