The main tag of Forex News Today Articles.
You can use the search box below to find what you need.
[wd_asp id=1]

17 09, 2024

Rises above 156.00 as bulls face key resistance area

By |2024-09-17T07:00:03+03:00September 17, 2024|Forex News, News|0 Comments

  • EUR/JPY remains in a bearish bias despite recent recovery, with momentum flattening and potential consolidation ahead.
  • A break above 157.00 could target resistance at 157.46 (Tenkan-Sen) and 158.49 (Senkou Span A).
  • For a bearish continuation, EUR/JPY must fall below 155.14, with the YTD low at 154.39 as the next support level.

The EUR/JPY recovered some ground on Monday, registering gains of over 0.40% and climbing past the 156.00 figure. As Tuesday’s Asian session begins, the cross-currency pair exchanges hands at 156.51, virtually unchanged.

Last week, the European Central Bank (ECB) lowered rates by 0.25%, yet signaled that it would most likely pause at the October meeting due to the lack of data policymakers would have at their disposal. This boosted the Euro, though the jump could be short-lived as a Bank of Japan (BoJ) monetary policy decision looms.

EUR/JPY Price Forecast: Technical outlook

The pair remains downward biased despite recovering from an over 4.70% fall. The momentum is bearish but has flatlined, hinting that consolidation lies ahead. That said, the EUR/JPY could remain range-bound within a 150-pip volatility range.

If EUR/JPY climbs above 157.00, the next resistance will be the Tenkan-Sen at 157.46. A breach of the latter will expose the Senkou Span A at 158.49, followed by the Kijun-Sen at 159.52.

Conversely, for a bearish continuation, EUR/JPY must drop below the September 16 low of 155.14. The next support would be the year-to-date (YTD) low of 154.39.  

EUR/JPY Price Action – Daily Chart

Euro PRICE Today

The table below shows the percentage change of Euro (EUR) against listed major currencies today. Euro was the strongest against the Swiss Franc.

  USD EUR GBP JPY CAD AUD NZD CHF
USD   0.00% 0.02% 0.01% -0.01% -0.01% -0.03% 0.03%
EUR -0.01%   0.00% -0.02% -0.03% -0.02% -0.04% 0.03%
GBP -0.02% -0.01%   0.00% -0.02% -0.02% -0.04% -0.01%
JPY -0.01% 0.02% 0.00%   0.01% -0.02% -0.03% -0.02%
CAD 0.01% 0.03% 0.02% -0.01%   0.00% -0.01% 0.01%
AUD 0.00% 0.02% 0.02% 0.02% -0.00%   -0.01% -0.02%
NZD 0.03% 0.04% 0.04% 0.03% 0.00% 0.01%   0.02%
CHF -0.03% -0.03% 0.00% 0.02% -0.01% 0.02% -0.02%  

The heat map shows percentage changes of major currencies against each other. The base currency is picked from the left column, while the quote currency is picked from the top row. For example, if you pick the Euro from the left column and move along the horizontal line to the US Dollar, the percentage change displayed in the box will represent EUR (base)/USD (quote).
 

Source link

17 09, 2024

Hits five-day peak above 1.3200

By |2024-09-17T04:58:00+03:00September 17, 2024|Forex News, News|0 Comments

  • GBP/USD nears 1.3239, with potential to test the YTD high at 1.3266 and March 2022 peaks.
  • Bulls bought the dip at 1.3001, fueling the rally to current levels.
  • Failure at 1.3200 could see a pullback towards 1.3150, with further downside risks at 1.3100 and 1.3044.

The Pound Sterling rallied in early trading during the North American session against the Greenback, registering gains of over 0.60% and hitting a five-day peak of 1.3214. At the time of writing, the GBP/USD trades at 1.3199.

GBP/USD Price Forecast: Technical outlook

The GBP/USD has risen sharply, as bullish momentum picked up, as portrayed by the Relative Strength Index (RSI). In addition, bulls buying the dip at 1.3001 lifted spot prices to the current exchange rate.

Still, GBP/USD remains shy of testing the September 6 high of 1.3239. In that outcome, the next resistance level would be the year-to-date (YTD) high at 1.3266. Once surpassed, the daily high on March 23, 2022, would be up for grabs at 1.3298 before the pair hits the March 1, 2022, high at 1.3437.

Conversely, if GBP/USD stands below 1.3200, this could exacerbate a re-test of the 1.3100 figure. But firstly, sellers need to challenge 1.3150. Further losses lie at 1.3044, and the July 17 high turned support.

GBP/USD Price Action – Daily Chart

British Pound PRICE Today

The table below shows the percentage change of British Pound (GBP) against listed major currencies today. British Pound was the strongest against the US Dollar.

  USD EUR GBP JPY CAD AUD NZD CHF
USD   -0.42% -0.54% -0.21% -0.02% -0.48% -0.41% -0.31%
EUR 0.42%   -0.18% 0.17% 0.37% -0.12% -0.04% 0.07%
GBP 0.54% 0.18%   0.28% 0.54% 0.06% 0.15% 0.26%
JPY 0.21% -0.17% -0.28%   0.20% -0.21% -0.17% -0.15%
CAD 0.02% -0.37% -0.54% -0.20%   -0.54% -0.40% -0.40%
AUD 0.48% 0.12% -0.06% 0.21% 0.54%   0.08% 0.17%
NZD 0.41% 0.04% -0.15% 0.17% 0.40% -0.08%   0.11%
CHF 0.31% -0.07% -0.26% 0.15% 0.40% -0.17% -0.11%  

The heat map shows percentage changes of major currencies against each other. The base currency is picked from the left column, while the quote currency is picked from the top row. For example, if you pick the British Pound from the left column and move along the horizontal line to the US Dollar, the percentage change displayed in the box will represent GBP (base)/USD (quote).


Source link

17 09, 2024

USD/JPY Forecast – US Dollar Continues to Test a Major Level

By |2024-09-17T00:52:52+03:00September 17, 2024|Forex News, News|0 Comments

US Dollar vs Japanese Yen Technical Analysis

The U.S. Dollar has broken down a bit during the early hours on Monday to test the 140 yen level. This is an area that I think a lot of people will be paying attention to. And it’ll be interesting to see if there’s any chance of a bounce. We are pretty much right on the edge of a trend line at the same time as being at this large round psychologically significant figure.

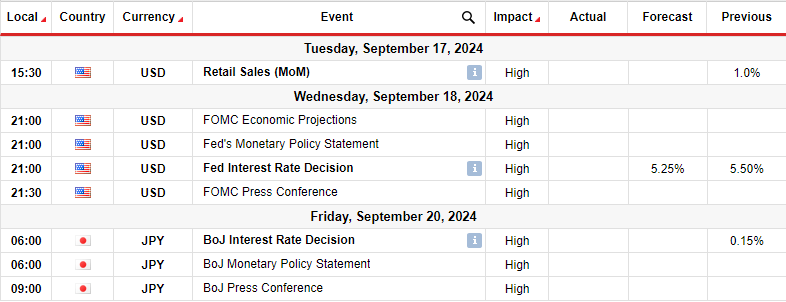
But a lot of this comes down to what happens on Wednesday and Friday for the matter. Let us not forget that not only do we have an FOMC interest rate decision on Wednesday and the press conference, which of course is important. But we also have the Friday Bank of Japan interest rate decision and press conference. So that could leave this market the epicenter of a lot of noise this week.

Because of this, I think it’s interesting to pay close attention to this market. And if we can turn around and recapture the 142 yen level and the Bank of Japan isn’t as hawkish as people think they’re going to be. This could be the end of the sell-off. On the other hand, if we continue to see a lot of negativity here, I think that is a general signal that risk appetite will crater, and you will see it be a situation where everything sells off given enough time. So this is the epicenter of risk appetite in the currency markets.

For a look at all of today’s economic events, check out our economic calendar.

This article was originally posted on FX Empire

More From FXEMPIRE:

Source link

16 09, 2024

Bulls To Regain Control (Chart)

By |2024-09-16T22:50:27+03:00September 16, 2024|Forex News, News|0 Comments

(MENAFN– Daily Forex) At the beginning of this week, the GBP/USD pair was trading around $1.3158, up by about 0.2% from the previous Fridayu0026#39;s levels, this was driven by a weaker US dollar despite signs of stubborn producer prices in the United States to economic data, the latest US Producer Price index data came in stronger than expected, rising 0.2% in August, up from a downwardly revised flat reading in the previous month, growing concerns that a weak US labor market could push the federal Reserve into an aggressive easing cycle in the near term have undermined the US dollaru0026#39;s upside potential. On the other hand, the latest initial US jobless claims report rose as expected to 230,000, revealing another increase in the number of unemployed US citizens claiming unemployment benefits figure held above averages seen at the start of the year, reinforcing concerns about a weak US labour market in the wake of a bleak US payrolls report in August. As a result, this offset any potential shifts in the current market consensus around multiple US interest rate cuts by the Federal Reserve this year, as the spectre of a US hiring slowdown weighed on the US dollar, a slight decline in US Treasury yields put further pressure on the US dollar, leaving the greenback languishing near recent lows Pound Sterling (GBP) Fluctuates Amid Data QuietIn contrast, the pound (GBP) has struggled to attract investor interest recently amid a lack of fresh US data. Overall, the lack of fresh information has led to uncertainty in market sentiment, which in turn has dampened investor interest in sterling, which is now more risk sensitive. In addition, the impact of disappointing UK growth figures continues to weigh on sterling, with no new factors to offset this effect on this, Chris Turner, global markets analyst at ING, said: u0026ldquo;UK interest rates have come down quite a bit so far, with 2-year GBP swap rates down by around 30bps. It is unclear whether this is a result of weak UK GDP data or simply a belief that interest rates will come down across the world and that the UK should not be an exception u0026ndash; despite the silence from the Bank of England.u0026rdquo;Despite recent speculation that the BoE may introduce a less aggressive policy easing cycle than other major central banks, the combination of global political shifts and slower economic growth in the UK appears to be limiting any potential recovery for sterling. Top Forex Brokers 1 Get Started 74% of retail CFD accounts lose money Read Review BrokerGeoLists({ type: u0027MobileTopBrokersu0027, id: u0027mobile-top-5u0027, size: 5, getStartedText: u0060Get Startedu0060, readReviewText: u0060Read Reviewu0060, Logo: u0027broker_carrousel_iu0027, Button: u0027broker_carrousel_nu0027, });GBP/USD Forecast: Is Risk Appetite Influencing Movement?Looking ahead, we may see the data-free end of the week in both the US and the UK affect global risk dynamics and the movement of the currency pair. Accordingly, any gloomy trade could support the US dollar as a safe haven, while an improvement in market sentiment could boost the risk-sensitive pound sterling against its safer competitors. As far as the UK is concerned, the recent RICS housing index improved sharply to 1 for August from a previously revised -18, which was well above consensus forecasts and the strongest reading since October 2022 commented on the monetary policy decision this week, saying, u0026quot;We expect a majority of Monetary Policy Committee members to vote to keep interest rates unchanged next week by a 7-2 margin.u0026quot;In the UK, too, attention will be focused on upcoming inflation data and the Bank of Englandu0026rsquo;s policy meeting. Widely, the BoE is expected to maintain interest rates, after cutting rates by 25 basis points last month. The main factor influencing the BoEu0026rsquo;s decision will be UK inflation data, due out on Wednesday, just a day before the central bank announces policy. Annual inflation is expected to remain steady at 2.2% in August, remaining above the Bank of Englandu0026rsquo;s 2.0% target. Later in the week, markets will also be closely watching retail sales figures and public sector net borrowing data for further economic insights. Top Forex Brokers 1 Get Started 74% of retail CFD accounts lose money Read Review BrokerGeoLists({ type: u0027MobileTopBrokersu0027, id: u0027mobile-top-5u0027, size: 5, getStartedText: u0060Get Startedu0060, readReviewText: u0060Read Reviewu0060, Logo: u0027broker_carrousel_iu0027, Button: u0027broker_carrousel_nu0027, });Technical forecasts for the GBP/USD pair today:With the recent gains of the GBP/USD, the currency pair has returned to its broader upward trend and the 1.3250 resistance on the daily chart will remain the most prominent to confirm the bullsu0026#39; strong control of the trend. Technically, we expect the GBP/USD to remain in its current trajectory until the markets and investors react to the announcements of both the Bank of England and the US Federal Reserve this week. The more hawkish the bank, the more supportive it will be for its currency, and we will see. Conversely, the psychological support of 1.3000 will remain the most important for a reversal of the current bullish outlook.

MENAFN16092024000131011023ID1108679457


Legal Disclaimer:
MENAFN provides the information “as is” without warranty of any kind. We do not accept any responsibility or liability for the accuracy, content, images, videos, licenses, completeness, legality, or reliability of the information contained in this article. If you have any complaints or copyright issues related to this article, kindly contact the provider above.

Source link

16 09, 2024

EUR/USD gaining ground ahead of Federal Reserve’s decision

By |2024-09-16T16:47:28+03:00September 16, 2024|Forex News, News|0 Comments

EUR/USD Current price: 1.1120

  • Looming Federal Reserve’s announcement undermines demand for the US Dollar.
  • Eurozone and United States data came in better than anticipated.
  • EUR/USD is technically bullish and could reach the 1.1150 region in the near term.

The EUR/USD pair surged to 1.1132 on Monday, its highest in over a week. The pair trades nearby amid the broad US Dollar’s weakness, fueled by speculation the Federal Reserve (Fed) will trim interest rates when it meets this week. The Fed is scheduled to announce its decision on monetary policy next Wednesday, and market participants have long ago priced in a reduction of at least 25 basis points (bps). There is still a minor chance that the central bank will go for a more aggressive 50 bps cut, a decision that could further undermine demand for the USD.

Meanwhile, a firmer Japanese Yen (JPY) weighed on the Greenback at the beginning of the day. Central banks’ imbalances drove the USD/JPY to 139.54, a fresh multi-month low, as the Bank of Japan (BoJ), which also meets this week, is expected to move in the opposite direction of the Fed and hike interest rates.

Data-wise, the Eurozone released the July Trade Balance, which posted a seasonally adjusted surplus of €15.5 billion, below the June one at €17.0 billion. As for the United States (US), the country released the NY Empire State Manufacturing Index, which drastically improved to 11.5 in September from -4.7 in the previous month. As a result, the USD remained under selling pressure. There are no other relevant figures scheduled for the rest of the day.

EUR/USD short-term technical outlook

Technically, the EUR/USD pair is bullish. The daily chart shows it hovers near the intraday high after recovering above a bullish 20 Simple Moving Average (SMA). The latter provides near-term support in the 1.0990 price zone. At the same time, technical indicators aim north, although with uneven strength and the Momentum indicator still below its 100 line, somehow limiting the upward potential. Finally, the 100 SMA grinds higher above a flat 200 SMA, suggesting persistent buying interest.

In the near term, and according to the 4-hour chart, the bullish momentum eased, although the risk remains skewed to the upside. EUR/USD is developing above all its moving averages, with only the 20 SMA heading north, trapped between flat 100 and 200 SMAs. Technical indicators, in the meantime, have lost their upward strength after reaching overbought readings, now hovering directionless near their intraday peaks.

 Support levels: 1.0990 1.0950 1.0910

Resistance levels: 1.1050 1.1090 1.1140

Source link

16 09, 2024

GBP/USD Forecast Today – 16/09: GBP Shows Volatility (Chart)

By |2024-09-16T14:46:33+03:00September 16, 2024|Forex News, News|0 Comments

Date


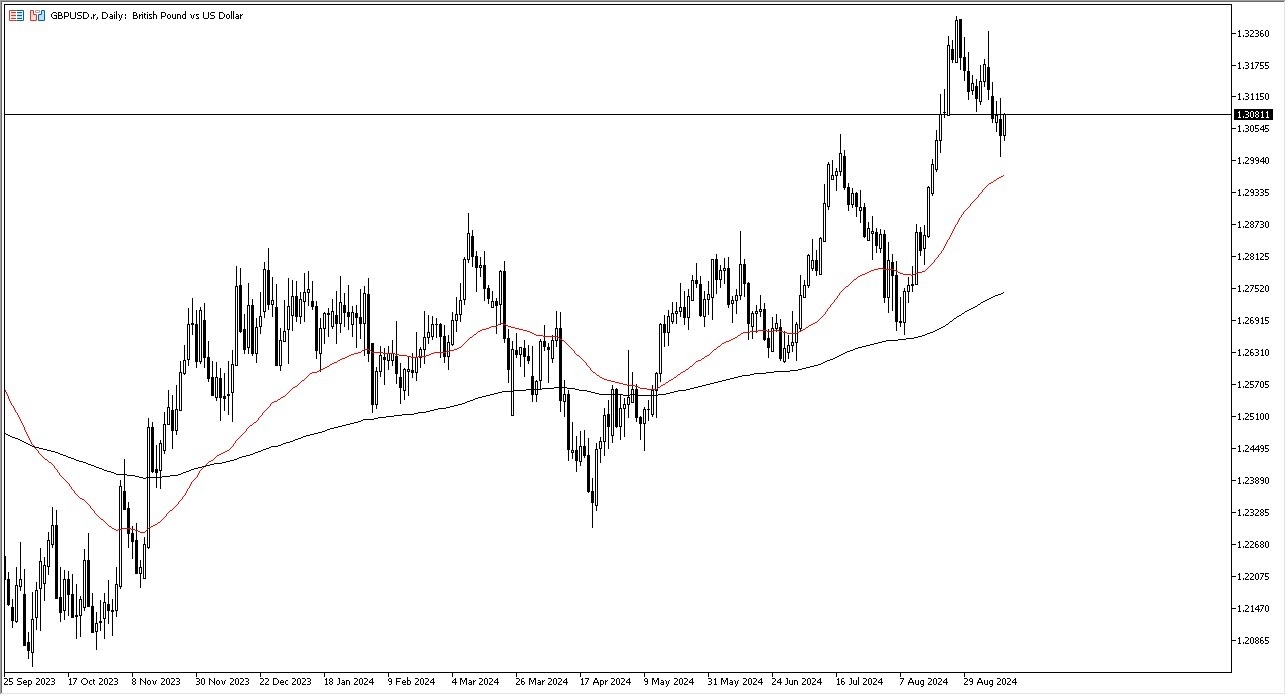
(MENAFN– Daily Forex) While we did break above the 1.3150 level, we ended up giving back the gains and have closed the market with essentially what looks like a shooting star suggests that the market is probably going to continue to struggle going higher quite frankly, I think that makes quite a bit of sense considering that although the federal Reserve is likely to cut rates on September 18, the reality is that the bank of England is probably going to be right there with them, as we have recently seen economic numbers slow down around the world. Although it is worth noting that both inflation numbers out of America this week have been a little bit stronger than anticipated. Top Forex Brokers 1 Get Started 74% of retail CFD accounts lose money Read Review BrokerGeoLists({ type: u0027MobileTopBrokersu0027, id: u0027mobile-top-5u0027, size: 5, getStartedText: u0060Get Startedu0060, readReviewText: u0060Read Reviewu0060, Logo: u0027broker_carrousel_iu0027, Button: u0027broker_carrousel_nu0027, });All of that being said, the technical analysis does suggest that we are in the midst of trying to form some type of bullish flag, and the measure move could be all the way up to the 1.39 level, but I wouldnu0026#39;t necessarily hold my breath for that due to the fact that it would require a market that is comfortable going long over the longer term we were to break down:On the other hand, if we were to break down from here, the 1.30 level would more likely than not be support, not only due to the fact that it was a large, round, psychologically significant figure, but itu0026#39;s also where the 50-day EMA currently hangs about. In general, I think that the GBP/USD market continues to be very noisy, but I do think it favors the upside overall. However, I would not be somebody looking to hang on to trades for any significant amount of time because quite frankly, the volatility is probably only going to get worse from this point on.

MENAFN16092024000131011023ID1108677153


Daily Forex


Legal Disclaimer:
MENAFN provides the information “as is” without warranty of any kind. We do not accept any responsibility or liability for the accuracy, content, images, videos, licenses, completeness, legality, or reliability of the information contained in this article. If you have any complaints or copyright issues related to this article, kindly contact the provider above.

Source link

16 09, 2024

USD/JPY Forecast: 140.0 Broken Amid Rising Fed Rate Bets

By |2024-09-16T12:45:50+03:00September 16, 2024|Forex News, News|0 Comments

  • The dollar lost around 1.3% against the yen last week.
  • News outlets revealed a high chance for a 50 bps Fed rate cut.
  • The Bank of Japan will meet on Friday.

The USD/JPY forecast indicates further declines for the dollar due to a surge in Fed rate cut expectations. At the same time, the yen was on the front foot as investors looked forward to the Bank of Japan policy meeting. 

Are you interested in learning more about STP brokers? Check our detailed guide-

The dollar lost around 1.3% against the yen last week after reports that the Fed might consider a more significant rate cut at this week’s meeting. Initially, markets were convinced that policymakers would vote for a 25 bps cut. Inflation was slightly higher than expected, and the labor market was not in such a terrible shape. Therefore, the US central bank could afford to start cutting rates slowly. 

However, this outlook shifted on Friday when news outlets revealed a high chance for a 50 bps rate cut. Consequently, investors moved to price a higher chance for such an outcome, weighing on the dollar. By Monday, investors were pricing a 59% of a 50 bps rate cut. At the same time, total cuts in 2024 rose to 125 bps. 

The Fed is poised to cut rates on Wednesday. However, traders are still betting between a 25 and a 50 bps rate cut. Therefore, whichever size the central bank picks will likely increase market volatility.

On the other hand, the Bank of Japan is set to meet on Friday this week. Although the BoJ might keep rates unchanged, the messaging might be hawkish. Recent remarks from policymakers have shown that they are willing to keep hiking interest rates. 

USD/JPY key events today

With a holiday in Japan and no key events in the US, the price might extend last week’s move.

USD/JPY technical forecast: Bullish RSI divergence fails 

USD/JPY Forecast: 140.0 Broken Amid Rising Fed Rate Bets
USD/JPY 4-hour chart

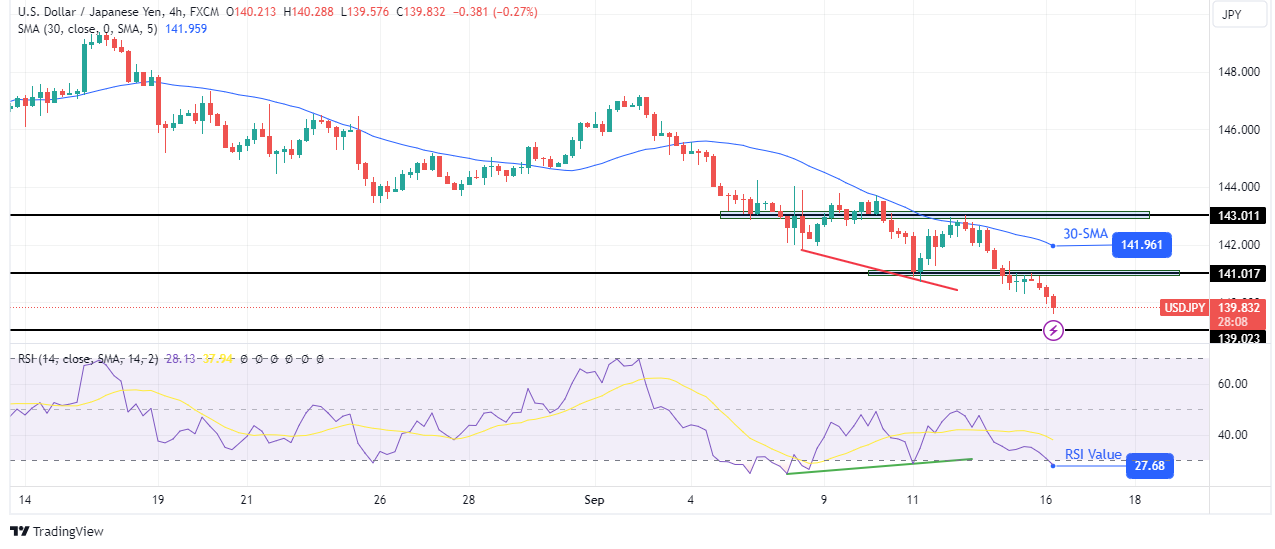
On the technical side, the USD/JPY price has made a new low in the downtrend after breaking below the 141.01 support level. This has strengthened the bearish bias as the price has fallen well below the 30-SMA with the RSI in the oversold region. 

Are you interested in learning more about forex robots? Check our detailed guide-

Previously, the price had paused at the 141.01 level. Here, the RSI indicated a bullish divergence, signaling a reversal. However, when bulls took over, they failed to breach the 30-SMA, a sign that bears remain in the lead. This downtrend might soon reach the 139.02 support level.

Looking to trade forex now? Invest at eToro!

68% of retail investor accounts lose money when trading CFDs with this provider. You should consider whether you can afford to take the high risk of losing your money

Source link

15 09, 2024

GBP/USD Weekly Forecast: FOMC May Spell Trouble for the Dollar

By |2024-09-15T14:23:47+03:00September 15, 2024|Forex News, News|0 Comments

  • The UK labor market showed resilience, with jobless claims plunging.
  • US data showed higher-than-expected consumer and producer prices.
  • Experts believe the US central bank will cut rates by 25 bps.

The GBP/USD weekly forecast supports a bullish trend as the FOMC meeting could lead to further weakness for the greenback.

Ups and downs of GBP/USD

The GBP/USD pair had a bullish week after a mix of UK and US economic reports. Notably, the UK labor market showed resilience, with jobless claims plunging. Meanwhile, the economy stagnated, with no growth, indicating a weaker-than-expected recovery. 

Are you interested in learning more about STP brokers? Check our detailed guide-

On the other hand, US data showed higher-than-expected consumer and producer prices, reducing the likelihood of a super-sized rate cut. Consequently, the dollar rose. However, this changed late on Thursday after reports indicated that a 50 bps rate cut was a close call. The dollar dropped, allowing the pound to close on a bullish candle.

Next week’s key events for GBP/USD

GBP/USD Weekly Forecast: FOMC May Spell Trouble for the Dollar

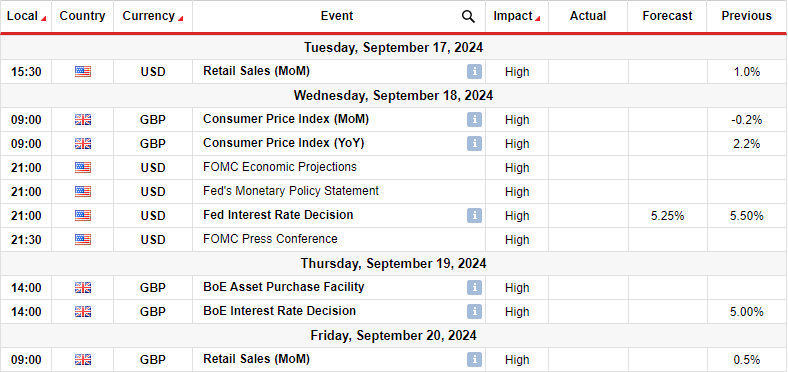
Next week, high-impact UK events will include the consumer inflation and retail sales reports and the Bank of England policy meeting. Meanwhile, in the US, the market will focus on the FOMC meeting and retail sales data. 

Experts believe the US central bank will cut rates by 25 bps. However, there is still uncertainty regarding this, as some expect a more significant cut. Therefore, there might be a lot of volatility in the markets on Wednesday. Meanwhile, the Bank of England might keep rates unchanged owing to recent better-than-expected economic data. However, this outlook might change if inflation eases more than expected.

GBP/USD weekly technical forecast: Bulls resurface at solid support zone

GBP/USD weekly technical forecastGBP/USD weekly technical forecast
GBP/USD daily chart

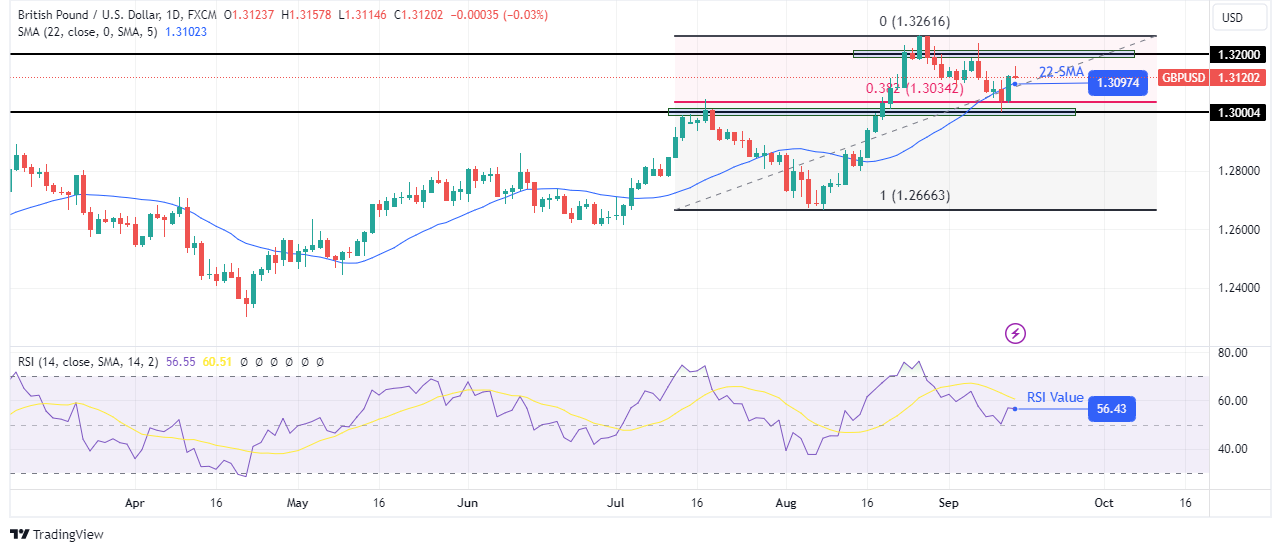
On the technical side, the GBP/USD price is on a developed bullish trend, with higher highs and higher lows. At the same time, the price has traded mostly above the 22-SMA, a sign that bulls are in the lead. Meanwhile, the RSI has traded in bullish territory, touching the overbought region several times. 

Are you interested in learning more about forex robots? Check our detailed guide-

The uptrend recently reached the 1.3200 critical resistance level, but the price failed to sustain a move above it. Consequently, bears took charge, triggering a pullback to the 22-SMA support. The SMA coincided with the 1.3000 psychological level and the 0.382 Fib, creating a solid support zone. The price has made a strong bullish candle that shows it might bounce higher to retest the 1.3200 level. A higher high will strengthen the bullish bias. 

Looking to trade forex now? Invest at eToro!

68% of retail investor accounts lose money when trading CFDs with this provider. You should consider whether you can afford to take the high risk of losing your money

Source link

15 09, 2024

GBP/USD Forecast Today 13/9: Bounces Back (Video+Chart)

By |2024-09-15T12:22:18+03:00September 15, 2024|Forex News, News|0 Comments

  • During my daily analysis of the GBP/USD pair, I see that we are bouncing a bit, and it does look like we are ready to go going higher.
  • The 1.30 level underneath is a large, round, psychologically significant figure, and an area that is backed up by the 50-Day EMA overall.
  • Ultimately, the market pulling back the way it has is a sign that perhaps we are starting to see a little bit of value offered in this currency pair, and breaking above the 1.31 level could bring in more buying pressure as we continue to see a lot of momentum jump back into this market.

All things being equal, it’s worth noting that the Bank of England is probably going to be cutting rates, but it seems like most people are out there focusing on the Federal Reserve, and the fact that we are more likely than not going to continue to cut rates in an aggressive manner, at least as far as the market is concerned, and therefore it’s likely that we will continue to see a lot of traders trying to get short of the US dollar in general. Whether or not that actually pans out for the longer term, the reality is that the momentum is with the British pound at the moment.

Central banks around the world are racing to the bottom

Central banks around the world are racing to the bottom as far as interest rates are concerned, so to be a bit of an interesting situation to trade, mainly due to the fact that it comes down to the destruction of their own currencies, as the market will try to price all of that in. All things being equal, this is a market that I think continues to see the US dollar in its crosshairs, but if we do get some type of massive “risk off move”, this will send the US dollar much higher against most currencies, including this one. As things stand right now though, there’s nothing on the chart that suggests that we are going to do so.

Want to begin trading the daily GBP/USD Forex analysis? Get our top rated Forex brokers in the UK here.

Source link

14 09, 2024

USD/JPY Weekly Forecast: Fed Cut, Hawkish BOJ to Trigger Bears

By |2024-09-14T22:10:53+03:00September 14, 2024|Forex News, News|0 Comments

  • The dollar fell due to renewed bets for a 50 bps September Fed rate cut.
  • Several Bank of Japan policymakers drummed up support for more rate hikes.
  • Investors will focus on the FOMC and BoJ policy meetings.

The USD/JPY weekly forecast indicates a potential collapse if the Fed cuts by 50-bps and the Bank of Japan delivers a hawkish meeting.

Ups and downs of USD/JPY

USD/JPY has fallen and closed on a bearish candle in the past week. This came as the dollar collapsed while the yen strengthened. The dollar fell due to renewed bets for a 50 bps rate cut towards the end of the week. Initially, inflation reports had pointed to a smaller cut. 

Are you interested in learning more about STP brokers? Check our detailed guide-

On the other hand, the yen rallied as several Bank of Japan policymakers drummed up support for more rate hikes.

Next week’s key events for USD/JPY 

USD/JPY Weekly Forecast: Fed Cut, Hawkish BOJ to Trigger Bears

Next week, investors will focus on the FOMC policy meeting and retail sales data from the US. At the same time, the Bank of Japan will hold its policy meeting on Friday. Investors have waited for the September Fed meeting for a long time. The Fed will likely pivot at this meeting, implementing its first rate cut.

However, investors are unsure whether this will be 25 or 50 bps. A small rate cut could boost the dollar as it would precede a gradual pace for easing. On the other hand, a large rate cut would sink the greenback.

Meanwhile, the Bank of Japan might maintain rates for now. However, economists are pricing another rate hike before the year ends. 

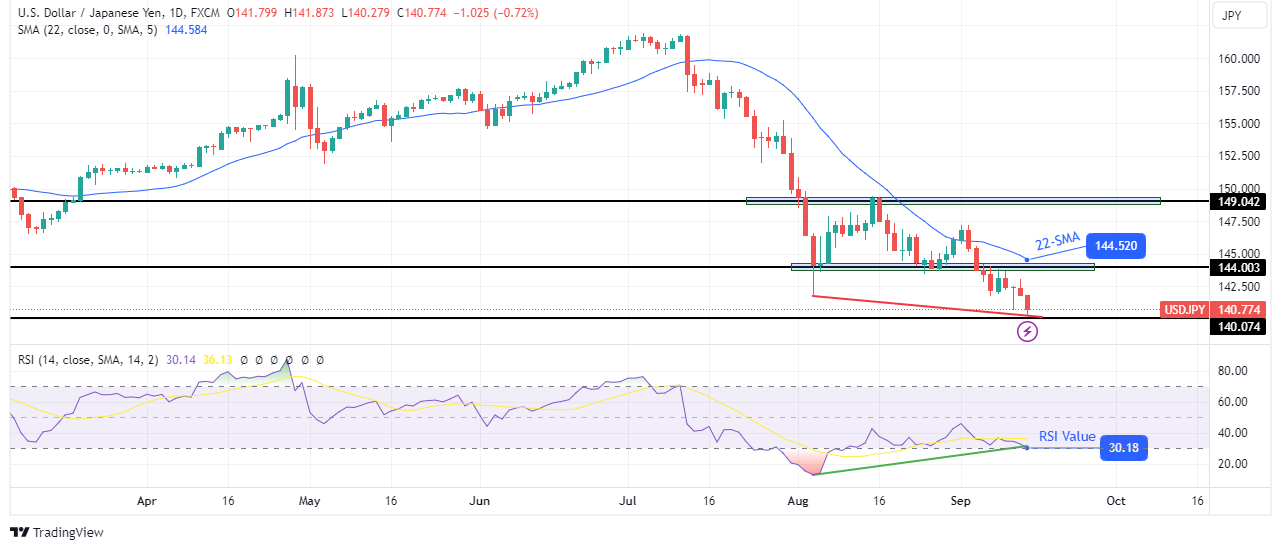
USD/JPY weekly technical forecast: Bullish divergence near 140.07 

USD/JPY weekly technical forecastUSD/JPY weekly technical forecast
USD/JPY 4-hour chart

On the technical side, the USD/JPY price has made a new low in the downtrend after breaking below the 144.00 support level. Bears have remained in charge since the price broke below the 22/SMA, and the RSI dipped below 50. Since then, the price has declined steeply and paused near the 140.07 support level. 

Are you interested in learning more about forex robots? Check our detailed guide-

However, bears have weakened with time, and the price started consolidating near the 22-SMA. At the same time, the RSI has made a bullish divergence, indicating fading bearish momentum. Therefore, the tides might soon change. If bears fail to breach the 140.07 support, the price might reverse to challenge the 22-SMA and the 144.00 level.

A break above the SMA would indicate a shift in sentiment. On the other hand, if the SMA holds firm, the downtrend might continue.

Looking to trade forex now? Invest at eToro!

68% of retail investor accounts lose money when trading CFDs with this provider. You should consider whether you can afford to take the high risk of losing your money

Source link

Go to Top