The main tag of Forex News Today Articles.
You can use the search box below to find what you need.
[wd_asp id=1]

9 05, 2024

US Dollar turns south on dismal US data

By |2024-05-09T16:23:30+03:00May 9, 2024|Forex News, News|0 Comments

You have reached your limit of 5 free articles for this month.

Get Premium without limits for only $9.99 for the first month

Access all our articles, insights, and analysts.

Your coupon code


UNLOCK OFFER

EUR/USD Current price: 1.0760

  • United States Initial Jobless Claims unexpectedly jumped to 231K at the beginning of May.
  • Market players await clearer clues before compromising with a specific direction.
  • EUR/USD bounced from fresh weekly lows but lacks enough momentum.

The EUR/USD pair fell to the lower end of its weekly range, extending the slide by a few pips yet holding above the 1.0700 mark during the European session. The US Dollar benefited from a souring market mood, as reflected by the poor performance of global equities. Wall Street closed mixed on Wednesday, leading to choppy trading and further uncertainty in its Asian and European rivals. As we approach Thursday’s opening, United States (US) indexes trade with a soft tone and aim to start the day without much changes, although near monthly highs.

Financial markets are still seeking a catalyst after acknowledging that central banks will maintain interest rates on hold for longer than previously anticipated. Growth has become less of a concern, with global signs of tepid recovery. Inflation, on the other hand, has decelerated its slide and turned a bit more worrisome, but it is close enough to central banks’ goals to spook the odds for rate hikes.

The European macroeconomic calendar had nothing relevant to offer, as several countries celebrated a bank holiday, Ascension Day. As for the US, the country released Initial Jobless Claims for the week ended May 3, which unexpectedly jumped to 231K, much worse than the 210K anticipated. The USD shed some ground with the news, with EUR/USD recovering to the 1.0760 region.

EUR/USD short-term technical outlook

From a technical point of view, the EUR/USD pair maintains a neutral stance. It had turned positive for the day but lacks momentum enough to confirm a continued advance in the upcoming session. The daily chart shows technical indicators remain directionless within positive levels, which is in line with the ongoing range trading. At the same time, EUR/USD develops below bearish 100 and 200 Simple Moving Averages (SMAs) while a flat 20 SMA provides dynamic support at around  1.0695.

According to the 4-hour chart, EUR/USD is neutral-to-bullish in the near term. The pair recovered above its 100 and 200 SMAs while battling a directionless 20 SMA. Finally, technical indicators have turned firmly higher but remain below their midlines. The pair would need to clear the 1.0810 price zone to actually turn bullish and anticipate another leg north in the near term.

Support levels: 1.0695 1.0660 1.0620

Resistance levels: 1.0810 1.0840 1.0885  
EUR/USD Current price: 1.0760

  • United States Initial Jobless Claims unexpectedly jumped to 231K at the beginning of May.
  • Market players await clearer clues before compromising with a specific direction.
  • EUR/USD bounced from fresh weekly lows but lacks enough momentum.

The EUR/USD pair fell to the lower end of its weekly range, extending the slide by a few pips yet holding above the 1.0700 mark during the European session. The US Dollar benefited from a souring market mood, as reflected by the poor performance of global equities. Wall Street closed mixed on Wednesday, leading to choppy trading and further uncertainty in its Asian and European rivals. As we approach Thursday’s opening, United States (US) indexes trade with a soft tone and aim to start the day without much changes, although near monthly highs.

Financial markets are still seeking a catalyst after acknowledging that central banks will maintain interest rates on hold for longer than previously anticipated. Growth has become less of a concern, with global signs of tepid recovery. Inflation, on the other hand, has decelerated its slide and turned a bit more worrisome, but it is close enough to central banks’ goals to spook the odds for rate hikes.

The European macroeconomic calendar had nothing relevant to offer, as several countries celebrated a bank holiday, Ascension Day. As for the US, the country released Initial Jobless Claims for the week ended May 3, which unexpectedly jumped to 231K, much worse than the 210K anticipated. The USD shed some ground with the news, with EUR/USD recovering to the 1.0760 region.

EUR/USD short-term technical outlook

From a technical point of view, the EUR/USD pair maintains a neutral stance. It had turned positive for the day but lacks momentum enough to confirm a continued advance in the upcoming session. The daily chart shows technical indicators remain directionless within positive levels, which is in line with the ongoing range trading. At the same time, EUR/USD develops below bearish 100 and 200 Simple Moving Averages (SMAs) while a flat 20 SMA provides dynamic support at around  1.0695.

According to the 4-hour chart, EUR/USD is neutral-to-bullish in the near term. The pair recovered above its 100 and 200 SMAs while battling a directionless 20 SMA. Finally, technical indicators have turned firmly higher but remain below their midlines. The pair would need to clear the 1.0810 price zone to actually turn bullish and anticipate another leg north in the near term.

Support levels: 1.0695 1.0660 1.0620

Resistance levels: 1.0810 1.0840 1.0885  

Source link

9 05, 2024

Pound Sterling looks offered prior to BoE

By |2024-05-09T14:22:01+03:00May 9, 2024|Forex News, News|0 Comments

You have reached your limit of 5 free articles for this month.

Get Premium without limits for only $9.99 for the first month

Access all our articles, insights, and analysts.

Your coupon code


UNLOCK OFFER

  • GBP/USD navigates its third consecutive session of losses.
  • Weakness is expected to accelerate below the 200-day SMA.
  • Markets’ attention shifts to the BoE’s Super Thursday.

So far on Wednesday, GBP/USD trades slightly on the defensive around the 1.2500 neighbourhood amidst rising investors’ prudence prior to the BoE’s Super Thursday.

Also adding to Cable’s downward bias is the continuation of the constructive trend in the Greenback, which remains propped up by further selling in the US bond market, which in turn morphs into an extra upside in US yields across the curve.

Still around the US Dollar (USD), Tuesday’s comments from Minneapolis Federal Reserve President Neel Kashkari appear to have lent extra legs to the currency after he expressed a more optimistic stance on the housing market’s resilience to monetary tightening while suggesting the possibility of further policy adjustments if inflation persists.

In the meantime, the broad-based narrative pointing to increasing policy divergence between the Federal Reserve (Fed) and the rest of its G10 peers continues to dominate market sentiment and is expected to keep the US Dollar on the positive foot in the near-to-medium term.

According to CME Group’s FedWatch Tool, there is around a 65% probability that the central bank will reduce its interest rates at the September 18 gathering.

Moving forward, the Bank of England (BoE) will reveal its monetary policy decisions later on Super Thursday. While the “Old Lady” is largely anticipated to keep its policy rate unchanged at 5.25%, the persistent decline in domestic inflation and expectations of a sustained drop in consumer prices in the next few months open the door to a potential dovish tone at the bank’s meeting, which could, in turn, keep the selling pressure around the British pound intact.

GBP/USD Technical Analysis

Immediately to the upside in GBP/USD now emerges the key 200-day SMA at 1.2542. Once the pair clears this region, it could then embark on a potential challenge of the so-far May top at 1.2634 (May 3). Further up comes the April peak at 1.2709 (April 9), ahead of the weekly high of 1.2803 (March 21). Extra gains from here should retarget the 2024 top of 1.2893 (March 8) prior to the weekly peak of 1.2995 (July 27, 2023), and the psychological 1.3000 yardstick.

Conversely, initial support is found at the 2024 bottom of 1.2299 (April 22), seconded by the weekly low of 1.2187 (November 10, 2023). If bears breach the latter, Cable could then attempt a move to the October 2023 bottom of 1.2037, ahead of the crucial contention zone of 1.2000. In addition, the day-to-day RSI slips back to around 46.


  • GBP/USD navigates its third consecutive session of losses.
  • Weakness is expected to accelerate below the 200-day SMA.
  • Markets’ attention shifts to the BoE’s Super Thursday.

So far on Wednesday, GBP/USD trades slightly on the defensive around the 1.2500 neighbourhood amidst rising investors’ prudence prior to the BoE’s Super Thursday.

Also adding to Cable’s downward bias is the continuation of the constructive trend in the Greenback, which remains propped up by further selling in the US bond market, which in turn morphs into an extra upside in US yields across the curve.

Still around the US Dollar (USD), Tuesday’s comments from Minneapolis Federal Reserve President Neel Kashkari appear to have lent extra legs to the currency after he expressed a more optimistic stance on the housing market’s resilience to monetary tightening while suggesting the possibility of further policy adjustments if inflation persists.

In the meantime, the broad-based narrative pointing to increasing policy divergence between the Federal Reserve (Fed) and the rest of its G10 peers continues to dominate market sentiment and is expected to keep the US Dollar on the positive foot in the near-to-medium term.

According to CME Group’s FedWatch Tool, there is around a 65% probability that the central bank will reduce its interest rates at the September 18 gathering.

Moving forward, the Bank of England (BoE) will reveal its monetary policy decisions later on Super Thursday. While the “Old Lady” is largely anticipated to keep its policy rate unchanged at 5.25%, the persistent decline in domestic inflation and expectations of a sustained drop in consumer prices in the next few months open the door to a potential dovish tone at the bank’s meeting, which could, in turn, keep the selling pressure around the British pound intact.

GBP/USD Technical Analysis

Immediately to the upside in GBP/USD now emerges the key 200-day SMA at 1.2542. Once the pair clears this region, it could then embark on a potential challenge of the so-far May top at 1.2634 (May 3). Further up comes the April peak at 1.2709 (April 9), ahead of the weekly high of 1.2803 (March 21). Extra gains from here should retarget the 2024 top of 1.2893 (March 8) prior to the weekly peak of 1.2995 (July 27, 2023), and the psychological 1.3000 yardstick.

Conversely, initial support is found at the 2024 bottom of 1.2299 (April 22), seconded by the weekly low of 1.2187 (November 10, 2023). If bears breach the latter, Cable could then attempt a move to the October 2023 bottom of 1.2037, ahead of the crucial contention zone of 1.2000. In addition, the day-to-day RSI slips back to around 46.


Source link

9 05, 2024

USD/JPY Forecast: Dollar Firms as Investors Prepare for US CPI

By |2024-05-09T12:18:51+03:00May 9, 2024|Forex News, News|0 Comments

  • Next week’s US inflation report will shape the outlook for Fed rate cuts.
  • Tokyo has spent approximately $60 billion to try and support its weak currency.
  • BoJ policymakers were increasingly hawkish at the April meeting.

The USD/JPY forecast leans bullish as the dollar strengthens ahead of next week’s US inflation data. Markets believe the economy is still robust, which could mean another upbeat inflation report. Meanwhile, hawkish sentiments from BoJ policymakers at their last meeting helped briefly support the yen.

Are you interested in learning more about copy trading platforms? Check our detailed guide-

Market participants are getting ready for the US inflation report, which will shape the outlook for Fed rate cuts. The last report led to a significant rally in the dollar that weighed on the yen and had Japanese authorities concerned. Another report could return the pair to the $160.00 level and trigger another intervention. In the last week, Tokyo has spent approximately $60 billion to try and support its weak currency. 

If inflation remains persistent, there is a high chance that investors will push back the timing for the first Fed rate cut. On the other hand, a surprise decline would be a big relief for the Fed, especially after the recent jobs report. It would solidify bets that the central bank will cut interest rates in September.

Elsewhere, minutes from the Bank of Japan’s last meeting in April revealed that policymakers were increasingly hawkish. As a result, experts believe the next rate hike could come in June or July. Although this strengthened the yen, it was only brief as it quickly resumed its decline against the dollar. 

USD/JPY key events today

  • US unemployment claims
  • US 30-y Bond auction

USD/JPY technical forecast: Channel breakout confirms bullish reversal

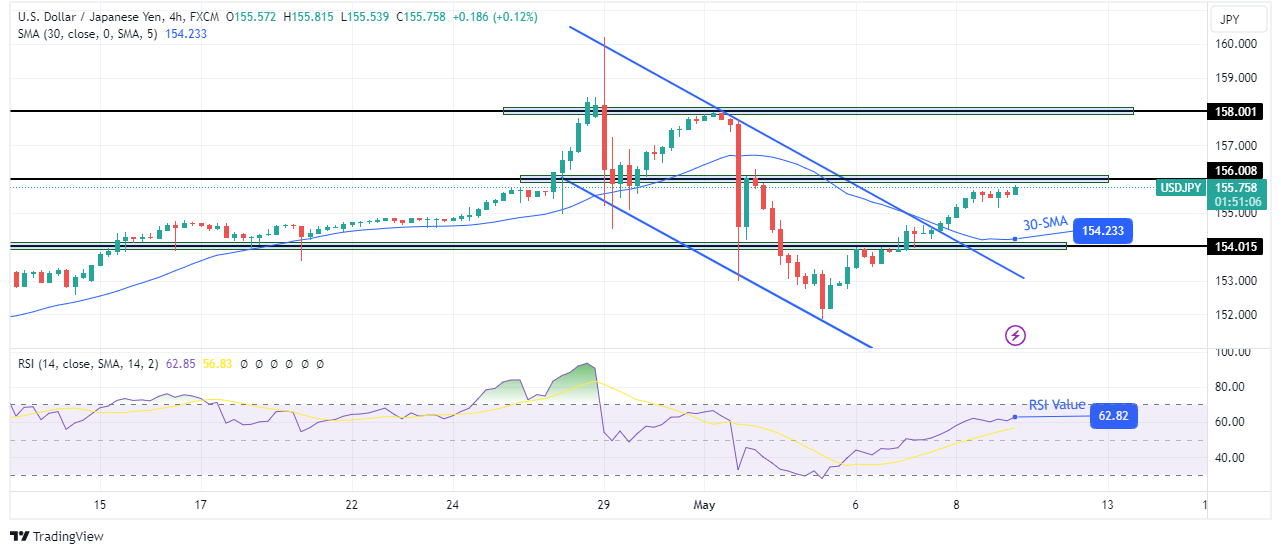
USD/JPY Forecast: Dollar Firms as Investors Prepare for US CPI
USD/JPY 4-hour chart

On the technical side, the USD/JPY price has broken out of its bearish channel and is quickly approaching the 156.00 key resistance level. The breakout shows that bulls have taken control. At the same time, the price trades above the 30-SMA with the RSI above 50, supporting the new bullish bias. 

Are you interested in learning more about scalping forex brokers? Check our detailed guide-

Bulls gained confidence when the price broke above the channel resistance. However, after such a strong rally, the price might pause at the 156.00 key resistance. This would allow it to pull back and retest the 30-SMA as support before continuing higher. Given the new bullish bias, the price might break above the 156.00 level to retest the 158.00 key resistance level.

Looking to trade forex now? Invest at eToro!

68% of retail investor accounts lose money when trading CFDs with this provider. You should consider whether you can afford to take the high risk of losing your money

Source link

9 05, 2024

EUR/USD, GBP/USD, USD/CAD, USD/JPY Forecasts – U.S. Dollar Gains Some Ground In Choppy Trading

By |2024-05-09T08:15:49+03:00May 9, 2024|Forex News, News|0 Comments

Important DisclaimersThe content provided on the website includes general news and publications, our personal analysis and opinions, and contents provided by third parties, which are intended for educational and research purposes only. It does not constitute, and should not be read as, any recommendation or advice to take any action whatsoever, including to make any investment or buy any product. When making any financial decision, you should perform your own due diligence checks, apply your own discretion and consult your competent advisors. The content of the website is not personally directed to you, and we does not take into account your financial situation or needs.The information contained in this website is not necessarily provided in real-time nor is it necessarily accurate. Prices provided herein may be provided by market makers and not by exchanges.Any trading or other financial decision you make shall be at your full responsibility, and you must not rely on any information provided through the website. FX Empire does not provide any warranty regarding any of the information contained in the website, and shall bear no responsibility for any trading losses you might incur as a result of using any information contained in the website.The website may include advertisements and other promotional contents, and FX Empire may receive compensation from third parties in connection with the content. FX Empire does not endorse any third party or recommends using any third party’s services, and does not assume responsibility for your use of any such third party’s website or services.FX Empire and its employees, officers, subsidiaries and associates, are not liable nor shall they be held liable for any loss or damage resulting from your use of the website or reliance on the information provided on this website.Risk DisclaimersThis website includes information about cryptocurrencies, contracts for difference (CFDs) and other financial instruments, and about brokers, exchanges and other entities trading in such instruments. Both cryptocurrencies and CFDs are complex instruments and come with a high risk of losing money. You should carefully consider whether you understand how these instruments work and whether you can afford to take the high risk of losing your money.FX Empire encourages you to perform your own research before making any investment decision, and to avoid investing in any financial instrument which you do not fully understand how it works and what are the risks involved.

Source link

9 05, 2024

Gold Price, USD/JPY, EUR/USD Technical Analysis And Trade Setups

By |2024-05-09T06:14:23+03:00May 9, 2024|Forex News, News|0 Comments

(MENAFN– DailyFX) SD/JPY, EUR/USD – Technical Analysis and Trade Setups Skip to Content News & Analysis at your fingertips. We use a range of cookies to give you the best possible browsing experience. By continuing to use this website, you agree to our use of cookies.
You can learn more about our cookie policy here , or by following the link at the bottom of any page on our site. See our updated Privacy Policy here .

MENAFN08052024000076011015ID1108191334


Legal Disclaimer:
MENAFN provides the information “as is” without warranty of any kind. We do not accept any responsibility or liability for the accuracy, content, images, videos, licenses, completeness, legality, or reliability of the information contained in this article. If you have any complaints or copyright issues related to this article, kindly contact the provider above.

Source link

9 05, 2024

USD/JPY Forecast: Wage Growth and BoJ Opinions Signal Possible Yen Moves

By |2024-05-09T04:13:15+03:00May 9, 2024|Forex News, News|0 Comments

Beyond the numbers, the Fed will remain in focus. FOMC member Mary Daly is on the calendar to speak. As a voting member of the Committee, views on inflation, the economic outlook, and the timing of interest rate cuts could move the dial.

Short-term Forecast

Near-term trends for the USD/JPY depend on household spending numbers from Japan and Fed chatter. Weaker-than-expected household spending trends could impact hopes of a BoJ rate hike. In contrast, Fed speakers remain concerned about US inflation, tilting monetary policy divergence toward the US dollar. However, investors should monitor for intervention threats.

USD/JPY Price Action

Daily Chart

The USD/JPY sat above the 50-day and 200-day EMAs, confirming the bullish price trends.

A USD/JPY breakout from the 156 handle could support a move toward the 158 level. A break above the 158 handle could give the bulls a run at the April 29 high of 160.209.

The Bank of Japan Summary of Opinions, US jobless claims, the Fed, and intervention chatter need consideration.

Alternatively, a USD/JPY drop below 155 would bring the 50-day EMA into play. A break below the 50-day EMA could signal a drop to the 151.685 support level.

The 14-day RSI at 57.05 indicates a USD/JPY move to the 160 handle before entering overbought territory.

Source link

9 05, 2024

USD/JPY Forecast July 24, 2017, Technical Analysis

By |2024-05-09T02:12:05+03:00May 9, 2024|Forex News, News|0 Comments

The US dollar fell significantly during the Friday session against the Japanese yen, slicing below the 111.50 level. Because of this, the market then fell towards the 111 handle, which of course has a certain amount of psychological significance. However, I believe that the real support is probably closer to the 110 handle, so rallies of this point in time should be and I selling opportunity. The 110 level will be massively supportive as it is a large, round, psychologically significant number, but given enough time I think that we do need to test the that area first. This pair does tend to be somewhat risk sensitive, but I think a lot of this comes down to what the Federal Reserve is doing.

Federal Reserve expectations

From traders around the world, they are starting to expect the Federal Reserve to be very slow to raise interest rates. Janet Yellen does a lot to boost that case as she spoke in front of Congress recently, suggesting that perhaps things would be data dependent yet again, but if the Federal Reserve looks likely to hike rates just as quickly as once thought, that will turn this market around completely. It looks to me as if the 110 level is an excellent area to find support, so I would anticipate a bit of bullish pressure in that area, and that will be supercharged by any statements coming out of her or major players coming out of the Federal Reserve. I think that the market is probably going to be bearish for the next several sessions, but the downward pressure is probably somewhat limited as far as where it can go. If we break down below the 109 level, then I think we fall apart completely.

This article was originally posted on FX Empire

More From FXEMPIRE:

Source link

9 05, 2024

Gains look limited beyond 1.0800

By |2024-05-09T00:11:35+03:00May 9, 2024|Forex News, News|0 Comments

You have reached your limit of 5 free articles for this month.

Get Premium without limits for only $9.99 for the first month

Access all our articles, insights, and analysts.

Your coupon code


UNLOCK OFFER

  • EUR/USD added to Tuesday’s losses and retested 1.0730.
  • The US Dollar kept its bullish bias amidst higher yields.
  • The ECB’s Holzmann and Wunsch advocated for rate cuts this year.

An extra rebound in the US Dollar (USD) prompted EUR/USD to build on Tuesday’s retracement and visit the 1.0730 region, or three-day lows, on Wednesday. That said, spot extended further the recent rejection from tops north of 1.0800 the figure (May 3).

The Dollar’s uptick came in tandem with a positive session in US bond yields across various maturities as investors continued to digest the recent decision by the Federal Reserve (Fed) to maintain interest rates unchanged, alongside the likelihood of the start of the bank’s easing cycle in September.

On the latter, CME Group’s FedWatch Tool sees the probability of a 25 bps rate cut at the September 18 meeting at nearly 50%.

It is worth noting that the Fed reiterated its openness to rate adjustments while expressing concerns about inflation and potential risks to economic stability. Additionally, the central bank hinted at a slowdown in the pace of balance sheet reduction, with Chair Jerome Powell suggesting that the next policy move is unlikely to involve a rate hike.

Looking ahead, intermittent Dollar weakness is expected to be short-lived due to deferred expectations of a potential Fed interest rate cut later in the year.

Meanwhile, the monetary policy environment remained unchanged, highlighting the contrast between the Fed and other G10 central banks, notably the European Central Bank (ECB).

Regarding the ECB, recent statements from ECB officials suggested the increasing possibility of the ECB starting its easing programme in June, leading to speculation about three interest rate cuts (equivalent to 75 basis points) for the remainder of the year. However, uncertainties persist regarding the central bank’s future decisions beyond the summer.

Looking forward, the relatively subdued economic fundamentals in the Eurozone, combined with the resilience of the US economy, support expectations for a stronger Dollar in the medium term, particularly considering the increasing likelihood of the ECB cutting rates well before the Fed.

Given this perspective, further weakness in EUR/USD should be viewed as a potential outcome in the medium term.

EUR/USD daily chart

EUR/USD short-term technical outlook

On the upside, EUR/USD is projected to face first resistance at the May high of 1.0812 (May 3), which comes before the intermediate 100-day SMA of 1.0834 and the April top of 1.0885 (April 9). North of here is the March peak of 1.0981 (March 8), prior to the weekly high of 1.0998 (January 11), all before reaching the psychological threshold of 1.1000.

Looking south, a break of the 2024 bottom of 1.0601 (April 16) might indicate a return to the November 2023 low of 1.0516 (November 1). Once this region is cleared, spot might dispute the weekly low of 1.0495 (October 13, 2023) ahead of the 2023 bottom of 1.0448 (October 3) and the round milestone of 1.0400.

The 4-hour chart shows the pair entering some consolidative range. Against that, there is an immediate up-barrier at 1.0812, seconded by 1.0885. Meanwhile, 1.0735 offers early support, ahead of 1.0649 and 1.0601. The relative strength index (RSI) lost momentum and receded to the sub-50 zone.

  • EUR/USD added to Tuesday’s losses and retested 1.0730.
  • The US Dollar kept its bullish bias amidst higher yields.
  • The ECB’s Holzmann and Wunsch advocated for rate cuts this year.

An extra rebound in the US Dollar (USD) prompted EUR/USD to build on Tuesday’s retracement and visit the 1.0730 region, or three-day lows, on Wednesday. That said, spot extended further the recent rejection from tops north of 1.0800 the figure (May 3).

The Dollar’s uptick came in tandem with a positive session in US bond yields across various maturities as investors continued to digest the recent decision by the Federal Reserve (Fed) to maintain interest rates unchanged, alongside the likelihood of the start of the bank’s easing cycle in September.

On the latter, CME Group’s FedWatch Tool sees the probability of a 25 bps rate cut at the September 18 meeting at nearly 50%.

It is worth noting that the Fed reiterated its openness to rate adjustments while expressing concerns about inflation and potential risks to economic stability. Additionally, the central bank hinted at a slowdown in the pace of balance sheet reduction, with Chair Jerome Powell suggesting that the next policy move is unlikely to involve a rate hike.

Looking ahead, intermittent Dollar weakness is expected to be short-lived due to deferred expectations of a potential Fed interest rate cut later in the year.

Meanwhile, the monetary policy environment remained unchanged, highlighting the contrast between the Fed and other G10 central banks, notably the European Central Bank (ECB).

Regarding the ECB, recent statements from ECB officials suggested the increasing possibility of the ECB starting its easing programme in June, leading to speculation about three interest rate cuts (equivalent to 75 basis points) for the remainder of the year. However, uncertainties persist regarding the central bank’s future decisions beyond the summer.

Looking forward, the relatively subdued economic fundamentals in the Eurozone, combined with the resilience of the US economy, support expectations for a stronger Dollar in the medium term, particularly considering the increasing likelihood of the ECB cutting rates well before the Fed.

Given this perspective, further weakness in EUR/USD should be viewed as a potential outcome in the medium term.

EUR/USD daily chart

EUR/USD short-term technical outlook

On the upside, EUR/USD is projected to face first resistance at the May high of 1.0812 (May 3), which comes before the intermediate 100-day SMA of 1.0834 and the April top of 1.0885 (April 9). North of here is the March peak of 1.0981 (March 8), prior to the weekly high of 1.0998 (January 11), all before reaching the psychological threshold of 1.1000.

Looking south, a break of the 2024 bottom of 1.0601 (April 16) might indicate a return to the November 2023 low of 1.0516 (November 1). Once this region is cleared, spot might dispute the weekly low of 1.0495 (October 13, 2023) ahead of the 2023 bottom of 1.0448 (October 3) and the round milestone of 1.0400.

The 4-hour chart shows the pair entering some consolidative range. Against that, there is an immediate up-barrier at 1.0812, seconded by 1.0885. Meanwhile, 1.0735 offers early support, ahead of 1.0649 and 1.0601. The relative strength index (RSI) lost momentum and receded to the sub-50 zone.

Source link

8 05, 2024

Bears add, looking for sub-1.0700 levels

By |2024-05-08T20:08:24+03:00May 8, 2024|Forex News, News|0 Comments

You have reached your limit of 5 free articles for this month.

Get Premium without limits for only $9.99 for the first month

Access all our articles, insights, and analysts.

Your coupon code


UNLOCK OFFER

EUR/USD Current price: 1.0746

  • Federal Reserve’s speakers in the spotlight in the absence of relevant data.
  • European Central Bank officials continue to anticipate a potential rate cut in June.
  • EUR/USD trades within limited intraday ranges, but lower lows suggest mounting selling interest.

Financial markets have shown little signs of life these days, with the EUR/USD pair still stuck around the 1.0750 mark. The hawkish tone of the Federal Reserve (Fed) was far from a surprise, but it seems speculative interest finally reconciled itself with the idea of higher for longer interest rates and was left clueless. And it is not just the Fed. Give or take, most major central banks had drawn a clear path in which loosening the monetary policy would have to wait until they gained enough confidence on inflation moving towards their goals.

The European Central Bank (ECB) may be the most notorious exception, as ECB officials have been paving the way for a June rate cut amid concerns the tight monetary policy will result in a steep economic setback. Ahead of the June meeting, however, macroeconomic data suggest the economy is doing better. Would the ECB step back from its dovish stance? That could be an interesting scenario moving forward, as trimming rates before the Fed will mean a sharp depreciation of the Euro. But it may be too early to discuss that. It’s, however, relevant as it translates to absent directional strength.

The ECB had a Non-Monetary Policy Meeting early on Wednesday, while Germany published March Industrial Production, which fell 0.4% YoY, better than the 0.6% slide anticipated by market participants. The American session will bring the United States (US) March Wholesale Inventories and several speeches from Fed officials.

EUR/USD short-term technical outlook

The EUR/USD pair is biased lower, although the momentum is absent. It has traded within tight ranges for the last three days, posting lower lows and lower highs, which usually indicate mounting selling pressure. Still, technical indicators gave no clear directional clues. A bearish 200 Simple Moving Average (SMA) provides dynamic resistance around 1.0795, while the 100 SMA also heads marginally lower above it. The 20 SMA, in the meantime, stands below the current level, losing its previously downward strength. At the same time, technical indicators remain above their midlines but without signalling any dominant interest.

In the near term, and according to the 4-hour chart, EUR/USD is neutral-to-bearish. The price is stuck around a flat 200 SMA, while the 20 SMA also lacks directional strength yet above the current level. Technical indicators, in the meantime, head nowhere just below their midlines. The pair would need to run past 1.0810 to shrug off the negative stance, while an acceleration through 1.0700 should open the door for a test of the 1.0660 price zone.

Support levels: 1.0700 1.0660 1.0620

Resistance levels: 1.0810 1.0840 1.0885 

EUR/USD Current price: 1.0746

  • Federal Reserve’s speakers in the spotlight in the absence of relevant data.
  • European Central Bank officials continue to anticipate a potential rate cut in June.
  • EUR/USD trades within limited intraday ranges, but lower lows suggest mounting selling interest.

Financial markets have shown little signs of life these days, with the EUR/USD pair still stuck around the 1.0750 mark. The hawkish tone of the Federal Reserve (Fed) was far from a surprise, but it seems speculative interest finally reconciled itself with the idea of higher for longer interest rates and was left clueless. And it is not just the Fed. Give or take, most major central banks had drawn a clear path in which loosening the monetary policy would have to wait until they gained enough confidence on inflation moving towards their goals.

The European Central Bank (ECB) may be the most notorious exception, as ECB officials have been paving the way for a June rate cut amid concerns the tight monetary policy will result in a steep economic setback. Ahead of the June meeting, however, macroeconomic data suggest the economy is doing better. Would the ECB step back from its dovish stance? That could be an interesting scenario moving forward, as trimming rates before the Fed will mean a sharp depreciation of the Euro. But it may be too early to discuss that. It’s, however, relevant as it translates to absent directional strength.

The ECB had a Non-Monetary Policy Meeting early on Wednesday, while Germany published March Industrial Production, which fell 0.4% YoY, better than the 0.6% slide anticipated by market participants. The American session will bring the United States (US) March Wholesale Inventories and several speeches from Fed officials.

EUR/USD short-term technical outlook

The EUR/USD pair is biased lower, although the momentum is absent. It has traded within tight ranges for the last three days, posting lower lows and lower highs, which usually indicate mounting selling pressure. Still, technical indicators gave no clear directional clues. A bearish 200 Simple Moving Average (SMA) provides dynamic resistance around 1.0795, while the 100 SMA also heads marginally lower above it. The 20 SMA, in the meantime, stands below the current level, losing its previously downward strength. At the same time, technical indicators remain above their midlines but without signalling any dominant interest.

In the near term, and according to the 4-hour chart, EUR/USD is neutral-to-bearish. The price is stuck around a flat 200 SMA, while the 20 SMA also lacks directional strength yet above the current level. Technical indicators, in the meantime, head nowhere just below their midlines. The pair would need to run past 1.0810 to shrug off the negative stance, while an acceleration through 1.0700 should open the door for a test of the 1.0660 price zone.

Support levels: 1.0700 1.0660 1.0620

Resistance levels: 1.0810 1.0840 1.0885 

Source link

Go to Top