The main tag of Forex News Today Articles.
You can use the search box below to find what you need.
[wd_asp id=1]

9 04, 2026

Pound Sterling to Dollar Forecast: GBP’s “Sentiment-driven Gains” see 1% Rally

By |2026-04-09T12:57:56+02:00April 9, 2026|Forex News, News|0 Comments


– Written by

The Pound to Dollar exchange rate (GBP/USD) surged above 1.3400 after a ceasefire agreement in the US-Iran conflict triggered a sharp drop in oil prices and a rebound in global risk appetite.

While the weaker dollar has boosted Sterling in the short term, analysts warn that uncertainty remains high and gains could face resistance near the 1.35 level.

GBP/USD Forecasts: Jump Above 1.3400

The Pound to Dollar (GBP/USD) exchange rate jumped above the 1.3400 level in Asia on Wednesday following the announcement of a ceasefire in the US-Iran conflict.

Just ahead of President Trump’s deadline, a deal brokered by Pakistan secured a 2-week ceasefire. In return, Iran pledged to allow transit to resume through the Strait of Hormuz.

Oil prices dropped sharply and there was a surge in risk appetite with a 2.0% gain for the FTSE 100 index while the dollar posted sharp losses with the dollar index (DXY) around 98.80 from close to 100 on Tuesday.

A dip in energy prices and a decline in bond yields will alleviate pressure on the UK economy, although both metrics are worse than before the conflict started.

Save on Your GBP/USD Transfer

Get better rates and lower fees on your next international money transfer.
Compare TorFX with top UK banks in seconds and see how much you could save.


Compare the Best GBP/USD Rates »

UoB commented; “While the short-term rally appears overdone, there is scope for GBP to rise to 1.3480.” There is also likely to be tough resistance on any approach to the 1.3500 area.

ING noted the importance of energy prices; “Risk assets are rallying as combatants in Iran pull back from the brink. The most impactful news overnight has been Iran’s announcement that it will allow safe passage for traffic through the Strait of Hormuz during this ceasefire.”

MUFG commented; “There are a lot of uncertainties that will persist but having said that, this of course is a step in the right direction and we see this as reducing considerably, over the short-term at least, the risk of a major risk-off and with it a strengthening of the dollar.

It added; “This outcome is a clear bearish outcome for the US dollar.”

According to National Australia Bank head of FX strategy Ray Attrill; “If the strategic waterway is reopened, we could be able to consolidate the risk-on rally that we’re seeing.”

He added; “But a lot has to happen in the next 14 days. Markets still need to proceed with a degree of scepticism.”

ING commented on the dollar; DXY rallied just over 3% through March. It has gapped lower today, and a further sell-off to 98.50 looks possible. However, there remains too much uncertainty to expect a full unwind of the March rally, and it is therefore premature to call for a break under 98.00.”

Rabobank noted the wide range of potential outcomes; “In terms of our macro and market scenarios, the latest news leans towards our base case of fighting being over by mid-April with a slow Hormuz reopening – and on US terms. Obviously, if this pause instead leads to more fighting, we move towards our other, more damaging scenarios.”

ING added; “Don’t expect a complete reversal of March trends, however.”

Like this piece? Please share with your friends and colleagues:


International Money Transfer? Ask our resident FX expert a money transfer question or try John’s new, free, no-obligation personal service! ,where he helps every step of the way,
ensuring you get the best exchange rates on your currency requirements.

TAGS: Pound Dollar Forecasts

Source link

9 04, 2026

USD/JPY Price Forecast: Symmetrical Triangle breakdown below 159.00 warrants more downside

By |2026-04-09T08:57:07+02:00April 9, 2026|Forex News, News|0 Comments

The USD/JPY pair trades 0.9% lower to near 158.20 during the European trading session on Wednesday. The pair faces intense selling pressure as the US Dollar (USD) underperforms across the board, following the announcement of a two-week ceasefire between the United States (US) and Iran.

US Dollar Price Today

The table below shows the percentage change of US Dollar (USD) against listed major currencies today. US Dollar was the weakest against the New Zealand Dollar.

USD EUR GBP JPY CAD AUD NZD CHF
USD -0.84% -0.96% -0.89% -0.28% -1.22% -1.62% -1.27%
EUR 0.84% -0.14% -0.06% 0.55% -0.36% -0.82% -0.45%
GBP 0.96% 0.14% 0.06% 0.70% -0.21% -0.66% -0.31%
JPY 0.89% 0.06% -0.06% 0.61% -0.30% -0.72% -0.38%
CAD 0.28% -0.55% -0.70% -0.61% -0.91% -1.32% -0.99%
AUD 1.22% 0.36% 0.21% 0.30% 0.91% -0.42% -0.09%
NZD 1.62% 0.82% 0.66% 0.72% 1.32% 0.42% 0.34%
CHF 1.27% 0.45% 0.31% 0.38% 0.99% 0.09% -0.34%

The heat map shows percentage changes of major currencies against each other. The base currency is picked from the left column, while the quote currency is picked from the top row. For example, if you pick the US Dollar from the left column and move along the horizontal line to the Japanese Yen, the percentage change displayed in the box will represent USD (base)/JPY (quote).

As of writing, the US Dollar Index (DXY), which tracks the Greenback’s value against six major currencies, is down 0.75% to near 98.75.

Earlier in the day, US President Donald Trump announced that he had suspended planned attacks on Iranian civilian infrastructure for two weeks, as Tehran agreed to the reopening of the Strait of Hormuz, a passage to almost 20% of global energy supply.

Meanwhile, disappeared hawkish Federal Reserve (Fed) bets due to anchoring global inflation expectations, following a temporary truce between the US and Iran, have also weighed on the US Dollar.

According to the CME FedWatch tool, traders have priced out hopes of an interest rate hike this year, a sharp turnaround from expectations of two hikes built after the war started.

USD/JPY technical analysis

USD/JPY plummets to near 158.20 during the day. The near-term trend of the pair has turned bearish, following a breakdown of the Symmetrical Triangle formation on a four-hour timeframe. Price now holds below the broken ascending support line from 157.46, reinforcing the loss of upside structure, while the 200-period EMA near 158.40 caps intraday rebounds as dynamic resistance.

The 14-day Relative Strength Index (RSI) has dropped to 28, entering oversold territory and signaling strong bearish momentum, though stretched conditions could slow immediate downside extension.

Initial resistance emerges at the confluence of the 200-period EMA and former support trend-line area around 158.40, with the descending trend line adding another barrier closer to 159.00. A recovery through 159.00 would open 159.60 as the next resistance band and neutralize the current downside pressure.

On the downside, minor support is seen at 157.50, and a clear break below this would confirm a deeper bearish phase toward 157.00. Oversold RSI suggests that any bounce into 158.40–159.00 is likely to be treated as a selling area while price holds below the descending trend line.

(The technical analysis of this story was written with the help of an AI tool.)

Risk sentiment FAQs

In the world of financial jargon the two widely used terms “risk-on” and “risk off” refer to the level of risk that investors are willing to stomach during the period referenced. In a “risk-on” market, investors are optimistic about the future and more willing to buy risky assets. In a “risk-off” market investors start to ‘play it safe’ because they are worried about the future, and therefore buy less risky assets that are more certain of bringing a return, even if it is relatively modest.

Typically, during periods of “risk-on”, stock markets will rise, most commodities – except Gold – will also gain in value, since they benefit from a positive growth outlook. The currencies of nations that are heavy commodity exporters strengthen because of increased demand, and Cryptocurrencies rise. In a “risk-off” market, Bonds go up – especially major government Bonds – Gold shines, and safe-haven currencies such as the Japanese Yen, Swiss Franc and US Dollar all benefit.

The Australian Dollar (AUD), the Canadian Dollar (CAD), the New Zealand Dollar (NZD) and minor FX like the Ruble (RUB) and the South African Rand (ZAR), all tend to rise in markets that are “risk-on”. This is because the economies of these currencies are heavily reliant on commodity exports for growth, and commodities tend to rise in price during risk-on periods. This is because investors foresee greater demand for raw materials in the future due to heightened economic activity.

The major currencies that tend to rise during periods of “risk-off” are the US Dollar (USD), the Japanese Yen (JPY) and the Swiss Franc (CHF). The US Dollar, because it is the world’s reserve currency, and because in times of crisis investors buy US government debt, which is seen as safe because the largest economy in the world is unlikely to default. The Yen, from increased demand for Japanese government bonds, because a high proportion are held by domestic investors who are unlikely to dump them – even in a crisis. The Swiss Franc, because strict Swiss banking laws offer investors enhanced capital protection.

Source link

9 04, 2026

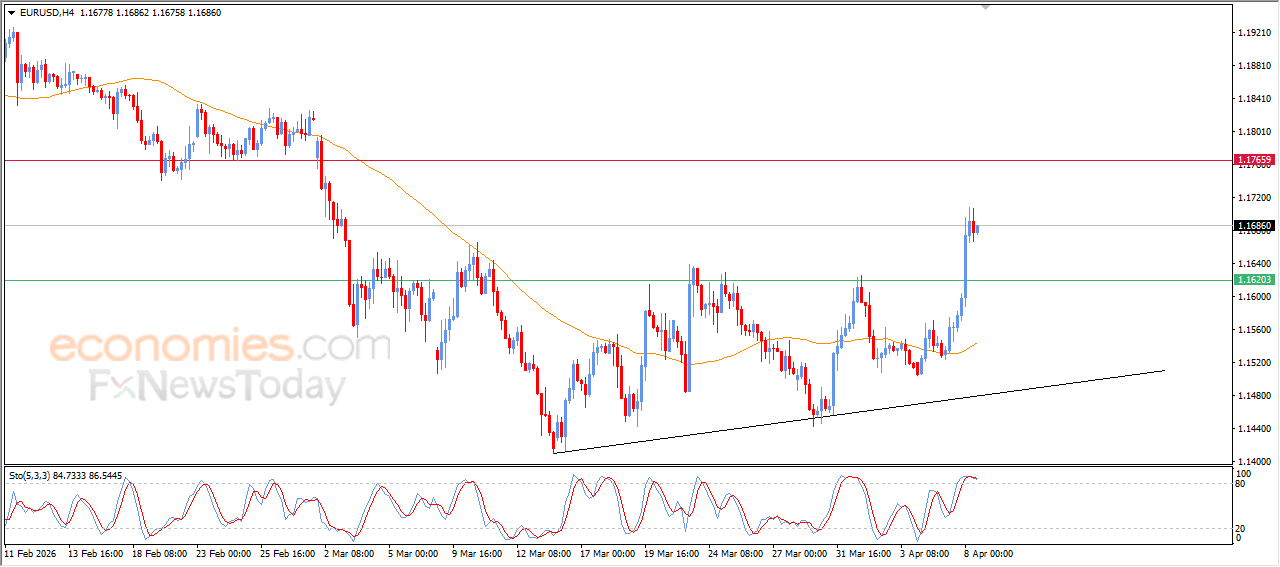
Forecast update for EURUSD -08-04-2026.

By |2026-04-09T04:56:04+02:00April 9, 2026|Forex News, News|0 Comments

The EURJPY pair renewed the positive attempts since yesterday, due to the continuation of providing positive momentum by the main indicators by its rally above the initial resistance at 184.80, to test the barrier at 185.45 to bounce directly to settle near 184.90.


The price might be forced to provide mixed trading by its stability below 184.45, and there is a chance for forming bearish waves to target 184.20 and 183.70 level, while its success to surpass the barrier at 185.45 will open the way for forming strong bullish waves, to expect reaching 186.00 initially, reaching 186.65.


The expected trading range for today is between 184.40 and 185.45


Trend forecast: Fluctuated


Source link

9 04, 2026

The EURJPY attempts to recover the positivity– Forecast today – 8-4-2026

By |2026-04-09T00:55:09+02:00April 9, 2026|Forex News, News|0 Comments

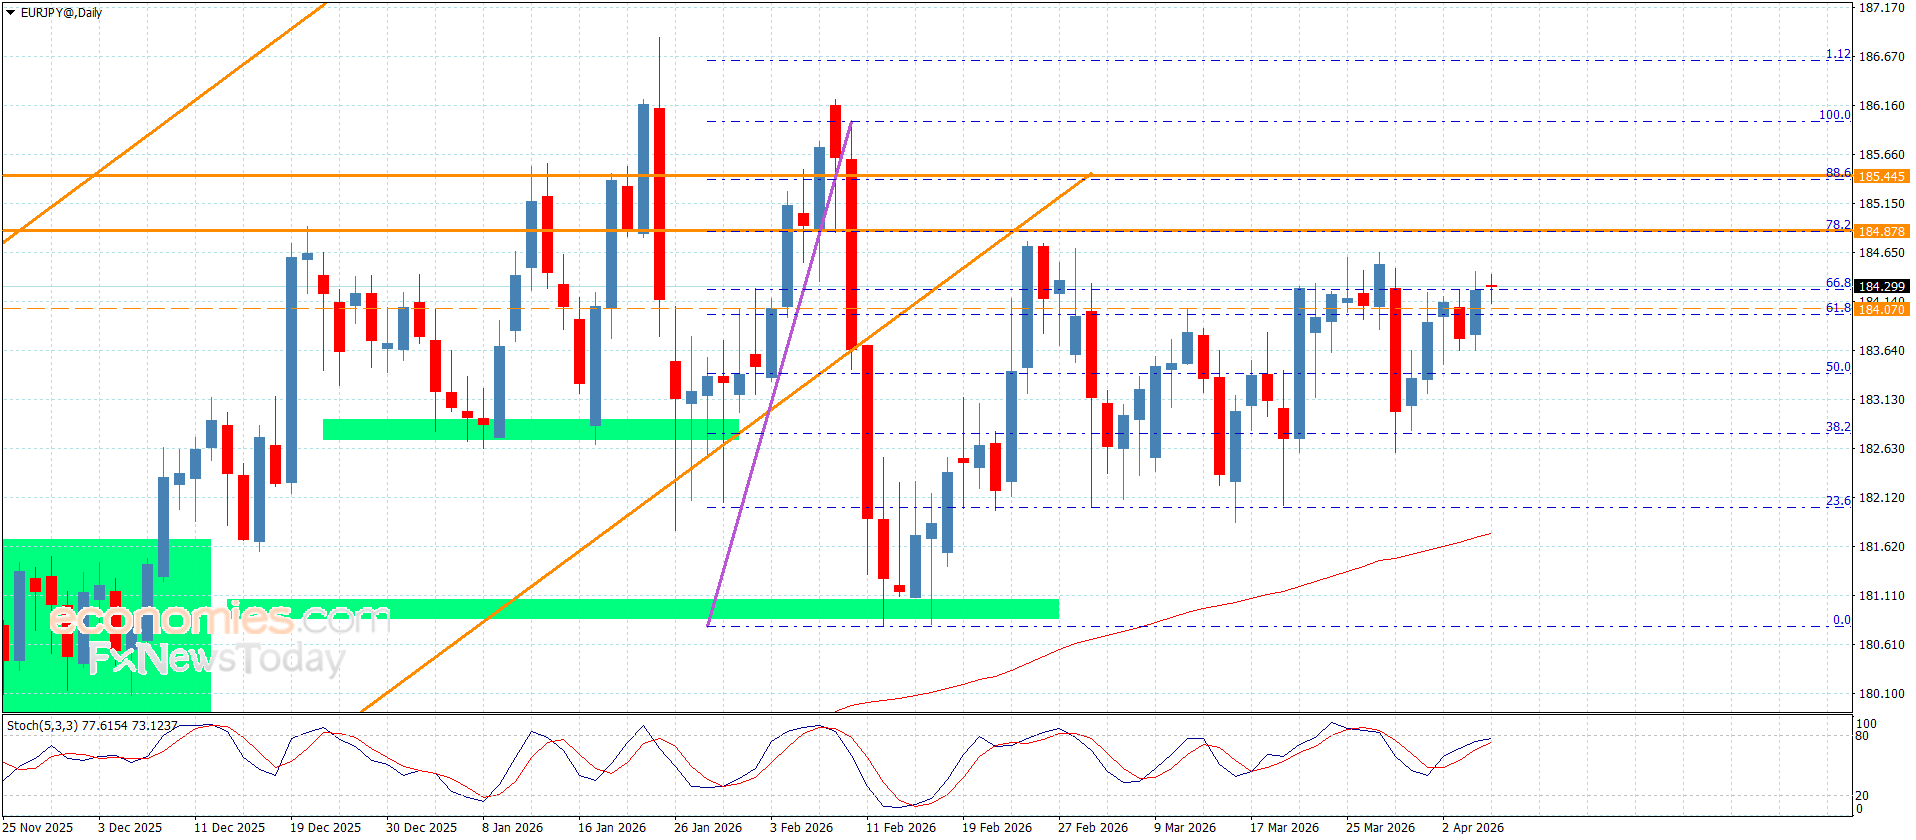
The EURJPY pair renewed the positive attempts since yesterday, due to the continuation of providing positive momentum by the main indicators by its rally above the initial resistance at 184.80, to test the barrier at 185.45 to bounce directly to settle near 184.90.


The price might be forced to provide mixed trading by its stability below 184.45, and there is a chance for forming bearish waves to target 184.20 and 183.70 level, while its success to surpass the barrier at 185.45 will open the way for forming strong bullish waves, to expect reaching 186.00 initially, reaching 186.65.


The expected trading range for today is between 184.40 and 185.45


Trend forecast: Fluctuated


Source link

8 04, 2026

EUR/JPY Price Forecast: Trades near 185.00 after pulling back from upper channel boundary

By |2026-04-08T20:54:17+02:00April 8, 2026|Forex News, News|0 Comments

EUR/JPY edges lower after two days of gains, trading around 185.00 during the European hours on Wednesday. The technical analysis of the daily chart suggests the currency cross is moving upwards within the ascending channel pattern, indicating bullish bias.

The near-term bias stays mildly bullish as the EUR/JPY cross holds comfortably above the 50-day Exponential Moving Average (EMA), while the nine-day EMA rises above the medium-term average, reinforcing a short-term uptrend within an established broader advance.

Momentum backs this tone, with the Relative Strength Index (RSI) around 59, holding above the 50 line and confirming persistent buying pressure rather than overbought excess.

The EUR/JPY cross may retest the immediate resistance at the upper ascending channel boundary around 185.70. Further advances above the channel would reinforce the bullish bias and lead the EUR/JPY cross to explore the region around the all-time high of 186.88, reached on January 23.

On the downside, the initial support lies at the nine-day EMA of 184.33. A break below the short-term average would weaken the bullish bias and lead the EUR/JPY cross to test the 50-day EMA at 183.58, followed by the lower boundary of the ascending channel around 183.00.

EUR/JPY: Daily Chart

(The technical analysis of this story was written with the help of an AI tool.)

Euro Price Today

The table below shows the percentage change of Euro (EUR) against listed major currencies today. Euro was the weakest against the New Zealand Dollar.

USD EUR GBP JPY CAD AUD NZD CHF
USD -0.78% -1.06% -0.82% -0.14% -1.05% -1.52% -1.15%
EUR 0.78% -0.30% -0.04% 0.63% -0.28% -0.78% -0.39%
GBP 1.06% 0.30% 0.26% 0.93% 0.04% -0.46% -0.09%
JPY 0.82% 0.04% -0.26% 0.68% -0.20% -0.69% -0.32%
CAD 0.14% -0.63% -0.93% -0.68% -0.88% -1.35% -1.01%
AUD 1.05% 0.28% -0.04% 0.20% 0.88% -0.49% -0.13%
NZD 1.52% 0.78% 0.46% 0.69% 1.35% 0.49% 0.36%
CHF 1.15% 0.39% 0.09% 0.32% 1.01% 0.13% -0.36%

The heat map shows percentage changes of major currencies against each other. The base currency is picked from the left column, while the quote currency is picked from the top row. For example, if you pick the Euro from the left column and move along the horizontal line to the US Dollar, the percentage change displayed in the box will represent EUR (base)/USD (quote).

Source link

8 04, 2026

Pound-to-Euro Week Ahead Forecast: Best GBP Levels in Play

By |2026-04-08T16:53:18+02:00April 8, 2026|Forex News, News|0 Comments


– Written by

The Pound to Euro exchange rate (GBP/EUR) climbed above 1.1550 to one-month highs as shifting Bank of England rate expectations and position adjustments supported Sterling despite heightened geopolitical tensions.

Rising energy prices following escalating conflict in the Middle East have complicated central-bank policy expectations, prompting markets to reconsider the timing of Bank of England rate cuts while the Euro faces pressure from Europe’s dependence on energy imports.

GBP/EUR Forecasts: BoE rethink?

After initial vulnerability, UBS expects that the Pound to Euro (GBP/EUR) exchange rate will strengthen to 1.1630 by the first quarter of 2027.

MUFG, in contrast, still forecasts that GBP/EUR will slide to 1.11 by the end of 2026.

Middle East developments dominated during the week with a surge in energy prices as the US and Israel attacked Iran aggressively while Iran retaliated with missile strikes across the region.

GBP/EUR was broadly resilient and a break above 1.1500 triggered a 1-month high above 1.1550. There was clear evidence of position adjustment with a covering of short Pound positions while the Euro was hit by a liquidation of long positions.

Save on Your GBP/EUR Transfer

Get better rates and lower fees on your next international money transfer.
Compare TorFX with top UK banks in seconds and see how much you could save.


Compare the Best GBP/EUR Rates »

A shift in Bank of England expectations also underpinned the Pound with expectations that the Bank of England would decide not to cut rates this month due to elevated uncertainty.

Nomura has been notably bearish on the Pound, but has tempered its short-term view; “The risk now is that the market finds it relatively easy to price out BoE rate cuts, but the hurdle to pricing in meaningful rate hikes in the euro area is higher. Indeed, the two-year swap spread has moved from just under 120bp in GBP’s favour to nearly 130bp in the last few days.”

It noted; “This has overwhelmed any potential relative “safe haven” demand for EUR relative to GBP, which is often seen when global equities are under pressure.”

The bank added; “if energy prices stay elevated. In the short term, EUR may face slightly more pressure than GBP from these forces.”

UBS has a positive medium-term Pound outlook; “We expect the pound to recover in the second half of this year and into 2027—especially given its current undervaluation—as the political landscape becomes clearer after the May elections and the BoE nears the end of its easing cycle.”

Natixis sees the risk of near-term Pound selling; “In the short term, EUR/GBP could move back above 0.88 (GBP/EUR below 1.1360), especially ahead of the local elections on May 7, which risk adding another layer of political uncertainty.”

UBS does have reservations over the near-term Pound outlook; “With local and regional elections scheduled for May and monetary easing likely to continue through to June, we don’t expect sterling to outperform in the near term. Meanwhile, Europe’s recovery is gaining momentum, with increased fiscal spending in defense-related sectors starting to show.”

MUFG expects rate cuts will be delayed rather than cancelled; “We assume the BoE will hold off from a cut this month due to higher energy prices stemming from Middle East risks, before delivering two further cuts in Q2 and Q3.”

Like this piece? Please share with your friends and colleagues:


International Money Transfer? Ask our resident FX expert a money transfer question or try John’s new, free, no-obligation personal service! ,where he helps every step of the way,
ensuring you get the best exchange rates on your currency requirements.

TAGS: Pound Euro Forecasts

Source link

8 04, 2026

GBP/USD Forecast: Bulls seize control on US-Iran ceasefire news

By |2026-04-08T12:52:04+02:00April 8, 2026|Forex News, News|0 Comments

The GBP/USD pair prolongs its uptrend for the third consecutive day and rallies to over a two-week top on Wednesday, with bulls now looking to build on the momentum further beyond the 200-day Simple Moving Average (SMA). The US Dollar (USD) slumps to a nearly one-month low during the first half of the European session amid hopes for an end to the Middle East war and turns out to be a key factor acting as a tailwind for the currency pair.

US President Donald Trump announced in a post on Truth Social that he will suspend planned military strikes against Iran for two weeks. Iran also signaled a conditional willingness to de-escalate tensions, provided attacks against the country are halted. The positive development boosted investors’ sentiment, sending the safe-haven Greenback tumbling lower and assisting the GBP/USD pair in building on this week’s rise from the 1.3175 region.

Meanwhile, Iran’s Foreign Minister Seyed Abbas Araghchi wrote on X that safe passage through the Strait of Hormuz will be possible via coordination with the country’s Armed Forces and due consideration of technical limitations. Crude Oil prices crashed over 15% intraday amid optimism over the resumption of shipping traffic from the strategic waterway, easing inflation fears, and tempering expectations for more hawkish global central banks.

In fact, market bets for a rate hike by the US Federal Reserve (Fed) collapsed amid the unwinding of the inflation premium. The resultant steep decline in US Treasury bond yields further undermines the USD. Moreover, traders have sharply reduced Bank of England (BoE) rate hike bets and are now pricing in roughly 30-40 basis points (bps) of increases by the year-end. This still marks a significant divergence in comparison to the Fed and favors the GBP/USD bulls.

Market participants now look to the release of FOMC Minutes, due later during the US session. Apart from this, the US Personal Consumption Expenditures (PCE) Price Index and the US Consumer Price Index (CPI) on Thursday and Friday, respectively, will be looked upon for more cues about the Fed’s policy outlook. This, in turn, will play a key role in influencing the near-term USD price dynamics and providing some meaningful impetus to the GBP/USD pair.

GBP/USD daily chart

Technical Analysis:

The near-term bias turns mildly bullish as the GBP/USD pair holds just above the 38.2% Fibonacci retracement level of the January-March downfall. Spot prices now test the downward-sloping 200-day Simple Moving Average (SMA) at 1.3415 from above, suggesting emerging dip-buying interest around this long-term reference. Momentum improves, with the Moving Average Convergence Divergence (MACD) line crossing above its signal and edging back toward the zero line, while the Relative Strength Index (RSI) at 55 signals modest bullish momentum rather than overbought conditions.

A further move could face immediate resistance at the 50% retracement at 1.3505. A daily close above the said barrier would strengthen the bullish tone and open the way toward the 61.8% Fibo. retracement level at 1.3588. On the downside, initial support sits at the 38.2% Fibo. retracement level at 1.3422, aligned with the 200-day SMA near 1.3415, and a break below there would expose the 23.6% Fibo. retracement level at 1.3319 as the next downside level. As long as the GBP/USD pair holds above the 1.3415–1.3422 support band, the path of least resistance favors further recovery attempts toward the mid-1.3500s area.

(The technical analysis of this story was written with the help of an AI tool.)

In the daily chart, GBP/USD trades at 1.3427.

Source link

8 04, 2026

Yen Reels on Geopolitical Turmoil. Forecast as of 07.04.2026

By |2026-04-08T08:51:00+02:00April 8, 2026|Forex News, News|0 Comments

The conflict in the Middle East is pushing Japan’s economy toward stagflation and prompting foreign investors to sell Japanese stocks and bonds. The government is trying to counter the rise in the USD/JPY pair. Will it work? Let’s discuss this topic and make a trading plan.

The article covers the following subjects:

Major Takeaways

  • Foreign investors are actively selling Japanese stocks.
  • Capital outflows are hurting the yen.
  • The Bank of Japan warns of the looming stagflation.
  • Consider adding to the long trades opened at 158.5.

Weekly Fundamental Forecast for Yen

Japan emerged as a key casualty of the Middle East conflict, with the yen and related assets under heavy pressure, prompting investors to sell. Foreign investors have been accelerating those sales since September 2024. Capital outflows and rising stagflation risks are driving the USD/JPY pair higher, despite government efforts to stem the yen’s slide. The question is whether verbal intervention alone can deter speculators.

Net Foreign Purchases of Japanese Stocks

Source: Bloomberg.

The Bank of Japan stated that higher oil prices are weighing on corporate profits and consumer spending, warning that escalating tensions in the Middle East could further strain the economy. Companies are already raising prices amid higher energy costs, supply chain disruptions, and a weak yen. Meanwhile, households have cut spending for a third straight month, despite a rise in real wages.

Japan’s Household Spending

Source: Bloomberg.

Therefore, the economy is potentially moving toward stagflation, leaving the Bank of Japan with a difficult choice. Should it raise rates to contain inflation or keep policy loose to support demand? Futures markets are pricing in about a 70% chance of monetary policy tightening, which is already curbing USD/JPY bulls.

Another risk is the threat of currency intervention. The government keeps signaling it, and the dollar’s approach to the ¥160 level is making investors increasingly nervous. Japanese Finance Minister Satsuki Katayama said Donald Trump’s remarks are fueling volatility across global markets, adding that authorities are ready to respond at any time with appropriate measures.

UBS analysts doubt Japanese authorities can stop the USD/JPY pair from rising further. The bank argues that if Brent crude climbs to $150 a barrel, pressure on the yen will intensify, making FX intervention less effective. Any intervention-driven pullbacks are likely to attract fresh buyers. UBS also warns that if the government shifts toward fiscal measures to offset the impact of inflation, investors may see it as a reluctance to support the currency. In that scenario, the dollar may advance toward ¥175.

A more bearish scenario would involve a further escalation of the conflict in the Middle East. This could happen if Donald Trump does not extend the ultimatum deadline and the US moves to target Iran’s energy infrastructure. In that case, Brent could push above its March highs, putting additional pressure on the yen.

Weekly USDJPY Trading Plan

Further gains in USD/JPY may prompt currency interventions, raising the risk of a sharp pullback. This decline can be used to open new long trades or add to those initiated at 158.5.


This forecast is based on the analysis of fundamental factors, including official statements from financial institutions and regulators, various geopolitical and economic developments, and statistical data. Historical market data are also considered.

Price chart of USDJPY in real time mode

The content of this article reflects the author’s opinion and does not necessarily reflect the official position of LiteFinance broker. The material published on this page is provided for informational purposes only and should not be considered as the provision of investment advice for the purposes of Directive 2014/65/EU.


According to copyright law, this article is considered intellectual property, which includes a prohibition on copying and distributing it without consent.

Rate this article:

{{value}} ( {{count}} {{title}} )


Source link

8 04, 2026

EUR/USD Analysis Today 07/04: Return of Liquidity Restores Selling Pressure (Chart)

By |2026-04-08T04:50:03+02:00April 8, 2026|Forex News, News|0 Comments

EUR/USD Analysis Summary Today

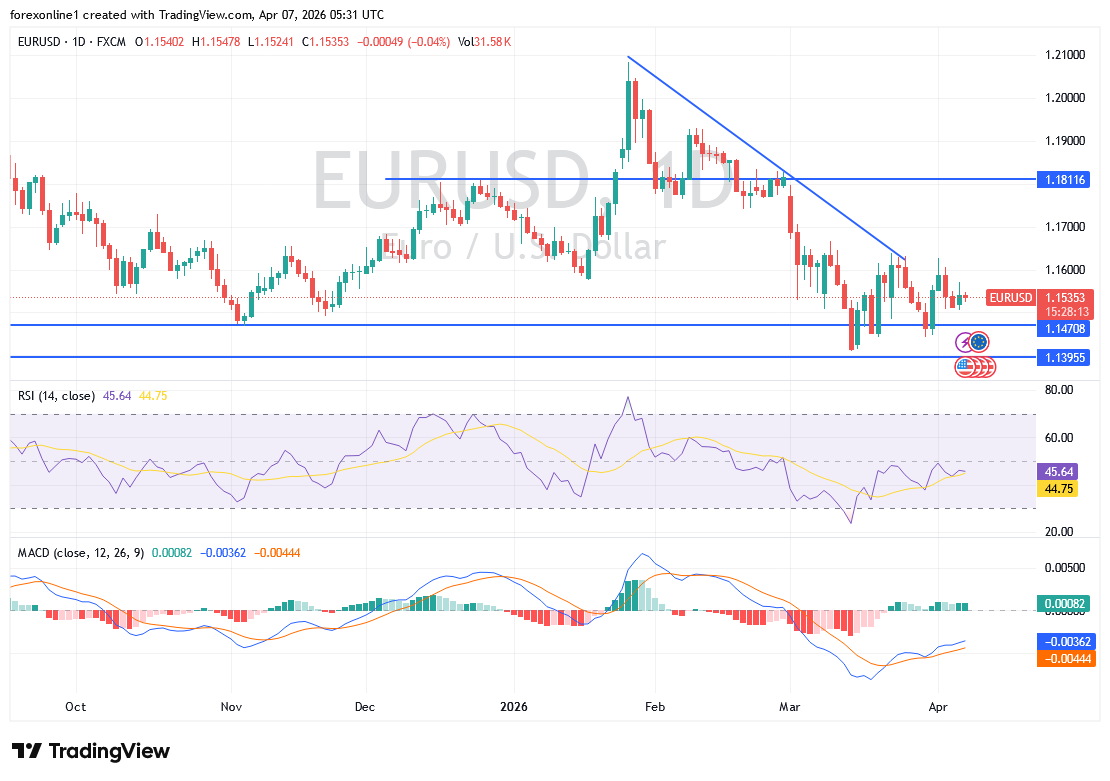
  • Overall Trend: Remains Bearish.

  • Support Levels for EUR/USD Today: 1.1510 – 1.1460 – 1.1390.

  • Resistance Levels for EUR/USD Today: : 1.1590 – 1.1630 – 1.1680.

EUR/USD Trading Signals:

Buy Scenario:

Sell Scenario:

Technical Analysis of EUR/USD Today

Following yesterday’s holiday, liquidity has returned to the markets. At the same time, risk sentiment remains fragile amid escalating tensions in the Middle East. Investors are closely monitoring developments after Donald Trump threatened to target Iranian bridges and oil facilities if the Strait of Hormuz is not reopened by Tuesday evening. This geopolitical ambiguity is keeping traders cautious and benefiting safe-haven currencies.

This situation is negative for the EUR/USD pair. It attempted a rebound, but gains were limited to the 1.1571 level, before quickly resuming its broader downward trend to the 1.1525 support level at the time of writing.

According to the technical analysis on the daily chart, breaking the 1.1500 support level reinforces the bearish bias. Technical indicators confirm this, with the 14-day Relative Strength Index (RSI) below the 50 neutral line, supporting the bears’ push for the currency pair to lower levels until the indicator reaches oversold territory. This could happen quickly if the pair falls to the 1.1400 support level, as occurred in the middle of last month’s trading. The MACD indicator and moving averages still support the strength of the downtrend in the coming days.

To break the overall bearish trend and initiate a technical upward reversal, bulls must stabilize above the 1.1640 resistance.

Fundamental Analysis EUR/USD:

The economic focus for today, Tuesday, remains on the Eurozone Investor Confidence Index (Sentix), which is expected to reflect the impact of regional conflict and energy price shocks on investor sentiment. It will be released at 10:30 AM Egypt time. Prior to that, the Eurozone Services Purchasing Managers’ Index (PMI) readings will be released. However, given the weak liquidity and general geopolitical concerns, this indicator is unlikely to generate a significant market reaction.

On the US side, the durable goods orders reading will be released at 2:30 PM Egypt time.

From a monetary policy perspective, this pair reflects the ongoing divergence between the European Central Bank (ECB) and the US Federal Reserve. Inflationary pressures in the Eurozone have prompted ECB officials to hint at a possible interest rate hike, which strengthens the euro. Meanwhile, the US Federal Reserve Chairman has indicated that the bank is continuously monitoring the impact of rising oil prices on inflation and will either tighten or wait at the appropriate time. Overall, this divergence in monetary policy expectations continues to influence the exchange rate of this currency pair.

Trading Advice:

Dear TradersUp trader, the Euro will remain under constant pressure as long as the conflict in the Middle East persists and oil prices continue to rise, which negatively impacts the Eurozone

Ready to trade our Forex daily forecast? We’ve shortlisted the best regulated forex brokers UK in the industry for you.

Source link

8 04, 2026

The EURJPY without any news– Forecast today – 7-4-2026

By |2026-04-08T00:49:00+02:00April 8, 2026|Forex News, News|0 Comments

No news for EURJPY pair until this moment, affected by the positivity of the main indicators, which forces it to delay the bearish attack and keep forming bullish corrective waves, to settle near 184.30.


Reminding you that the negative scenario will remain valid, depending on the stability of the initial resistance at 184.80, which makes us wait for gathering negative momentum to motivate it to target the negative stations by reaching 183.10 followed by 182.20.


The expected trading range for today is between 183.30 and 184.55


Trend forecast: Fluctuating within the bearish track


Source link

Go to Top