The main tag of Gold Price Articles.
You can use the search box below to find what you need.
[wd_asp id=1]
The main tag of Gold Price Articles.
You can use the search box below to find what you need.
[wd_asp id=1]
Gold price is nursing weekly losses early Friday, with fresh downside risks emerging ahead of the US Personal Consumption Expenditures (PCE) Price Index data release.
As the US Dollar (USD) consolidates its overnight rebound from over three-year highs, Gold price challenges a critical daily support line.
Traders refrain from placing any directional positions in the Greenback and Gold price before the release of the Fed’s preferred inflation measure, the core PCE Price Index, due later this Friday.
Markets are expecting the annual core PCE Price Index to advance by 2.3% in May, following a 2.1% growth in April, while on a monthly basis, the gauge is seen rising 0.1% in May, at the same pace as in April.
Hotter-than-expected core PCE readings could re-kindle expectations of the US Federal Reserve (Fed) lowering interest rates as early as July.
Markets are currently pricing in a 21% chance of a July Fed rate cut, while for a September reduction, the odds stand at 75%, the CME Group’s Fed WatchTool showed.
Therefore, the data will hold key to determining the timing of the next Fed rate cut, significantly impacting the USD-denominated and non-yielding Gold price.
The USD experienced good two-way businesses, falling to the lowest level since March 2022, following the Wall Street Journal (WSJ) report that US President Trump is considering selecting and announcing a successor for Fed Chair Jerome Powell earlier by September or October.
Markets speculated that Trump’s attack threatening the Fed’s credibility could lead to the selection of a dovish successor, a so-called ‘lame duck’. This narrative weighed heavily on the buck.
However, the Greenback found its feet after a person familiar with the White House’s deliberations told Reuters on Thursday, “Trump has not decided on a replacement for Powell and a decision is not imminent.”
Further, hopes of US trade deals with the European Union (EU) and China before the July 9 deadline helped the US Dollar recover earlier losses.
A WSJ report cited late Thursday that EU officials are weighing lowering tariffs on US imports to woo Trump.
Meanwhile, a White House official said that the US has reached an understanding with China on how to expedite rare earth shipments to the US.
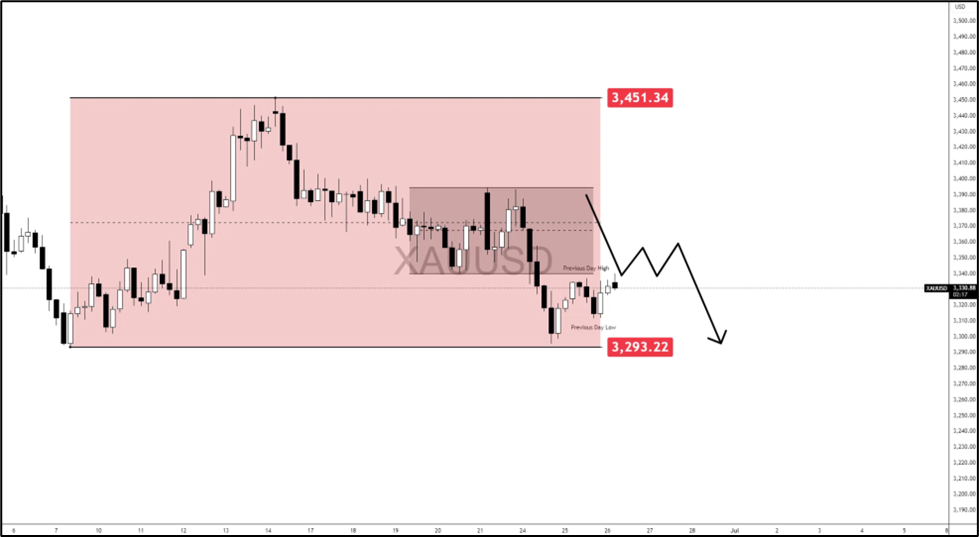
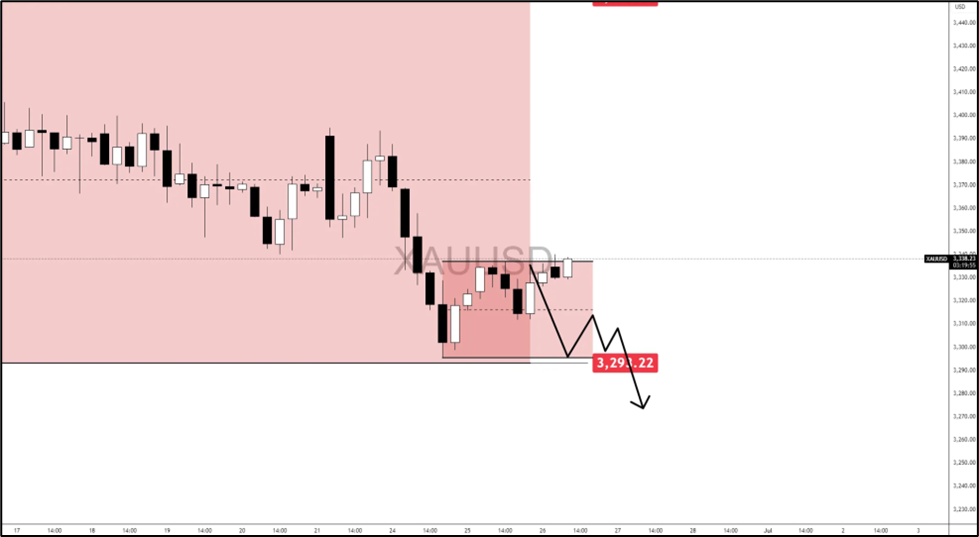
Having defended the strong support of the 50-day Simple Moving Average (SMA) at $3,325 so far this week, Gold price is yet again testing bids below that level at the press time.
The 14-day Relative Strength Index (RSI) is pointing south below the midline, currently trading near 46, suggesting that downside potential remains in place.
A weekly closing below the 50-day SMA support could validate a fresh downtrend, with the door opening for a test of the 50% Fibonacci Retracement (Fibo) level of the April record rally at $3,232.
Ahead of that, the $3,295 demand area will be retested, which is the intersection of the weekly low and the 38.2% Fibo level of the same ascent.
On the flip side, the immediate resistance is seen at the 50-day SMA, above which the 21-day SMA hurdle at $3,354 will be put to test.
Recapturing the 21-day SMA is critical for resuming the recovery from two-week troughs.
The next upside hurdle is aligned at the 23.6% Fibo level at $3,377.
Gold buyers will then target the $3,400 threshold once the 23.6% Fibo resistance is decisively taken out.
The Core Personal Consumption Expenditures (PCE), released by the US Bureau of Economic Analysis on a monthly basis, measures the changes in the prices of goods and services purchased by consumers in the United States (US). The PCE Price Index is also the Federal Reserve’s (Fed) preferred gauge of inflation. The YoY reading compares the prices of goods in the reference month to the same month a year earlier. The core reading excludes the so-called more volatile food and energy components to give a more accurate measurement of price pressures.” Generally, a high reading is bullish for the US Dollar (USD), while a low reading is bearish.
Silver price turns flat as Friday’s Asian session begins, trades near $36.60, virtually unchanged, compared to Thursday’s June 26 daily close. The XAG/USD appears poised to close the week with gains of over 1.80%.
Silver remains upward biased as Friday’s Asian session begins, posting back-to-back bullish days, which pushed the grey metal towards a weekly high of $36.83. XAG/USD has achieved a successive series of higher highs and higher lows, hinting that the grey metal is headed upwards.
The Relative Strength Index (RSI) turned flatlines after edging higher for three consecutive days, in bullish territory. This indicates that buyers are taking a respite ahead of testing higher prices.
If XAG/USD climbs past $37.00, look for the next resistance at the yearly peak of $37.31. A breach of the latter will expose the $38.00 figure. Conversely, if Silver slides below $36.50, expect a test of $36.00. Further downside lies in the June 24 daily low of $35.68, followed by the latest cycle low of $35.29.
Silver is a precious metal highly traded among investors. It has been historically used as a store of value and a medium of exchange. Although less popular than Gold, traders may turn to Silver to diversify their investment portfolio, for its intrinsic value or as a potential hedge during high-inflation periods. Investors can buy physical Silver, in coins or in bars, or trade it through vehicles such as Exchange Traded Funds, which track its price on international markets.
Silver prices can move due to a wide range of factors. Geopolitical instability or fears of a deep recession can make Silver price escalate due to its safe-haven status, although to a lesser extent than Gold’s. As a yieldless asset, Silver tends to rise with lower interest rates. Its moves also depend on how the US Dollar (USD) behaves as the asset is priced in dollars (XAG/USD). A strong Dollar tends to keep the price of Silver at bay, whereas a weaker Dollar is likely to propel prices up. Other factors such as investment demand, mining supply – Silver is much more abundant than Gold – and recycling rates can also affect prices.
Silver is widely used in industry, particularly in sectors such as electronics or solar energy, as it has one of the highest electric conductivity of all metals – more than Copper and Gold. A surge in demand can increase prices, while a decline tends to lower them. Dynamics in the US, Chinese and Indian economies can also contribute to price swings: for the US and particularly China, their big industrial sectors use Silver in various processes; in India, consumers’ demand for the precious metal for jewellery also plays a key role in setting prices.
Silver prices tend to follow Gold’s moves. When Gold prices rise, Silver typically follows suit, as their status as safe-haven assets is similar. The Gold/Silver ratio, which shows the number of ounces of Silver needed to equal the value of one ounce of Gold, may help to determine the relative valuation between both metals. Some investors may consider a high ratio as an indicator that Silver is undervalued, or Gold is overvalued. On the contrary, a low ratio might suggest that Gold is undervalued relative to Silver.
There were a couple other signs of strength today to be aware of. At the time of this writing, trading continues in the upper half of the day’s range. Therefore, the day may end with natural gas in a similar position. That would set up a bullish hammer candlestick pattern. Although it didn’t form at the bottom of the trend, it is close. Also, today’s high was $3.60, slightly above Wednesday’s high of $3.59. This shows strength and is a sign that buyers are moving back into the market.
Of course, the 200-Day MA represents potentially significant dynamic long-term trend support. It was tested twice recently. Once during the decline in April and again in May. Notice that that first approach fell further below the line and for more days than the second test. In both instances, the bullish recovery came quickly, once it started. If yesterday’s low turns into a swing low, it will show strength relative to the two prior declines to the 200-Day line.
A bull breakout will be indicated on a decisive rally above today’s high of $3.60. Near term support is at the 50-Day MA and the low for today, which is $3.40. An area of potential resistance is at the 20-Day MA, now at $3.65, and Tuesday’s high of $3.68. Further strengthening would change the slope of the rising trend channel as currently identified in green. The midline of the channel would be a first target zone if the bulls can retain control.
For a look at all of today’s economic events, check out our economic calendar.
Spot Gold advanced throughout the first half of Thursday, meeting buyers in the $3,350 region. It quickly returned to its recent comfort zone around $3,320-30, where it stays in the American session, despite broad US Dollar (USD) weakness.
Market players paid no attention to the safe-haven metal, as the focus shifted to potential interest rate cuts in the United States (US). President Donald Trump criticised Federal Reserve (Fed) Chairman Jerome Powell and claimed he is already studying his replacement, despite Powell’s mandate ending in May 2026.
US President Trump has long urged Chair Powell to trim interest rates. “We have no inflation. We have a tremendous economy. Hundreds of billions of dollars of tariff money is pouring in. Factories are being built,” he said in a press conference following the NATO Heads of State and Government Summit in the Netherlands. He then added he doubts about Powell’s mental abilities and called him names.
The USD plunged while stocks rallied amid speculation the Fed would end up trimming rates before previously anticipated.
Mixed US data did not help the Greenback. The country reported that Durable Goods Orders rose 16.4% in May, much better than the -6.6% posted in April. The Q1 Gross Domestic Product (GDP) was confirmed at -0.5% in the first quarter of the year, worse than the preliminary estimate of -0.2%.
Additionally, Initial Jobless Claims rose by 236K in the week ended June 21, beating expectations. Finally, the Goods Trade Balance posted a deficit of $96.6 billion in May, worse than the -$88.5 billion expected.
On Friday, the US will release the May Personal Consumption Expenditures (PCE) Price Index, foreseen stable on a monthly basis, albeit marginally higher on a yearly one.
From a technical point of view, the risk skews to the downside for Gold, although the downward momentum remains limited. The daily chart shows that XAU/USD met sellers around a flat 20 Simple Moving Average (SMA) at $3,355.80, while holding well above bullish 100 and 200 SMAs. Technical indicators, in the meantime, seesaw around their midlines without clear directional strength.
In the near term, and according to the 4-hour chart, the XAU/USD pair remains below its 20 and 100 SMAs, but holds above a directionless 200 SMA, with slides below the latter being quickly reverted. Technical indicators turned higher, but with the Momentum indicator within neutral levels and the Relative Strength Index (RSI) indicator at around 45, falling short of anticipating another leg north.
Support levels: 3,311.90 3,295.45 3,279.2
Resistance levels: 3,355.80 3,374.45 3,389.40
The political backdrop has added volatility.
Recent remarks from former President Donald Trump have raised questions about the tenure of Fed Chair Jerome Powell. Trump’s comments suggested a potential leadership change at the central bank by September, casting doubt on the Fed’s policy independence. Although Powell reiterated a data-driven stance during congressional testimony, market participants viewed the political rhetoric as a possible signal of future easing.
This combination of declining yields, a weaker dollar, and institutional uncertainty continues to support precious metals, though gains in both gold and silver remain measured pending further economic data.
Still, the gold rally has remained contained, with resistance evident near the $3,345–$3,360 zone. A ceasefire between Middle Eastern powers has calmed geopolitical concerns, fueling a mild recovery in equities and limiting demand for safe-haven flows into bullion. Silver similarly faces resistance near $36.42, with traders cautious ahead of key macroeconomic releases.
Investor attention now turns to a batch of U.S. economic data, including jobless claims, durable goods orders, and final Q1 GDP figures. However, the core focus is Friday’s release of the Personal Consumption Expenditures (PCE) Price Index—a critical inflation metric for the Fed.
A softer print could reinforce the case for monetary easing and push gold higher, while a hotter number might stall the current uptrend. Gold and silver remain range-bound for now, but policy clarity and inflation data could define their next move.
The GBPCHF affected by stochastic rally to the overbought level, forming some bullish correctional waves, recording 1.1015 level, but the main stability within the bearish channel’s levels, which represents 1.1055 level for the extension of the extra main resistance for the stability of the moving average 55 above the current trading, these factors makes us wait for preferring the bearish bias domination, which might target 1.0975 and 1.0955.
Note that the price rally above the bearish channel’s resistance and provides a positive close, will confirm its move to the bullish track, to begin targeting several positive stations by reaching 1.1095 initially.
The expected trading range for today is between 1.0955 and 1.1040
Trend forecast: Bearish
Gold’s rebound from Tuesday’s lows suggests that there is a strong support area at the $3,290-$3,300. The precious metal is trimming previous losses on Thursday, buoyed by a more favourable context, with US Treasury yields and the US Dollar tumbling.
The easing geopolitical concerns have undermined demand for the safe-haven Gold this week, but the yellow metal is drawing support on Thursday from US Dollar weakness on the back of increasing concerns about the Federal Reserve’s independence.
US President Donald Trump called Fed Chairman an “average mentally person”, after Powell reaffirmed his cautious stance towards further monetary easing, and aired the possibility of announcing his replacement way before the end of his term. The market has seen this move as a clear threat to the bank’s independence, which has brought the “Sell America” trade back to the table.
The rebound from Tuesday’s lows at $3,295 has extended beyond the $3,340 previous support (June 20 lows), confirming a deeper bullish correction. The pair night be on a C-D leg of a small Gartley pattern, heading to the descending trendline resistance from mid-June highs, at $3,450, now at $3,365.
A confirmation above this level would signal a trend shift and move the focus towards the $3,400 area, which capped bulls on June 17, 18, and 22.
On the downside, a rejection at the mentioned trendline might seek support at the intraday low $3,330 ahead of the previously mentioned $3,295 (June 9,24 lows)
(This story was corrected on June 26 at 11:19 GMT to say that the gold is targeting $3,365 in the title, and $3,300 in the first paragraph and not $3.365 and $3.300, as previously reported.)
Gold has played a key role in human’s history as it has been widely used as a store of value and medium of exchange. Currently, apart from its shine and usage for jewelry, the precious metal is widely seen as a safe-haven asset, meaning that it is considered a good investment during turbulent times. Gold is also widely seen as a hedge against inflation and against depreciating currencies as it doesn’t rely on any specific issuer or government.
Central banks are the biggest Gold holders. In their aim to support their currencies in turbulent times, central banks tend to diversify their reserves and buy Gold to improve the perceived strength of the economy and the currency. High Gold reserves can be a source of trust for a country’s solvency. Central banks added 1,136 tonnes of Gold worth around $70 billion to their reserves in 2022, according to data from the World Gold Council. This is the highest yearly purchase since records began. Central banks from emerging economies such as China, India and Turkey are quickly increasing their Gold reserves.
Gold has an inverse correlation with the US Dollar and US Treasuries, which are both major reserve and safe-haven assets. When the Dollar depreciates, Gold tends to rise, enabling investors and central banks to diversify their assets in turbulent times. Gold is also inversely correlated with risk assets. A rally in the stock market tends to weaken Gold price, while sell-offs in riskier markets tend to favor the precious metal.
The price can move due to a wide range of factors. Geopolitical instability or fears of a deep recession can quickly make Gold price escalate due to its safe-haven status. As a yield-less asset, Gold tends to rise with lower interest rates, while higher cost of money usually weighs down on the yellow metal. Still, most moves depend on how the US Dollar (USD) behaves as the asset is priced in dollars (XAU/USD). A strong Dollar tends to keep the price of Gold controlled, whereas a weaker Dollar is likely to push Gold prices up.
The GBPCHF affected by stochastic rally to the overbought level, forming some bullish correctional waves, recording 1.1015 level, but the main stability within the bearish channel’s levels, which represents 1.1055 level for the extension of the extra main resistance for the stability of the moving average 55 above the current trading, these factors makes us wait for preferring the bearish bias domination, which might target 1.0975 and 1.0955.
Note that the price rally above the bearish channel’s resistance and provides a positive close, will confirm its move to the bullish track, to begin targeting several positive stations by reaching 1.1095 initially.
The expected trading range for today is between 1.0955 and 1.1040
Trend forecast: Bearish
Silver (XAG/USD) is showing muted price action on Wednesday, slipping modestly lower but staying within Tuesday’s range. At the time of writing, the metal is trading around $35.75 during the American session, down roughly 0.46% on the day. The subdued movement reflects fading safe-haven demand, as signs of easing geopolitical tensions — particularly the truce between Iran and Israel — have cooled the recent risk premium that helped drive Silver to multi-year highs.
Silver is showing early signs of technical fatigue after a strong multi-week uptrend that saw the metal climb from sub-$30 levels to 13-year highs near $37.00. One of the key red flags came from a bearish divergence between price action and the Relative Strength Index (RSI). While spot Silver pushed to fresh multi-year highs last week, the RSI peaked earlier and has since trended lower. With RSI now easing toward 56, the bullish momentum appears to be moderating, inviting cautious profit-taking from short-term traders
Today’s price action sees XAG/USD trading near $35.75, modestly lower on the day, as it currently tests the lower boundary of a well-defined ascending channel. This structure has underpinned bullish momentum since mid-April. This support zone aligns closely with the middle Bollinger Band (20-day SMA), currently around $35.71. A decisive daily close below this confluence area could be the first concrete signal that bulls are losing grip.
The Bollinger Bands have started to contract after widening sharply during Silver’s rally. Such narrowing typically precedes a significant directional move. If the lower channel support around $35.60–$35.70 gives way, it could open the door toward deeper retracements near $34.00.
Volatility, as captured by the Average True Range (ATR 14), has also tapered off to 0.78, suggesting that the explosive moves of early June are giving way to more measured price action. This could mean that the market is entering a consolidation phase or preparing for a breakout reversal.
That said, the broader trend remains bullish unless a confirmed breakdown occurs. Traders will be watching whether bulls can defend this technical inflection zone and bounce back toward $37.00, or if the weight of profit-taking and reduced safe-haven flows forces a steeper correction.
Silver is a precious metal highly traded among investors. It has been historically used as a store of value and a medium of exchange. Although less popular than Gold, traders may turn to Silver to diversify their investment portfolio, for its intrinsic value or as a potential hedge during high-inflation periods. Investors can buy physical Silver, in coins or in bars, or trade it through vehicles such as Exchange Traded Funds, which track its price on international markets.
Silver prices can move due to a wide range of factors. Geopolitical instability or fears of a deep recession can make Silver price escalate due to its safe-haven status, although to a lesser extent than Gold’s. As a yieldless asset, Silver tends to rise with lower interest rates. Its moves also depend on how the US Dollar (USD) behaves as the asset is priced in dollars (XAG/USD). A strong Dollar tends to keep the price of Silver at bay, whereas a weaker Dollar is likely to propel prices up. Other factors such as investment demand, mining supply – Silver is much more abundant than Gold – and recycling rates can also affect prices.
Silver is widely used in industry, particularly in sectors such as electronics or solar energy, as it has one of the highest electric conductivity of all metals – more than Copper and Gold. A surge in demand can increase prices, while a decline tends to lower them. Dynamics in the US, Chinese and Indian economies can also contribute to price swings: for the US and particularly China, their big industrial sectors use Silver in various processes; in India, consumers’ demand for the precious metal for jewellery also plays a key role in setting prices.
Silver prices tend to follow Gold’s moves. When Gold prices rise, Silver typically follows suit, as their status as safe-haven assets is similar. The Gold/Silver ratio, which shows the number of ounces of Silver needed to equal the value of one ounce of Gold, may help to determine the relative valuation between both metals. Some investors may consider a high ratio as an indicator that Silver is undervalued, or Gold is overvalued. On the contrary, a low ratio might suggest that Gold is undervalued relative to Silver.
Gold (XAU/USD) has not yet given any confirmation of momentum to the upside, stuck between the $3,450 and $3,300 levels as traders weigh opposing forces. After a strong rebound from last week’s lows near $3,300, the yellow metal has struggled to sustain momentum. The upside has been capped as inflation data cooled and Treasury yields steadied.
Currently, Gold is hovering at the discount level of the overall range, signaling a bearish environment. Though Gold is in a bearish territory, this is still not yet a confirmed reversal to the downside, most especially, the tensions in the middle east, Israel and Iran, has not yet fully de-escalated, giving Gold reason to push up.
Gold’s price action now reflects indecision, with neither bulls nor bears taking full control ahead of high-impact events and amidst geopolitical tensions.
This scenario was also outlined in my latest article on Gold, Gold stalls despite war headlines: Bullish and bearish scenarios to watch & Dollar, majors, indices and Gold gameplan for this week.
Before:
After:
The narrative behind this is that if the ceasefire gains traction and Iran steps back and opens door to diplomacy, risk appetite may rebound, dragging gold down. A clean break and close below $3,300 would open downside potential to the $3,250 level or even $3,200. Also, the rejection of the midrange acted as a technical catalyst that weighs Gold down.
U.S.-Iran Talks On The Way Trump announced U.S.–Iran talks scheduled for next week and mediated with Qatar’s help, focusing on nuclear and broader peace matters.
Qatar’s mediation was pivotal in securing Iran’s support for the ceasefire after discussing terms with both Tehran and President Trump.
Both sides acknowledged the truce, but initial violations were reported: Iran fired missiles at Beersheba and Israel responded with strikes on Iranian facilities – each accusing the other of breach.

If Gold gains ground above the $3,330 level and a push through above the previous mid-range or equilibrium level, we might see further traction on Gold.
Another confluence that could lift Gold is if the tensions between Israel & Iran escalates and oil gets affect, this could raise safe-haven inflow on Gold.
Targets:
If Gold does not get an upside follow-through with a series of bullish candles above $3,340, Dollar gains traction, which is unlikely for now, and Gold breaks below $3,310 – $3,300 level, this could send the bullion for a renewed downside.
Targets:
While Gold remains fundamentally supported by long-term macro themes like central bank buying and inflation uncertainty, near-term direction will be decided by upcoming U.S. data and the Fed’s policy signals.
A breakout from the current range could provide a cleaner directional bias. Until then, patience is key.
A confirmed break on either side will likely invite strong momentum. Bias remains neutral to bullish unless $3,300-$3,400 is broken convincingly.


 & Silver Price Forecast: Range-Bound Ahead of Inflation and Fed Signals")


