The main tag of Gold Price Articles.
You can use the search box below to find what you need.
[wd_asp id=1]
The main tag of Gold Price Articles.
You can use the search box below to find what you need.
[wd_asp id=1]
Gold surged to $4,085 per ounce, extending last week’s recovery as investors priced in a near 70% chance of a December rate cut by the Federal Reserve. The rally comes amid weakening U.S. labor data, falling consumer sentiment, and signs of a possible end to the historic government shutdown — a combination that’s undermining the U.S. Dollar Index (DXY) and pushing safe-haven demand sharply higher.
The Senate’s 60–40 vote to reopen federal agencies reduced near-term political risk while triggering broad risk-on flows across markets. Yet, gold’s strength shows investors are betting that fiscal relief will lead to a weaker dollar and renewed liquidity — a classic setup that supports precious metals.
Fresh macro data from October revealed deep cracks in the U.S. job market. Over 150,000 layoffs were reported, marking the largest October job-cut total in over two decades. Meanwhile, the University of Michigan Consumer Sentiment Index plunged to 50.3, the lowest since mid-2022 and well below the forecasted 53.2.
The downturn reinforced investor conviction that the Fed will deliver another 25 basis point cut at the December meeting, reducing rates to the 3.50%–3.75% range. For XAU/USD, lower rates directly translate to reduced opportunity costs, making the metal more attractive than yield-bearing assets.
Traders note that the recent slowdown in Non-Farm Payroll growth, averaging just 95,000 per month in 2025 versus 200,000+ in 2023–2024, signals fading momentum across multiple sectors. These data points continue to anchor bullish sentiment around gold, as rate-sensitive investors hedge against further U.S. economic weakness.
Central bank accumulation remains one of the most powerful undercurrents in gold’s rally. According to the World Gold Council, global central banks — led by China, India, and Turkey — have collectively added over 800 tonnes of gold in 2025 through Q3.
Emerging markets continue to diversify reserves away from U.S. Treasuries and into gold amid persistent currency volatility. This structural trend has created a floor under gold prices near the $3,900–$4,000 range, insulating the market from deeper corrections.
Institutional flows confirm similar behavior, with ETFs recording three consecutive weeks of inflows totaling over $3.1 billion. This surge reflects renewed conviction that XAU/USD remains undervalued relative to its inflation-hedge appeal and central bank hoarding pace.
Technically, gold has re-established its bullish trajectory. After bouncing off the 20-day EMA near $3,981, buyers defended the $4,000 psychological level and pushed prices toward the $4,085 zone, confirming renewed upward strength.
Key resistance now stands near $4,100–$4,130, with an extension target of $4,265, last month’s high. If momentum persists, the market could retest the October record near $4,380, before a broader advance toward $4,400–$4,500.
On the downside, immediate support is positioned at $4,025, followed by $3,900 at the 50-day EMA. Momentum indicators remain constructive — the RSI at 54 and a bullish MACD crossover signal a continued upward bias.
While the Senate’s move to end the shutdown temporarily boosts investor confidence, the fiscal implications could paradoxically support gold further. Reopened federal spending raises long-term deficit projections, adding to structural debt concerns that historically fuel gold accumulation.
Analysts emphasize that the shutdown’s resolution is not inherently bearish for gold. Although it may cause a short-lived USD bounce, broader market interpretation leans toward higher fiscal outflows, delayed growth, and lower yields — all favorable for gold’s medium-term outlook.
Traders are now watching how the Treasury market absorbs the $125 billion in new issuance this week. Should yields remain subdued despite supply expansion, XAU/USD could see another leg higher toward $4,200 before mid-November.
Markets continue to price a 64%–70% chance of a December rate cut as inflation slows and growth data weaken. Fed officials’ tone has softened, with policymakers hinting that policy tightening has achieved sufficient disinflation.
Lower real rates historically create a twofold benefit for gold: they diminish the relative yield advantage of bonds and weaken the dollar’s purchasing power. The current DXY range around 99.5 underscores fading demand for the greenback, with multiple analysts projecting further downside toward 98.7 in Q4.
The bond market reinforces this narrative — the 10-year Treasury yield (BX:TMUBMUSD10Y) holding near 4.11% reflects stable nominal yields against falling inflation expectations, creating the ideal backdrop for sustained XAU/USD strength.
Institutional traders are increasingly using bull call spreads and put-sell combinations to capture upside while managing volatility. With volatility metrics subdued and implied skew favoring calls, options desks indicate rising appetite for $4,200–$4,400 strike exposure through December.
Funds also appear to be rotating from equities into commodities — particularly gold and silver — amid valuation concerns in AI and tech sectors. Silver, gold’s industrial counterpart, has gained 1% this week, hovering near $50 per ounce with 65% year-to-date performance, reflecting broader precious metal strength.
Market data shows speculative long positions in COMEX gold futures increasing by over 8% week-on-week, the largest net build since March. These leveraged inflows align with strong ETF demand, confirming synchronized institutional optimism.
Despite the brief recovery in risk assets, the dollar-devaluation trade remains the key macro narrative supporting gold. Analysts highlight persistent deficits, rising interest costs, and expanding debt-to-GDP ratios as the primary long-term drivers for gold’s appreciation.
Experts warn that even a temporary delay in the next rate cut won’t derail the bullish thesis, as the underlying real yield compression and fiscal imbalance maintain structural support for precious metals.
Forecasts from leading institutions reinforce this trajectory — Goldman Sachs targets $5,055, Bank of America $5,000, and UBS $4,700 under its upside scenario by 2026. Consensus targets for Q1 2026 cluster around $4,200–$4,400, implying moderate upside but strong retention above current levels.
After analyzing labor weakness, rate expectations, central bank accumulation, and technical resilience, TradingNews maintains a decisive BUY outlook on Gold (XAU/USD). Support at $4,000 remains firm, while upside potential stretches toward $4,200–$4,400 in the short term and $5,000+ over the next 12 months.
Gold continues to stand as the preferred macro hedge in an environment of dovish monetary policy, fiscal expansion, and dollar devaluation. Unless the Fed surprises with hawkish rhetoric or DXY rebounds above 100.3, the path of least resistance remains upward.
The technical and fundamental alignment — from Fed expectations to central bank flows — confirms that gold’s bullish cycle remains intact, positioning XAU/USD as one of the most resilient trades heading into 2026.
The EURJPY pair affected by stochastic positivity, form bullish waves to retest the barrier at 177.85, to settle below it to keep the chances of activating the bearish corrective track, note that the initial corrective target in the current trading near 177.05 level, by providing negative momentum that might help it to reach near 175.85 support.
While confirming regaining the bullish bias requires forming a new bullish rally, to open the way a new chance to press on the top at 178.70. surpassing it will make it record new gains by its rally towards 179.30 and 180.00.
The expected trading range for today is between 177.00 and 178.15
Trend forecast: Bearish.
The Federal Reserve has held rates steady since September, but the combination of softer employment data and declining business confidence has prompted speculation that policymakers may ease monetary conditions to support demand heading into 2026.
The latest labor data underscored the fragility of the US job market. Private employers cut 153,000 jobs in October, the steepest monthly decline in over two decades. Layoffs in the government and retail sectors, coupled with an uptick in corporate cost-cutting, heightened fears of a broader slowdown.
Consumer sentiment also dropped to its lowest level in nearly three and a half years, according to a University of Michigan survey, as Americans grew increasingly concerned about inflation, fiscal uncertainty, and the prolonged government shutdown.
These developments have pushed investors toward precious metals, which tend to perform well in times of economic uncertainty and falling interest-rate expectations.
Silver followed gold higher, supported by its dual role as both a safe-haven and an industrial metal. Analysts at Metals Focus noted that expectations of weaker Treasury yields and a potential rebound in manufacturing activity could sustain silver’s momentum.
With market attention turning to Fed speeches and upcoming inflation data, traders are closely watching whether policymakers confirm growing market bets on a softer monetary path through year-end.
No news for copper price by forming weak sideways trading, to keep its stability near $5.000 level due to the contradiction between the main indicators, which might force it to delay the main bullish rally.
Notet that the stability of the current trading below $5.2000 level might force it to provide some bearish corrective trading, to target the initial support level at $4.7500, while breaching the barrier will reinforce the chances of recording extra gains by its rally towards $5.3200 initially.
The expected trading range for today is between $4.9000 and $5.1500
Trend forecast: Fluctuated within the bullish track
Gold price (XAU/USD) jumps to near $4,075 during the early European trading hours on Monday. The precious metal edges higher amid uncertainty over the US economic outlook. Traders ramped up bets on a US rate cut following weak US private jobs data and a downbeat University of Michigan (UoM) Consumer Sentiment Index survey. Lower interest rates could reduce the opportunity cost of holding Gold, supporting the non-yielding precious metal.
On the other hand, signs that the US government shutdown may end could undermine safe-haven assets such as Gold. US senators are voting on a deal on Monday that could end the longest government shutdown in history. Furthermore, easing trade tensions between the US and China, the world’s two largest economies, could also drag the yellow metal lower in the near term.
Traders will closely monitor the US October Consumer Price Index (CPI) inflation data later on Thursday. The headline CPI is expected to show an increase of 0.2% MoM in October, while the core CPI is projected to show a rise of 0.3% MoM during the same period. The US Retail Sales will be in the spotlight on Friday.
Gold price trades in positive territory on the day. According to the daily chart, the positive outlook of the precious metal remains in play as the price holds above the key 100-day Exponential Moving Average. The path of least resistance is to the upside, with the 14-day Relative Strength Index (RSI) standing above the midline near 55.0. This displays the bullish momentum for the yellow metal in the near term.
Sustained trading above the October 22 high of $4,161 could send the yellow metal toward the $4,200 psychological level. Further north, the next hurdle to watch is the upper boundary of the Bollinger Band at $4,325.
If we start seeing bearish candlesticks and consistent trading below $4,000, that could signal that sellers are back in control. In that case, XAU/USD might return to the lower limit of the Bollinger Band of $3,835, followed by the 100-day EMA of $3,705.
Monetary policy in the US is shaped by the Federal Reserve (Fed). The Fed has two mandates: to achieve price stability and foster full employment. Its primary tool to achieve these goals is by adjusting interest rates.
When prices are rising too quickly and inflation is above the Fed’s 2% target, it raises interest rates, increasing borrowing costs throughout the economy. This results in a stronger US Dollar (USD) as it makes the US a more attractive place for international investors to park their money.
When inflation falls below 2% or the Unemployment Rate is too high, the Fed may lower interest rates to encourage borrowing, which weighs on the Greenback.
The Federal Reserve (Fed) holds eight policy meetings a year, where the Federal Open Market Committee (FOMC) assesses economic conditions and makes monetary policy decisions.
The FOMC is attended by twelve Fed officials – the seven members of the Board of Governors, the president of the Federal Reserve Bank of New York, and four of the remaining eleven regional Reserve Bank presidents, who serve one-year terms on a rotating basis.
In extreme situations, the Federal Reserve may resort to a policy named Quantitative Easing (QE). QE is the process by which the Fed substantially increases the flow of credit in a stuck financial system.
It is a non-standard policy measure used during crises or when inflation is extremely low. It was the Fed’s weapon of choice during the Great Financial Crisis in 2008. It involves the Fed printing more Dollars and using them to buy high grade bonds from financial institutions. QE usually weakens the US Dollar.
Quantitative tightening (QT) is the reverse process of QE, whereby the Federal Reserve stops buying bonds from financial institutions and does not reinvest the principal from the bonds it holds maturing, to purchase new bonds. It is usually positive for the value of the US Dollar.
The EURJPY pair affected by stochastic positivity, form bullish waves to retest the barrier at 177.85, to settle below it to keep the chances of activating the bearish corrective track, note that the initial corrective target in the current trading near 177.05 level, by providing negative momentum that might help it to reach near 175.85 support.
While confirming regaining the bullish bias requires forming a new bullish rally, to open the way a new chance to press on the top at 178.70. surpassing it will make it record new gains by its rally towards 179.30 and 180.00.
The expected trading range for today is between 177.00 and 178.15
Trend forecast: Bearish.
No news for copper price by forming weak sideways trading, to keep its stability near $5.000 level due to the contradiction between the main indicators, which might force it to delay the main bullish rally.
Notet that the stability of the current trading below $5.2000 level might force it to provide some bearish corrective trading, to target the initial support level at $4.7500, while breaching the barrier will reinforce the chances of recording extra gains by its rally towards $5.3200 initially.
The expected trading range for today is between $4.9000 and $5.1500
Trend forecast: Fluctuated within the bullish track
Gold is building on Friday’s rebound in Asian trades on Monday, having briefly regained the $4,050 psychological barrier to hit ten-day highs. Traders await fresh cues on the end to the record US government shutdown amid mounting economic concerns.
Gold consolidates its latest leg higher, with buyers taking a breather amid a positive shift in risk sentiment as markets stay hopeful about the US government reopening.
US Senate voted 60-40 in the first approval on extending the enhanced Affordable Care Act subsidies early Monday, passing the government funding bill to end the shutdown.
Additionally, risk flows dominate as China announced on Sunday the temporary suspension of its ban on approving exports of dual-use items related to gallium, germanium, antimony and super-hard materials to the United States, per Reuters.
Despite the broader market optimism, investors remain wary as the amended package would still have to be passed by the House of Representatives and sent to President Donald Trump for his signature, a process that could take several days.
This, combined with growing concerns over the US economy amid the fallout of the record government shutdown continues to lend support to the traditional store of value, Gold.
The University of Michigan (UoM) released data on Friday, which showed that the preliminary Consumer Sentiment Index dropped to 50.3 in early November, the lowest in nearly three-and-a-half years.
Weakening consumer sentiment followed the data published by the executive outplacement firm Challenger, Gray & Christmas on Thursday, revealing that corporations announced a 183.1% monthly surge in layoffs, the worst October in over two decades, per Reuters.
Against this backdrop, markets continue to price in about a 66% chance of the US Federal Reserve (Fed) lowering interest rates in December.
Gold also draws support from rising metal holdings by China. China’s Gold Exchange-Traded Funds (ETF) surged 164% in the first nine months of 2025, while the People’s Bank of China (PBOC) boosted its Gold purchases for an 11th straight month, raising reserves to 2,303.5 tons.
Looking ahead, Gold’s price action will likely be determined by the US shutdown news and the probable publication timeline of the missed economic data releases. In the time, market sentiment and Fed rate cut expectations will continue providing sone trading incentives in Gold.
The daily chart suggests that upside risks prevail in the near term for Gold as the 14-day Relative Strength Index (RSI) points north of the midline.
Gold now looks for acceptance above the $4,050 psychological level to take on the 21-day Simple Moving Average (SMA) at $4,081.
A sustained move above the latter will expose the 23.6% Fibonacci Retracement level of the parabolic rise to the record high that began on August 19 at $4,129.
On the downside, the initial hurdle is seen at $3,973, the 38.2% Fibo level of the same advance.
Next on sellers’ radars will be the intermittent lows near $3,930, a break below which would expose the $3,900 figure.
Gold has played a key role in human’s history as it has been widely used as a store of value and medium of exchange. Currently, apart from its shine and usage for jewelry, the precious metal is widely seen as a safe-haven asset, meaning that it is considered a good investment during turbulent times. Gold is also widely seen as a hedge against inflation and against depreciating currencies as it doesn’t rely on any specific issuer or government.
Central banks are the biggest Gold holders. In their aim to support their currencies in turbulent times, central banks tend to diversify their reserves and buy Gold to improve the perceived strength of the economy and the currency. High Gold reserves can be a source of trust for a country’s solvency. Central banks added 1,136 tonnes of Gold worth around $70 billion to their reserves in 2022, according to data from the World Gold Council. This is the highest yearly purchase since records began. Central banks from emerging economies such as China, India and Turkey are quickly increasing their Gold reserves.
Gold has an inverse correlation with the US Dollar and US Treasuries, which are both major reserve and safe-haven assets. When the Dollar depreciates, Gold tends to rise, enabling investors and central banks to diversify their assets in turbulent times. Gold is also inversely correlated with risk assets. A rally in the stock market tends to weaken Gold price, while sell-offs in riskier markets tend to favor the precious metal.
The price can move due to a wide range of factors. Geopolitical instability or fears of a deep recession can quickly make Gold price escalate due to its safe-haven status. As a yield-less asset, Gold tends to rise with lower interest rates, while higher cost of money usually weighs down on the yellow metal. Still, most moves depend on how the US Dollar (USD) behaves as the asset is priced in dollars (XAU/USD). A strong Dollar tends to keep the price of Gold controlled, whereas a weaker Dollar is likely to push Gold prices up.
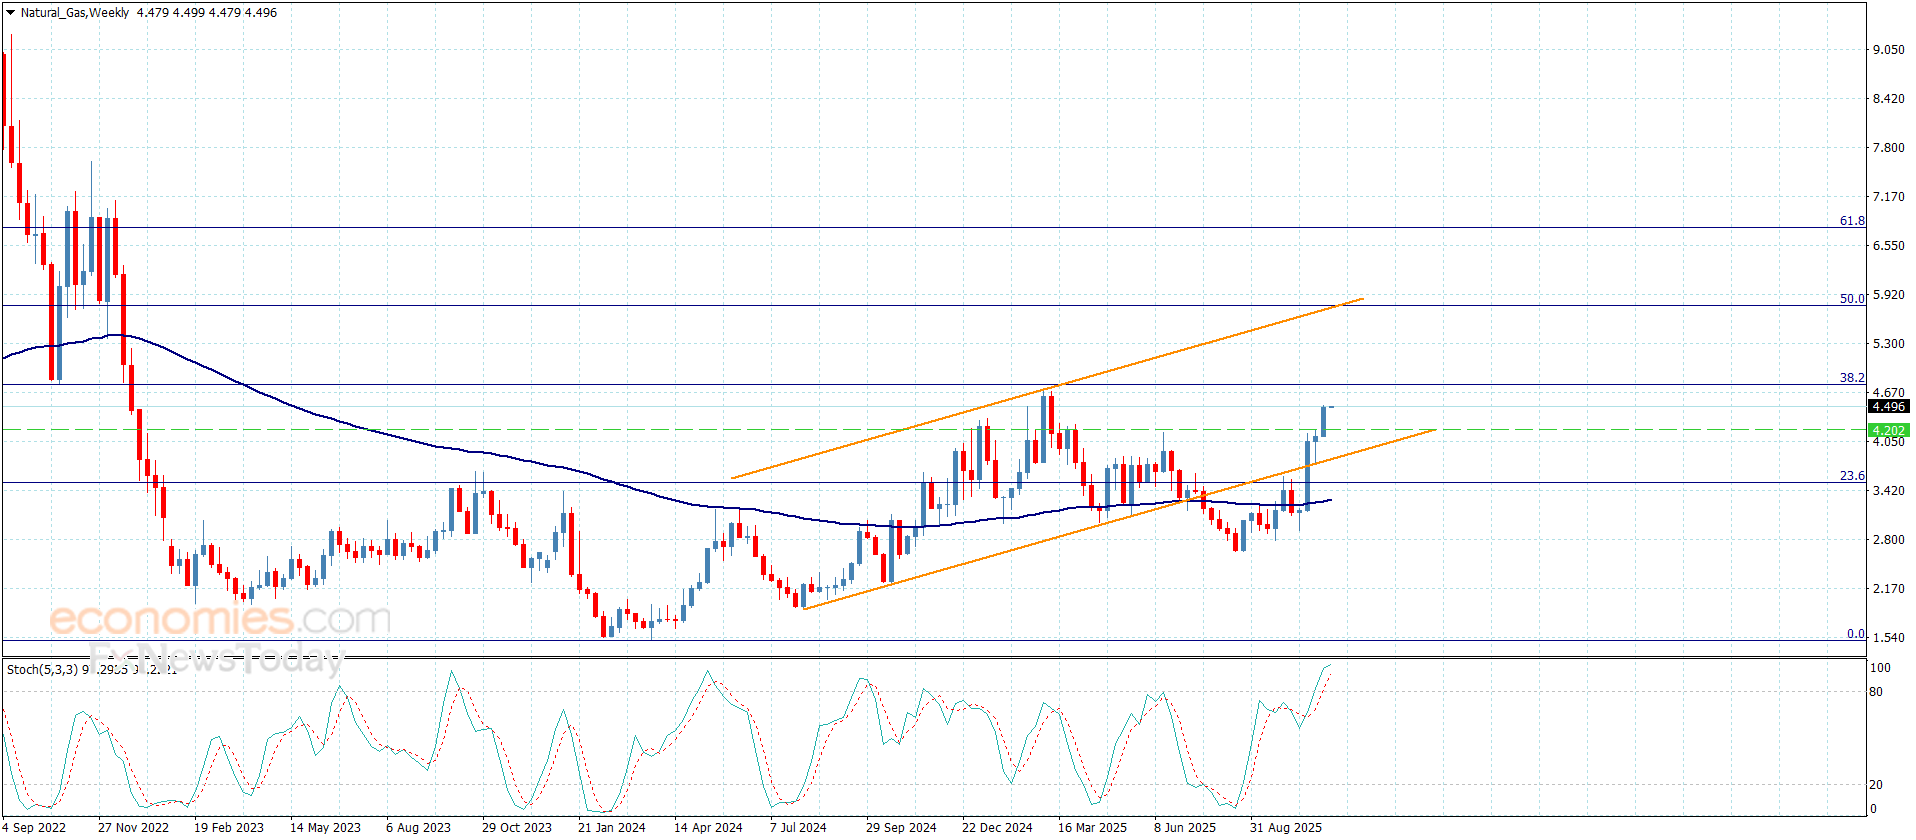
Production growth continues to be a key headwind. U.S. (lower-48) dry gas output was estimated at 110.0 bcf/day on Friday, up 8.1% from a year ago. Baker Hughes reported an increase in active U.S. natural gas rigs, pushing the count to a 2.25-year high. The EIA recently raised its 2025 production forecast to 107.14 bcf/day, up 0.5% from the previous estimate, reinforcing the supply-heavy outlook.
Thursday’s EIA report did little to shift sentiment. The +33 bcf injection matched expectations but was below the five-year average build of +42 bcf, offering mild support. Still, inventories remain ample—up 0.4% year-over-year and 4.3% above the five-year seasonal average. Meanwhile, gas demand across the lower-48 dropped 2.7% year-over-year to 77.0 bcf/day, while LNG export flows edged down 0.8% week-over-week to 17.3 bcf/day, according to BNEF.
Electricity usage showed modest strength. Edison Electric Institute data revealed U.S. power output rose slightly by 0.05% year-over-year for the week ending November 1 and is up nearly 3% over the past year. While helpful, this uptick is unlikely to offset the bearish weight from strong supply and softening seasonal demand.
Gold (XAU/USD) remains the dominant asset in global markets, trading near $3,978 per ounce after setting an all-time high of $4,381.21 on October 20 2025. The metal’s surge from $1,617 in October 2022 marks a 170% gain in just three years, ranking as the third-strongest rally in half a century. While its magnitude trails the historic explosions of 643% (2001–2011) and 518% (1976–1980), the structure of today’s advance is fundamentally different. Rather than speculative fervor, this rally is anchored in structural demand from central banks, fiscal stress in the United States, and a shift in the balance of global reserve power. These forces suggest the current uptrend in XAU/USD is more resilient and durable than any speculative spike of the past.
Between July 1976 and February 1980, gold soared from $134 to $692, delivering a 518% rise during an era defined by inflation above 13%, oil embargoes, and the collapse of Bretton Woods. The subsequent twenty-year correction drove the metal down 63% to $256 by 2001, but gold’s monetary role endured.
The next super-cycle began in February 2001 and peaked in September 2011, climbing from $256 to $1,902, a 643% increase. The dot-com collapse, the 9/11 attacks, and the Federal Reserve’s quantitative easing created a decade of fear that drove gold to new prominence. Even after falling 44% to $1,052 in 2015, its floor remained multiple times higher than in the prior century.
Today’s move from $1,617 to $4,381 since late 2022—though smaller in percentage terms—reflects an entirely different foundation: institutional accumulation, reserve diversification, and distrust of fiat credibility. It is a rally powered not by panic but by policy evolution.
The structural engine of this bull market is relentless central-bank accumulation. Since 2022, official institutions have bought more than 1,000 metric tons annually, maintaining a fourth consecutive record year. The World Gold Council’s Q3 2025 data confirm 220 tons added in the quarter, up 28% from Q2 and 47% above the same period in 2024. Nations such as China, India, Turkey, Singapore, and Poland are reshaping reserve composition by reducing exposure to U.S. Treasuries.
Quarterly purchasing patterns illustrate this transformation: 2022 — 1,087 t, 2023 — 958 t, 2024 — ≈1,043 t, and 2025 — on pace for 1,080 t. Such persistence at record price levels underscores a strategic shift away from dollar reliance. The result is a structural floor in XAU/USD unseen in previous cycles.
Institutional and retail investment behavior in 2025 has diverged from historic norms. Instead of tapering as prices rose, investment demand accelerated. Physical and ETF holdings expanded to 220 tons in Q3 2025, while jewelry consumption fell 19% to 371 tons. Investors now view gold as systemic insurance against sovereign debt excess, not merely a hedge against inflation.
Institutional portfolios treat gold as protection against U.S. fiscal fragility and potential political interference with the Federal Reserve. Retail enthusiasm, particularly among high-net-worth investors in Europe and the Middle East, has intensified, with allocations exceeding 10% of assets. Physical premiums in Asia continue to widen, reflecting a tight global supply chain.
India’s market, historically the world’s largest consumer of physical gold, faces pronounced price sensitivity. With spot prices above $4,000, jewelry demand has weakened sharply, festival-season sales have diminished, and consumers are turning toward lighter ornaments and gold-plated substitutes.
China exhibits a contrasting pattern. Jewelry sales have softened, yet investment gold bars and coins are selling briskly, supported by the yuan’s depreciation and state narratives promoting gold as a defensive reserve. These dual dynamics—soft retail but strong institutional buying—define the present rally’s balance.
Technically, XAU/USD trades within an orderly bullish structure. The 200-day moving average near $3,650 acts as structural support, while the upper resistance band lies between $4,400 and $4,500. Momentum oscillators remain stretched but not extreme, confirming controlled strength. Daily volatility averages 1.1%, far below the 4% swings typical of 1979, indicating that the rally is institutionally guided rather than speculative.
Support levels cluster at $3,800–$3,900, deeper demand zones around $3,600–$3,700, and potential breakout resistance near $4,800 if momentum resumes. This tight, disciplined structure mirrors the liquidity and algorithmic order of modern ETF trading, not the chaos of earlier booms.
Forecasts for gold’s trajectory diverge widely among global banks. The bullish cohort, targeting $4,500–$6,000, anticipates persistent central-bank purchases above 1,000 tons yearly and continued fiscal deterioration in the United States. The moderate group, clustered around $3,800–$4,500, expects normalization of ETF flows and a gradual easing of U.S. rates through 2026. The conservative camp, projecting $3,200–$4,000, warns of potential demand destruction in Asia and speculative profit-taking.
Across these perspectives, consensus emerges around a structural support floor at $3,500, reflecting conviction that gold’s retracements will remain shallow unless monetary policy shifts sharply.
The Trump administration’s $2 trillion fiscal stimulus and renewed tariff policy are inflating expectations for sustained deficit spending. Annual U.S. interest payments exceeding $1 trillion—now larger than the defense budget—highlight systemic debt fragility. Simultaneously, fears over political interference in Federal Reserve operations are reviving long-dormant credibility concerns.
Foreign holdings of U.S. Treasuries have dropped to a twelve-year low as central banks pivot toward bullion. In parallel, BRICS nations advance alternative settlement systems using gold-linked instruments, a development that could redefine international liquidity flows and maintain elevated structural demand for XAU/USD well into the decade.
Gold’s ~50% year-to-date gain represents its strongest annual performance since 1979, easily outperforming the S&P 500’s 18% and the NASDAQ’s 21% advances. Adjusted for inflation, equities deliver negative real returns, while gold preserves purchasing power. The correlation between XAU/USD and the U.S. Dollar Index has fallen to -0.78, emphasizing gold’s hedge role. Silver trades near $48.40, platinum around $1,391, and palladium at $1,193, leaving gold the undisputed leader among precious metals in 2025.
Two risks could interrupt the uptrend. A decisive Federal Reserve pivot to hawkishness could lift real yields and strengthen the dollar, pressuring gold. Additionally, Asian jewelry demand erosion could deepen if prices remain above $4,000. ETF liquidations during equity corrections might create short-term volatility, though such dips are typically absorbed by central-bank buying. Historical analogues show that drawdowns in similar phases averaged -13% before trend resumption, underscoring resilience rather than reversal.
Conservative portfolios may maintain 5–10% exposure through physical or low-cost ETFs. Aggressive investors can pursue leveraged strategies in miners or derivatives, targeting the $4,800–$5,000 band over the next twelve months. Accumulation zones remain between $3,800–$3,850, with profit-taking advised above $4,400–$4,500. Monitoring real yields, Treasury spreads, and dollar strength remains critical for timing re-entries.
This rally is not a speculative anomaly but part of a global monetary re-architecture. Central banks are re-monetizing gold as neutral collateral in an era of fragmented geopolitics and escalating fiscal imbalance. Mine production growth of only 1.2% year-over-year fails to meet this new structural demand. The era of surplus supply has ended, replaced by systemic scarcity reinforced by policy realignment.
All quantitative and structural indicators point to continued strength in XAU/USD. The asset retains firm support around $3,600–$3,700, with potential to challenge $4,500–$4,800 and possibly $5,000 during 2026 if fiscal and monetary instability persist.
This is not the speculative fever of 1980 nor the liquidity panic of 2008—it is a calculated, institution-driven reallocation of global capital. Based on fundamentals, technical resilience, and geopolitical currents, the stance on XAU/USD remains BUY (Medium-Term Bias – Bullish).