The main tag of Gold Price Articles.
You can use the search box below to find what you need.
[wd_asp id=1]
The main tag of Gold Price Articles.
You can use the search box below to find what you need.
[wd_asp id=1]
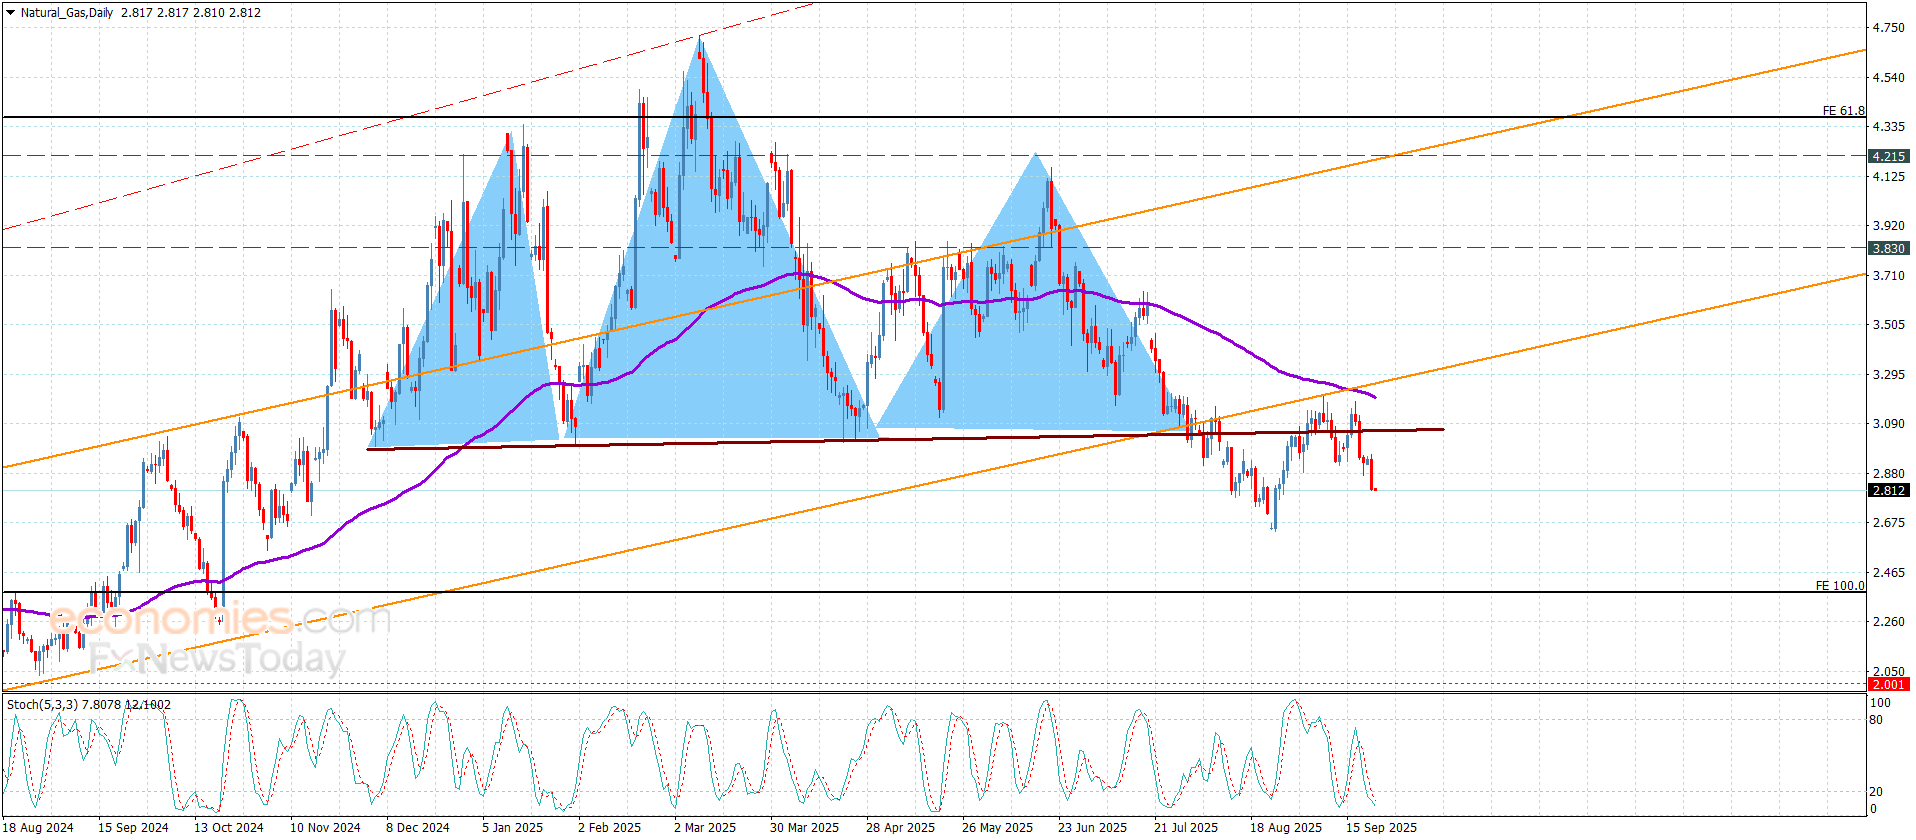
Natural gas price took advantage of the positive momentum that comes from stochastic rally above EMA50 in yesterday’s trading, delaying the negative attack by its stability above $3.050, achieving some gains by its stability near $3.150.
The current rise didn’t affect the main bearish scenario, due to its stability below the main resistance at $2.265, to expect forming sideways trading, then begin forming bearish waves, to press on $2.820 level again, while its success in surpassing the resistance and holding above it will turn the bullish track again, providing strong chance for recording several gains by its rally to $3.450 initially.
The expected trading range for today is between $2.820 and $3.220
Trend forecast: Bearish
The (Brent) price declined in its last intraday trading, gathering the gains of its previous rises, attempting to offload some of its overbought conditions on the relative strength indicators, with the emergence of negative overlapping signals, to gather its positive strength that might help it to recover and rise again, amid the dominance of strong minor bullish wave, taking advantage of the dynamic support that is represented by its trading above EMA50, reinforcing the chances for the price recovery in the upcoming period.
Get high-accuracy trading signals delivered directly to your Telegram. Subscribe to specialized packages tailored for the world’s top markets:
Full VIP signals performance report for September 15–19, 2025:
Silver price (XAG/USD) recovers its daily losses, trading around $44.10 per troy ounce during the European hours on Wednesday. The non-interest-bearing Silver maintains its position near a 14-year high of $44.47, which was reached on Tuesday as traders widely expect a 25-basis-point rate cut by the US Federal Reserve (Fed) at its October policy meeting.
The CME FedWatch tool suggests that money markets are currently pricing in nearly a 93% possibility of a Fed rate cut in October, up from 90% a day earlier. Traders will likely observe the upcoming US Q2 Gross Domestic Product Annualized and Personal Consumption Expenditures (PCE) Price Index data, the Federal Reserve’s preferred inflation gauge, due later in the week.
Safe-haven Silver draws buyers as geopolitical tensions rise, with NATO vowing a “robust” response to Russian airspace violations. Moreover, President Trump warned at the United Nations (UN) General Assembly on Tuesday that the United States (US) is ready to impose a “very strong round of powerful tariffs” if Russia refuses to end the war in Ukraine.
Additionally, Silver found support from strong fundamentals, with tight supply and steady demand from solar, EV, and electronics sectors underpinning prices. India’s silver imports are also set to rise in the coming months, backed by solid investment and industrial demand that has already absorbed last year’s surplus shipments.
Silver is a precious metal highly traded among investors. It has been historically used as a store of value and a medium of exchange. Although less popular than Gold, traders may turn to Silver to diversify their investment portfolio, for its intrinsic value or as a potential hedge during high-inflation periods. Investors can buy physical Silver, in coins or in bars, or trade it through vehicles such as Exchange Traded Funds, which track its price on international markets.
Silver prices can move due to a wide range of factors. Geopolitical instability or fears of a deep recession can make Silver price escalate due to its safe-haven status, although to a lesser extent than Gold’s. As a yieldless asset, Silver tends to rise with lower interest rates. Its moves also depend on how the US Dollar (USD) behaves as the asset is priced in dollars (XAG/USD). A strong Dollar tends to keep the price of Silver at bay, whereas a weaker Dollar is likely to propel prices up. Other factors such as investment demand, mining supply – Silver is much more abundant than Gold – and recycling rates can also affect prices.
Silver is widely used in industry, particularly in sectors such as electronics or solar energy, as it has one of the highest electric conductivity of all metals – more than Copper and Gold. A surge in demand can increase prices, while a decline tends to lower them. Dynamics in the US, Chinese and Indian economies can also contribute to price swings: for the US and particularly China, their big industrial sectors use Silver in various processes; in India, consumers’ demand for the precious metal for jewellery also plays a key role in setting prices.
Silver prices tend to follow Gold’s moves. When Gold prices rise, Silver typically follows suit, as their status as safe-haven assets is similar. The Gold/Silver ratio, which shows the number of ounces of Silver needed to equal the value of one ounce of Gold, may help to determine the relative valuation between both metals. Some investors may consider a high ratio as an indicator that Silver is undervalued, or Gold is overvalued. On the contrary, a low ratio might suggest that Gold is undervalued relative to Silver.
Despite the stability of the GBPJPY pair in the last period below the barrier at 200.45, but the continuation of the main indicators’ contradiction that pushed it to form sideways trading by its repeated stability near 199.60.
We will keep waiting for gathering the extra negative momentum, to ease the mission of forming new correctional waves, to target 198.60 level reaching the extra support at 197.80, while breaching the barrier will turn the bullish track back, to begin recording extra gains by its rally towards 200.90 and 201.55.
The expected trading range for today is between 198.60 and 200.40
Trend forecast: Bearish
U.S. natural gas futures (NG=F) are trading near $2.852 per MMBtu, posting a 1.64% daily gain, yet the contract remains locked in a tight range as traders prepare to roll into November. Price action has been dominated by noise and compressed volatility, with the chart showing a potential retest of the $2.72 gap that formed in late summer. That level is emerging as a pivotal support zone, while resistance continues to cluster at $3.00–$3.10, reinforced by the 50-day EMA. The broader uptrend line that extends back to February 2024 has not yet been broken, maintaining a fragile bullish structure even as sellers test the lower end of the range.
In Europe, Dutch TTF contracts are steady at about €32 per megawatt-hour ($37.75), underpinned by storage levels at 81.6% of capacity across the bloc. Italy’s inventories lead with 91%, France follows at 90.6%, and Germany lags with 76.4%, highlighting regional disparities but still leaving the EU in a comfortable pre-winter position. Analysts note that last winter was the coldest since the war in Ukraine began, which forced significant withdrawals. If the upcoming season mirrors those conditions, inventories could face renewed stress despite their strong starting point.
Traders have begun placing bold bets on a sharp rally. Options priced for April–September 2026 settled near €50/MWh ($59), suggesting expectations of a 60% increase compared to spot pricing. Forward contracts for summer 2026 remain lower at €31/MWh ($36.57), signaling the risk premium is concentrated in the winter period. This divergence reflects the market’s view that storage, weather, and competition with Asia could force Europe into costly bidding wars just as stockpiles need to be refilled.
The European Union has accelerated its timeline, advancing the full ban on Russian LNG imports to January 2027, one year earlier than previously scheduled. While pipeline gas through Ukraine has already been halted since January 2025, Russia continues to deliver cargoes via Arctic LNG routes, many destined for China, which has already taken six shipments this month despite sanctions pressure. This leaves Europe more reliant on alternative suppliers, particularly the U.S. and Qatar. Washington has promised to expand LNG output and send additional flows to Europe, with new capacity entering service in the next 24 months.
Weak demand from Asia this summer has allowed Europe to secure an outsized share of American cargoes, cushioning its balance. However, the possibility of another harsh winter combined with an Asian demand resurgence poses a real risk of diverting flows away from Europe. Freight costs between the Gulf Coast and Asia have already risen, tightening arbitrage windows and reshaping trade routes. Should Asian utilities return aggressively, Europe may be forced to pay premiums well above current forward curves to keep inventories stable.
In the U.S., the Natural Gas Supply Association (NGSA) expects winter demand to climb to a record 115.5 Bcf/d, up 4 Bcf/d year-over-year. Supply is forecast at 108.5 Bcf/d, while Canadian imports add another 6.9 Bcf/d, leaving the market in balance for now. Storage is entering the season at a five-year high, providing a cushion against early cold spells. However, structural demand is shifting — AI data centers and LNG terminals are creating steady baseload consumption. LNG exports, already absorbing a growing share of daily output, could tighten balances further if global spreads widen during the heating season.
Chart signals indicate natural gas is coiling for a move. The RSI sits near 40, reflecting weakness but also approaching oversold territory. The MACD histogram has flattened, neither confirming bearish continuation nor a bullish turn. Bollinger Bands have narrowed between $2.72 and $3.00, pointing to an imminent breakout. A decisive close below $2.72 could expose lows last seen in early 2024, while recovery above $3.00–$3.10 would open the path to $3.40, where the 200-day EMA converges. Traders see the November contract roll as the likely trigger for volatility expansion.
Movements in NG=F are reverberating across related equities. U.S. LNG exporters such as Cheniere Energy (NYSE:LNG) and Tellurian (NYSE:TELL) are closely tied to forward curves, while European majors like Equinor (NYSE:EQNR) benefit from volatility and arbitrage margins. U.S. midstream names with exposure to Gulf Coast export hubs are also trading with heightened correlation to gas futures. Institutional flows into energy-focused ETFs have increased, suggesting investors are positioning for stronger realized margins in 2026 as export volumes rise.
At $2.85 per MMBtu, natural gas sits between its strongest support at $2.72 and resistance around $3.10. Europe’s spot market stability at €32/MWh masks deeper risks, as option bets are already pricing a surge toward €50/MWh by next summer. With U.S. storage levels strong, production near records, and policy tightening on Russian LNG, the backdrop suggests stability in the near term but volatility premiums growing into 2026. Given the balance of factors — high supply, record demand projections, and structural shifts from AI and LNG — the call remains Hold, with risks skewed toward upside if winter proves harsher than expected.
Gold run to record highs continued on Tuesday, with the bright metal approaching the $3,800 threshold. A mixture of broad US Dollar (USD) weakness, geopolitical tensions, China, and a dovish Federal Reserve (Fed) maintained the bright metal on the run.
The latest catalyst for XAU/USD’s rally was news indicating that the People’s Bank of China (PBoC) is using the Shanghai Gold Exchange to buy bullion in friendly countries and store it within Chinese borders, according to people familiar with the matter.
However, the record run could also be attributed to the recently adopted Fed’s dovish stance. True, policymakers introduced some noise after the announcement, while sharing their particular perspectives. Still, Chair Powell has the last say, and he will soon be on the wires, discussing the economic outlook at the Greater Providence Chamber of Commerce Economic Outlook Luncheon in Rhode Island.
Meanwhile, mounting tensions between Russia and Ukraine add to the demand for the bright metal. Back and forth drone attacks between Moscow and Kyiv have been reported on Tuesday, as Ukrainian President Volodymyr Zelenskyy seeks the United Nations (UN) and US President Donald Trump’s help.
Other than that, S&P Global reported that business activity lost momentum in September, according to preliminary estimates. The Composite Purchasing Managers’ Index (PMI) ticked down to 53.6 from 54.6 in August. Nevertheless, expansion continued in the manufacturing and services sectors. Manufacturing output eased to 52 from the previous 53, while the services index eased to 53.9, as expected from 54.5, suggesting demand there may be easing. The modest downtick hints at easing momentum, but also indicates business remains on the growth path.
US growth will remain under the spotlight, as the country will release on Wednesday the final estimate of the Q2 Gross Domestic Product (GDP).
The XAU/USD pair holds on to solid gains for a third consecutive day, trading near its recent all-time peak at $3,791.12. Technical readings in the daily chart support yet another leg north, despite overbought conditions. The Momentum indicator ticks north within positive levels, while the Relative Strength Index (RSI) indicator stabilized at around 79. As it happens lately, the bright metal keeps advancing beyond bullish moving averages, with the 20 Simple Moving Average (SMA) currently at around $3,600, while also developing far above the bullish 100 and 200 SMAs.
In the near term, and according to the 4-hour chart, XAU/USD entered a pause. The pair consolidates near its recent high as technical indicators retreat from extreme levels, while still in overbought territory. At the same time, the pair is well above all bullish moving averages. Overall, the ongoing retracement gives no sign of the bullish trend abating.
Support levels: 3,767.10 3,753.90 3.736.2
Resistance levels: 3,791.00 3,805.00 3,820.00
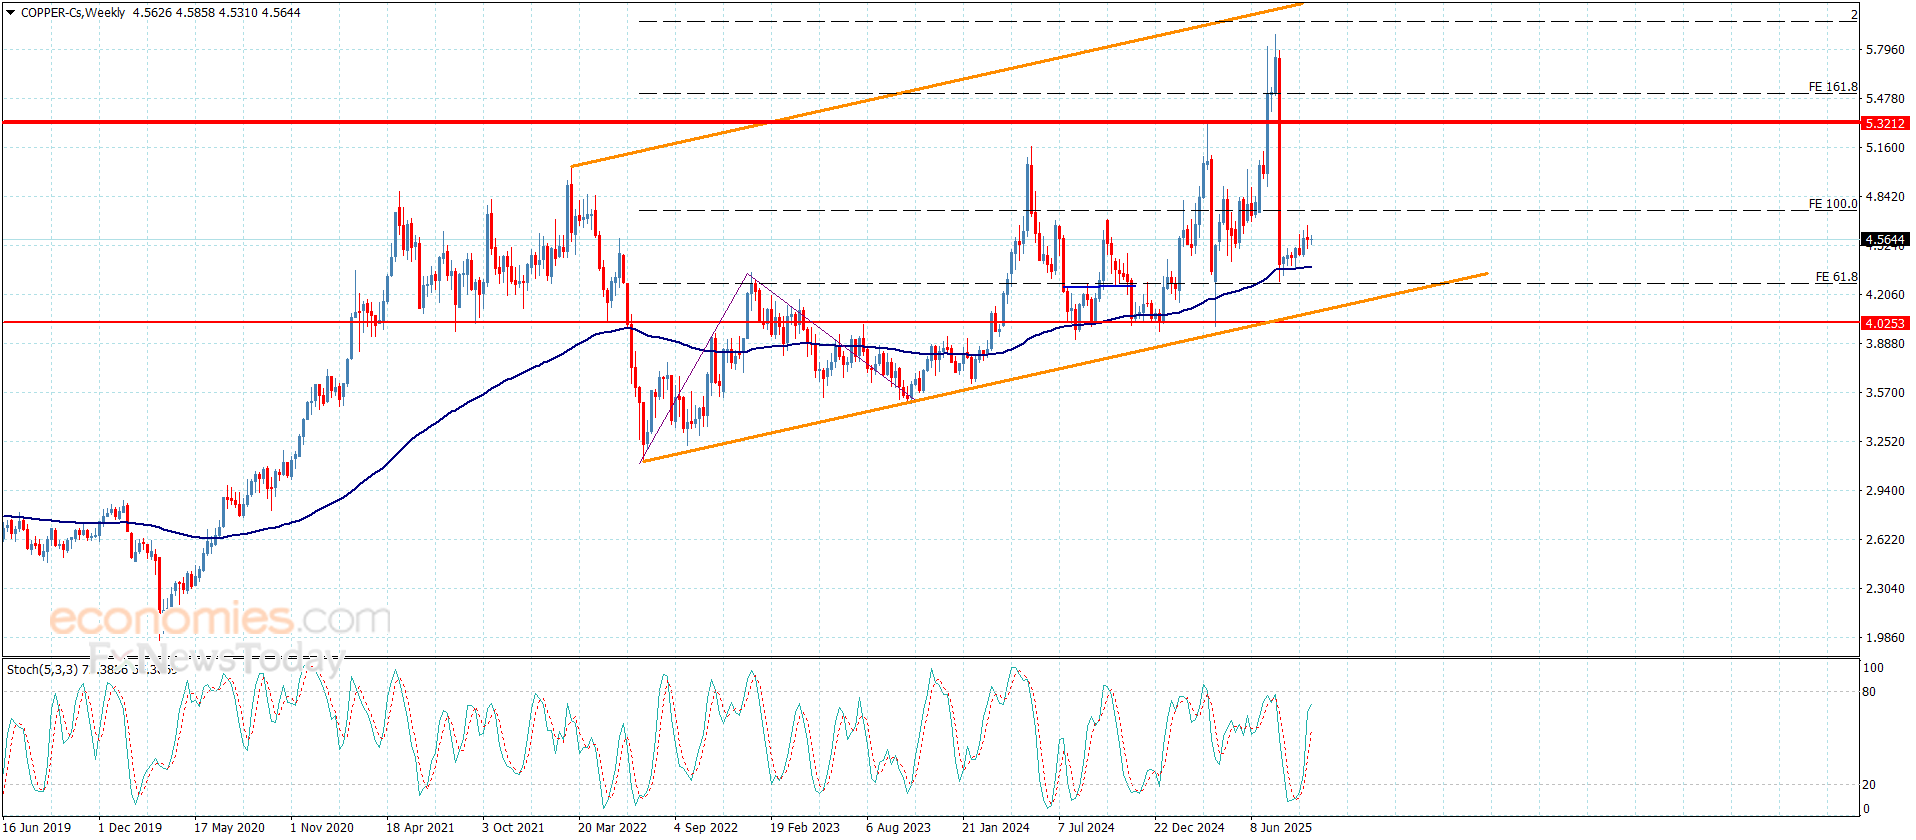
Copper price provided slow trading despite the presence of the positive factors, such as the main stability within the bullish channel’s levels by forming main support at $4.1100 level, besides the continuation of providing bullish momentum by the main indicators, specifically by forming an extra support by the moving average 55 by its stability near $4.3700.
Therefore, we will keep preferring the bullish scenario, to expect surpassing the barrier at $4.6200, to rally towards the positive stations at $4.7500 and $4.9500.
The expected trading range for today is between $4.5000 and 4.7500
Trend forecast: Bullish
Gold continues to march higher on Tuesday, reaching fresh all-time highs and nearing $3,800 after appreciating more than $140 over the last three trading days. The US Dollar’s pullback ahead of the US PMI and Fed Powell’s speech has provided further support to the precious metals.
Investors’ expectations of further Fed rate cuts, on one side, and growing geopolitical concerns, namely the frictions between Russia and its NATO neighbours, have boosted demand for the safe-haven gold this week.
On Tuesday, a range of Fed speakers offered diverse opinions about the bank’s rate path, but futures markets continued to price in a 90% chance of a 25-basis-point cut in November and a 70% chance of another one in December. Against this backdrop, the US Dollar’s upside attempts are likely to remain subdued.
The technical picture shows an overextended rally from mid-August lows. Bullion has appreciated nearly 15% ever since, and these performances, sooner than later, lead to corrections. The RSI is overbought at most timeframes, supporting that view.
On the upside, the psychological level at $3,800 might be a plausible target ahead of a healthy correction. Further up, the 261.8% Fibonacci retracement of the mid-September pullback, at $3,828, emerges as a potential target.
To the downside, immediate support is at the intraday low of $3,738 ahead of the previous record high, in the area of $3,700. Further down, the September 15 and 19 lows, around $36,30 would come into focus.
(This story was corrected on September 23 at 11.25 GMT to say that the market is pricing two further Fed rate cuts, and not rate hikes, as previously reported)
The table below shows the percentage change of US Dollar (USD) against listed major currencies today. US Dollar was the strongest against the Canadian Dollar.
| USD | EUR | GBP | JPY | CAD | AUD | NZD | CHF | |
|---|---|---|---|---|---|---|---|---|
| USD | 0.04% | -0.13% | -0.03% | 0.09% | -0.19% | -0.04% | -0.14% | |
| EUR | -0.04% | -0.04% | -0.05% | 0.09% | -0.17% | -0.04% | -0.12% | |
| GBP | 0.13% | 0.04% | 0.04% | 0.14% | -0.13% | 0.00% | -0.09% | |
| JPY | 0.03% | 0.05% | -0.04% | 0.10% | -0.12% | -0.02% | -0.02% | |
| CAD | -0.09% | -0.09% | -0.14% | -0.10% | -0.27% | -0.13% | -0.22% | |
| AUD | 0.19% | 0.17% | 0.13% | 0.12% | 0.27% | 0.14% | 0.12% | |
| NZD | 0.04% | 0.04% | -0.00% | 0.02% | 0.13% | -0.14% | -0.09% | |
| CHF | 0.14% | 0.12% | 0.09% | 0.02% | 0.22% | -0.12% | 0.09% |
The heat map shows percentage changes of major currencies against each other. The base currency is picked from the left column, while the quote currency is picked from the top row. For example, if you pick the US Dollar from the left column and move along the horizontal line to the Japanese Yen, the percentage change displayed in the box will represent USD (base)/JPY (quote).
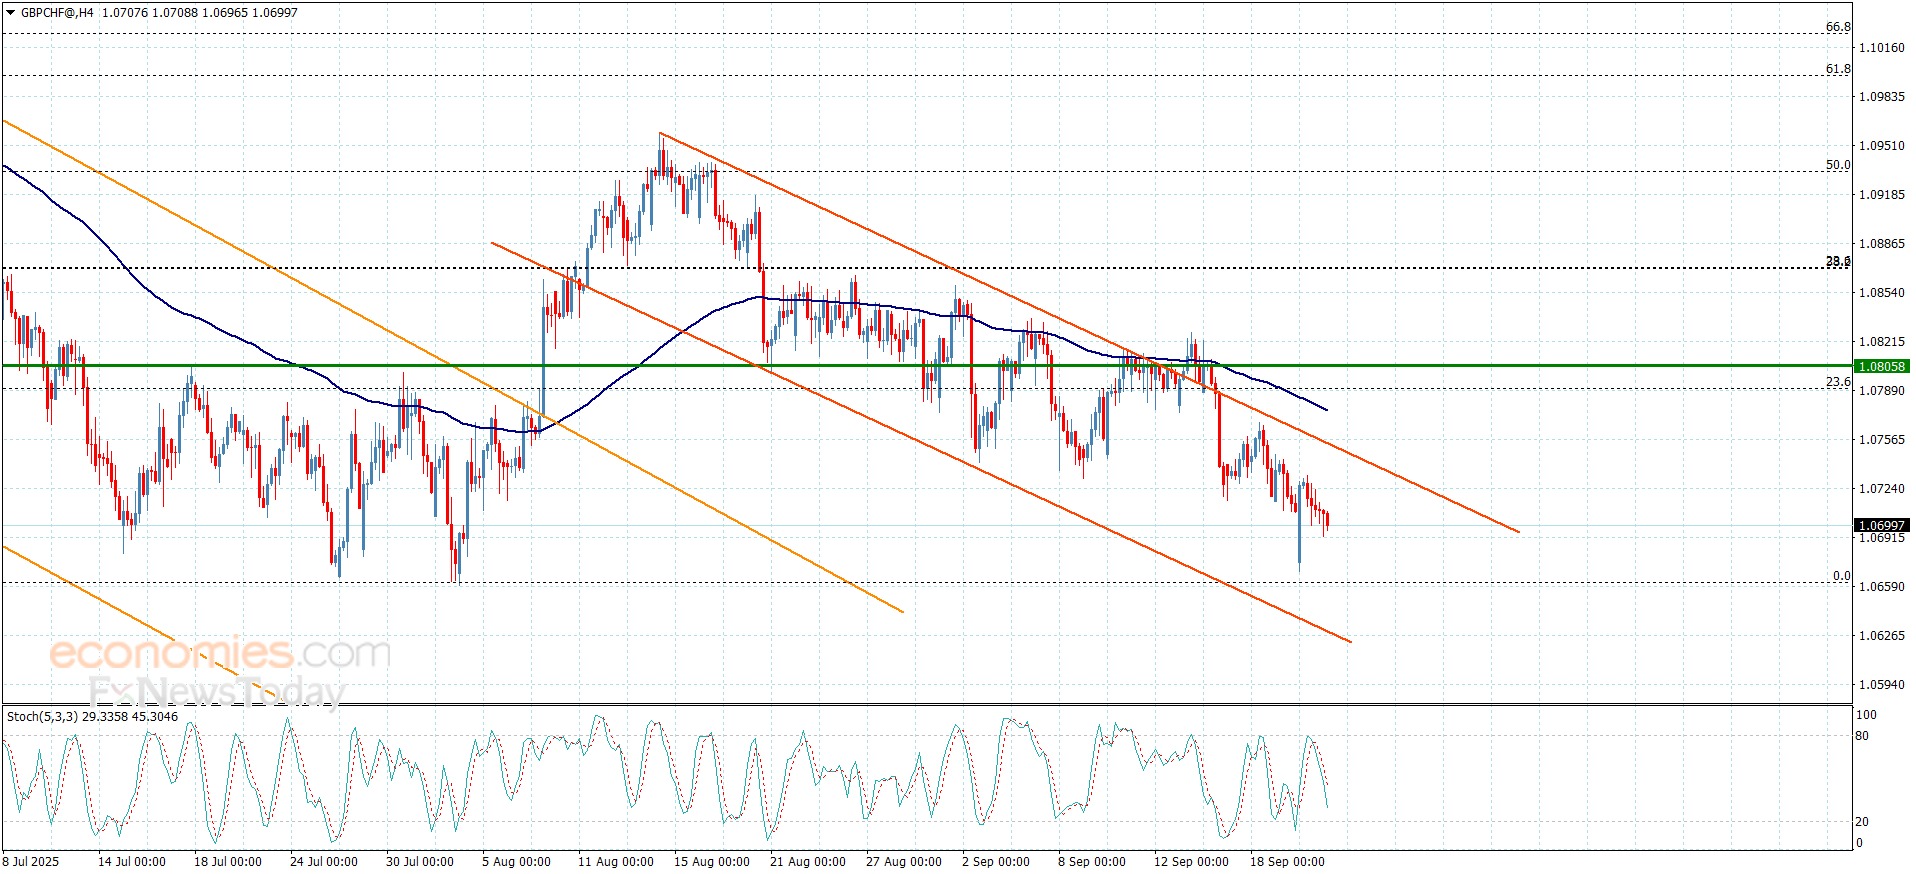
The GBPCHF provided several negative trading, affected by its stability below the main bearish channel’s resistance at 1.0748, suffering some losses by hitting 1.0670 level, then forming correctional trading by its stability near 1.0705.
Note that the continuation of providing positive momentum by the main indicators will increase the chances of forming new bearish waves, attempting to press on the barrier at 1.0660, and breaking it will extend the losses towards 1.0630, to face the support of bearish channel that appears in the above image.
The expected trading range for today is between 1.0720 and 1.0660
Trend forecast: Bearish
Copper price provided slow trading despite the presence of the positive factors, such as the main stability within the bullish channel’s levels by forming main support at $4.1100 level, besides the continuation of providing bullish momentum by the main indicators, specifically by forming an extra support by the moving average 55 by its stability near $4.3700.
Therefore, we will keep preferring the bullish scenario, to expect surpassing the barrier at $4.6200, to rally towards the positive stations at $4.7500 and $4.9500.
The expected trading range for today is between $4.5000 and 4.7500
Trend forecast: Bullish