The main tag of Gold Price Articles.
You can use the search box below to find what you need.
[wd_asp id=1]
The main tag of Gold Price Articles.
You can use the search box below to find what you need.
[wd_asp id=1]
The EURJPY pair formed new bullish rally, to record the initial extra target at 174.25, then bounced quickly to retest the breached barrier, which represents a new support at 173.40.
The suggested scenario depends on the stability of the current support, as the price stability makes us expect renewing the bullish attempts to target new positive stations that begin at 175.20, while facing negative pressures and reaching below this support will increase the chances for activating the bearish correctional track again, which forces it to suffer some losses by reaching 172.80, followed by the support of the bullish channel at 171.15.
The expected trading range for today is between 173.40 and 175.20
Trend forecast: Bullish
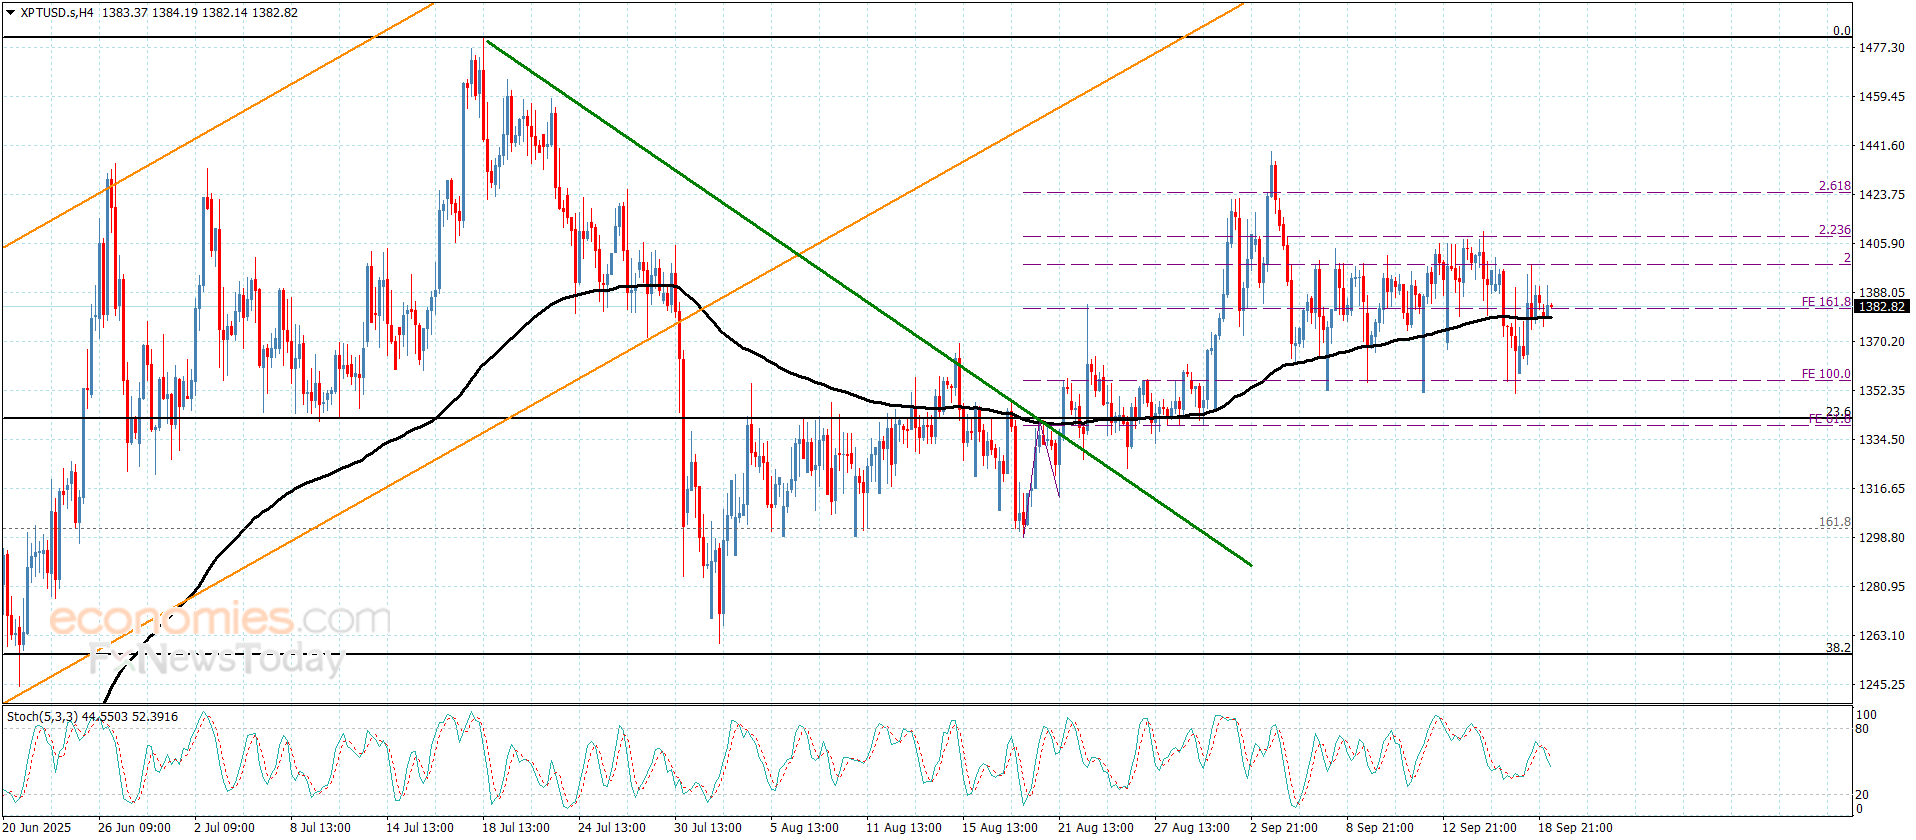
Platinum price remains under the effect of the sideways track, due to the continuation of the main indicators’ contradiction, especially by stochastic reach to 50 level, which forces it to delay the bullish attack and hold near the moving average 55 at $1382.00 level.
The stability of the price above the support at $1355.00 is important for confirming the continuation of the positivity, to keep waiting for gathering the positive momentum, to ease the mission of surpassing $1400.00 level, then begin recording the targets at $1422.00 and $1435.00.
The expected trading range for today is between $1370.00 and $1422.00
Trend forecast: Bullish
The Gold price (XAU/USD) trades in negative territory for the second consecutive day near $3,640 during the early Asian session on Friday. The precious metal edges lower after reaching a record high in the previous session due to some profit-taking and a firmer US Dollar (USD).
On Wednesday, the US Federal Reserve (Fed) cut the interest rates by 25 basis points (bps) and signaled two more reductions by the end of this year. This is the Fed’s first reduction this year and puts the target range for its main lending rate at 4.0% – 4.25%.
Fed Chair Jerome Powell indicated that the latest move to lower interest rates was a risk management cut and added that he doesn’t feel the need to move quickly on rates. A less dovish stance from the US central bank provides some support to the Greenback and weighs on the USD-denominated commodity price in the near term.
“Investors judged the Fed’s guidance less dovish than anticipated,” said MUFG analyst Soojin Kim. “Chair Powell highlighted tariff-driven inflation risks and stressed a ‘meeting-by-meeting’ approach to further cuts, sending the dollar higher,” Kim added.
On the other hand, escalating geopolitical tensions in the Middle East could boost the yellow metal, a traditional safe-haven asset. Israeli media reports indicated the military is preparing for a major ground incursion into Gaza City. For weeks, Israel has been laying the groundwork for such an operation, urging civilians to evacuate to designated humanitarian areas like Al-Mawasi.
Gold has played a key role in human’s history as it has been widely used as a store of value and medium of exchange. Currently, apart from its shine and usage for jewelry, the precious metal is widely seen as a safe-haven asset, meaning that it is considered a good investment during turbulent times. Gold is also widely seen as a hedge against inflation and against depreciating currencies as it doesn’t rely on any specific issuer or government.
Central banks are the biggest Gold holders. In their aim to support their currencies in turbulent times, central banks tend to diversify their reserves and buy Gold to improve the perceived strength of the economy and the currency. High Gold reserves can be a source of trust for a country’s solvency. Central banks added 1,136 tonnes of Gold worth around $70 billion to their reserves in 2022, according to data from the World Gold Council. This is the highest yearly purchase since records began. Central banks from emerging economies such as China, India and Turkey are quickly increasing their Gold reserves.
Gold has an inverse correlation with the US Dollar and US Treasuries, which are both major reserve and safe-haven assets. When the Dollar depreciates, Gold tends to rise, enabling investors and central banks to diversify their assets in turbulent times. Gold is also inversely correlated with risk assets. A rally in the stock market tends to weaken Gold price, while sell-offs in riskier markets tend to favor the precious metal.
The price can move due to a wide range of factors. Geopolitical instability or fears of a deep recession can quickly make Gold price escalate due to its safe-haven status. As a yield-less asset, Gold tends to rise with lower interest rates, while higher cost of money usually weighs down on the yellow metal. Still, most moves depend on how the US Dollar (USD) behaves as the asset is priced in dollars (XAU/USD). A strong Dollar tends to keep the price of Gold controlled, whereas a weaker Dollar is likely to push Gold prices up.
“Copper demand for green infrastructure may rise by over 15% by 2025, driving significant price volatility across global markets.”
Copper, often dubbed the “metal of civilization”, continues to play a critical role in our evolving world. As we advance into 2025, the copper price 2025 trend has become a focal point for a wide range of industries due to its extensive applications in agriculture, infrastructure, electrical wiring, construction materials, irrigation systems, and advanced technologies.
Unprecedented supply-demand dynamics, geopolitical events, and a global push towards renewable energy and sustainable practices have combined to create both opportunity and volatility in the copper market.
In this detailed outlook, we’ll examine the current copper price trend 2025, drivers influencing copper price 2025 trend, the impact on agriculture and infrastructure sectors, and the copper price forecast end 2025. This guide also offers insights on industry adaptation, using real-world data and Farmonaut’s expertise in satellite-driven sectoral monitoring.
As of mid-2025, the current copper price trend 2025 is marked by notable volatility. After surpassing $10,000 per metric ton in late 2024, copper prices stabilized around the $9,200 per metric ton mark—still notably above historical averages. These peaks and subsequent stabilization were driven largely by supply disruptions in major producing countries like Chile and Peru, which together account for nearly 40% of global copper output.
Investors, governments, and sector stakeholders now closely monitor copper’s price trajectory, recognizing its direct implications for project budgets, technology adoption, and overall competitiveness in 2025 and the years beyond.
“Forecasts show agriculture could face up to 10% higher input costs if copper prices surge in 2025.”
Downside risks remain present in the form of:

The copper price 2025 trend is driven by a complicated set of factors that intertwine market fundamentals, policy decisions, technological shifts, and global economic dynamics. To understand why copper remains highly valued and volatile, it’s essential to unpack these major drivers:


The ripple effects of the copper price 2025 trend resonate across agriculture and infrastructure. These two sectors, fundamental to economic development and human well-being, are directly shaped by global copper supply, price volatility, and changing demand patterns.


The copper price forecast end 2025 remains cautiously optimistic amid potential headwinds. While new mining sites are expected to ramp up output, several powerful trends continue to sustain higher price levels:
For farmers, builders, and government agencies, this copper price 2025 trend underscores the importance of forward-thinking planning, technology integration, and supply chain resilience.

By embedding copper trend analysis into long-term portfolio and project management, industry stakeholders can better anticipate cost pressures and mitigate risks due to market shocks.
Emerging technology is integral to understanding copper’s supply chain dynamics, demand shifts, and sectoral influence. At Farmonaut, we harness satellite technology, AI, and blockchain to deliver real-time insights for agriculture, mining, and infrastructure stakeholders.
Learn more: Farmonaut Platform
For developers and businesses aiming to integrate satellite and resource tracking solutions, access the Farmonaut Satellite API and see the API Developer Docs.
| Year | Estimated Copper Price (USD/ton) | Agriculture Sector Impact | Infrastructure Sector Impact |
|---|---|---|---|
| 2023 | $8,400 |
Usage: ~2.1 million MT
Modernization pace steady; initial adoption of electrified irrigation and smart sensors. Price volatility starts increasing. |
Usage: ~13 million MT
Major global infrastructure projects initiated; budget constraints moderate. |
| 2024 | $9,800 |
Usage: ~2.3 million MT
Heightened adoption of electrification in machinery and irrigation due to regulatory incentives. Input costs rise significantly. |
Usage: ~14 million MT
Infrastructure spending spike, smart city pilots rise. Supply disruptions in Chile/Peru affect cost and scheduling. |
| 2025 (Est.) | $9,200 |
Usage: ~2.5 million MT
Precision agriculture, renewable-powered irrigation, and advanced monitoring expand copper needs. Estimated 10% increase in agri input costs if prices surge. |
Usage: ~15 million MT
Large-scale utility/grid electrification, EV infrastructure, enhanced water resource projects drive demand. Strategic planning vital for cost management. |
Unlock real-time copper supply, agricultural activity, and infrastructure monitoring with affordable, scalable Farmonaut plans:
The copper price 2025 trend is primarily driven by sustained demand from green infrastructure, agricultural modernization, and supply constraints in major mining countries. Environmental regulations, labor issues, and technological advancements also influence pricing.
Analyst forecasts expect copper to remain elevated, trading between $8,800 and $9,500 per metric ton by end of 2025. Spikes above $10,000 are possible if significant supply disruptions occur.
Agriculture faces higher input costs for irrigation and electrified farm equipment, with precision technologies raising overall copper demand. Strategically managing copper purchases and leveraging technology like Farmonaut can help offset rising expenses.
Infrastructure projects—like power grids, transportation, and water management—are copper-intensive. As governments worldwide ramp up investment, demand for copper grows, influencing global pricing.
Farmonaut’s platform enables real-time monitoring of agricultural fields, mining sites, and infrastructure, providing actionable insights to help businesses optimize usage and adapt to copper price volatility. Blockchain traceability adds transparency and risk reduction across the supply chain.
Risks include further supply disruptions, stricter environmental regulations, global economic slowdowns, and the limited but evolving risk of copper alternatives. Strategic planning and smart resource management are key to resilience.
The copper price 2025 trend illustrates a market in transformation. Sustained demand from agriculture and infrastructure, tempered by supply constraints and evolving market dynamics, ensures copper’s critical role as the metal of civilization remains secure. For sector stakeholders, adapting to fluctuations requires an integrated approach—leveraging technology, optimizing investments, and proactively managing risks.
Farmonaut stands ready to empower businesses, governments, and individual users with affordable satellite-based insights, AI advisory, and digital supply chain solutions. By monitoring copper price trends, enhancing operational agility, and driving sustainability, we enable you to respond effectively to 2025’s challenges and opportunities.
Stay ahead of copper price 2025 trend with the latest intelligence, only on Farmonaut.
You have reached your limit of 5 free articles for this month.
Elevate your trading Journey.
Your coupon code
Spot Gold extends its slide on Thursday, bottoming during American trading hours at $3,627.98. The US Dollar (USD) gathered near-term momentum following the release of encouraging United States (US) data.
The country reported that Initial Jobless Claims for the week ended September 13 rose by 231K, better than the 240K anticipated and easing from the previous 264K. Additionally, the Philadelphia Fed Manufacturing Survey surged to 23.2 from the previous -0.3 while largely surpassing the expected 2.3.
Other than that, Gold eases on the back of increased demand for high-yielding assets. Wall Street trades in the green, with the Dow Jones Industrial Average (DJIA) reaching fresh record highs in pre-opening trading. American indexes advance on the back of the Federal Reserve (Fed) decision to cut interest rates following its September meeting.
Officials suggested similar cuts will come in October and December, as the dot-plot showed two more rate cuts in the docket for 2025, and one more for 2026. As a result, equities surged on the back of easing borrowing costs.
Meanwhile, the Bank of England (BoE) decided to keep its benchmark rate on hold at 4% early Thursday, as widely anticipated. Policymakers voted 7-2 to keep rates on hold, also meeting expectations. The event, which included no fresh forecast or a press conference, had no impact on financial markets.
The central banks’ week will end with the Bank of Japan (BoJ) announcing its decision on monetary policy early on Friday. The central bank is expected to hold its fire this time and keep interest rates at 0.5%, but rate hikes are in the docket for future meetings amid hawkish comments from BoJ officials.
The daily chart for the XAU/USD pair shows it is down for a second consecutive day, hovering in the $3,640 region. The decline is modest and seems corrective in the medium term, as technical indicators in the mentioned time frame eased from their extreme peaks but remain close to overbought readings. At the same time, the pair develops far above all its moving averages, with the 20 Simple Moving Average (SMA) heading firmly north at around $3,547, in line with the dominant bullish trend. The weekly low at $3,626.66 is the immediate support level, with a clear downward extension below it, opening the door for additional slides.
The near-term picture for the bright metal is bearish. The 4-hour chart shows that a mildly bullish 20 SMA cap advances, currently at around $3,675.00, while the Momentum indicator heads south almost vertically, well below its 100 line. The Relative Strength Index (RSI) indicator also aims lower within negative levels at around 43, supportive on another leg south. Finally, the 100 and 200 SMAs maintain their bullish slopes far below the current level, confirming the slide remains corrective and there’s a long way to go before Gold changes course.
Support levels: 3,626.70 3,611.70 3,600.00
Resistance levels: 3,655.90 3,675.00 3,693.40
Spot Gold extends its slide on Thursday, bottoming during American trading hours at $3,627.98. The US Dollar (USD) gathered near-term momentum following the release of encouraging United States (US) data.
The country reported that Initial Jobless Claims for the week ended September 13 rose by 231K, better than the 240K anticipated and easing from the previous 264K. Additionally, the Philadelphia Fed Manufacturing Survey surged to 23.2 from the previous -0.3 while largely surpassing the expected 2.3.
Other than that, Gold eases on the back of increased demand for high-yielding assets. Wall Street trades in the green, with the Dow Jones Industrial Average (DJIA) reaching fresh record highs in pre-opening trading. American indexes advance on the back of the Federal Reserve (Fed) decision to cut interest rates following its September meeting.
Officials suggested similar cuts will come in October and December, as the dot-plot showed two more rate cuts in the docket for 2025, and one more for 2026. As a result, equities surged on the back of easing borrowing costs.
Meanwhile, the Bank of England (BoE) decided to keep its benchmark rate on hold at 4% early Thursday, as widely anticipated. Policymakers voted 7-2 to keep rates on hold, also meeting expectations. The event, which included no fresh forecast or a press conference, had no impact on financial markets.
The central banks’ week will end with the Bank of Japan (BoJ) announcing its decision on monetary policy early on Friday. The central bank is expected to hold its fire this time and keep interest rates at 0.5%, but rate hikes are in the docket for future meetings amid hawkish comments from BoJ officials.
The daily chart for the XAU/USD pair shows it is down for a second consecutive day, hovering in the $3,640 region. The decline is modest and seems corrective in the medium term, as technical indicators in the mentioned time frame eased from their extreme peaks but remain close to overbought readings. At the same time, the pair develops far above all its moving averages, with the 20 Simple Moving Average (SMA) heading firmly north at around $3,547, in line with the dominant bullish trend. The weekly low at $3,626.66 is the immediate support level, with a clear downward extension below it, opening the door for additional slides.
The near-term picture for the bright metal is bearish. The 4-hour chart shows that a mildly bullish 20 SMA cap advances, currently at around $3,675.00, while the Momentum indicator heads south almost vertically, well below its 100 line. The Relative Strength Index (RSI) indicator also aims lower within negative levels at around 43, supportive on another leg south. Finally, the 100 and 200 SMAs maintain their bullish slopes far below the current level, confirming the slide remains corrective and there’s a long way to go before Gold changes course.
Support levels: 3,626.70 3,611.70 3,600.00
Resistance levels: 3,655.90 3,675.00 3,693.40
Silver (XAG/USD) trims earlier intraday losses on Thursday, recovering from a five-day low marked on Wednesday in the aftermath of the Federal Reserve’s (Fed) interest rate cut decision. At the time of writing, the white metal is trading near $41.81, rebounding from an intraday trough of $41.20.
The move reflects dip-buying interest around familiar support zones, despite a firm US Dollar (USD), as broader sentiment remains cautious following a sharp pullback from record highs on Wednesday.
On the 4-hour chart, the $41.50 region has emerged as a critical support zone, highlighted by repeated lower wicks showing buyers stepping in to defend the level. Price action is currently flirting with the 50-period Simple Moving Average (SMA) at $41.78, which has aligned with this area to form a strong short-term floor. A clear break below this level could expose the next support base around $40.50.
Resistance remains layered above, with the 21-period SMA at $42.16 acting as the first barrier to recovery. A push through this level would bring $42.50 into play, followed by a potential retest of the fresh 14-year high at $42.97. A sustained break beyond that milestone could expose the psychological $43.50 handle and open the path for further gains.
The Relative Strength Index (RSI) is hovering near 47 after cooling from overbought conditions. A move back above the 50 midline would hint at renewed bullish pressure, while a drop under 45 could reinforce the case for another leg lower. For now, Silver appears locked in a range, with $41.50 providing support and the $42.00-42.20 zone capping the upside.
Silver is a precious metal highly traded among investors. It has been historically used as a store of value and a medium of exchange. Although less popular than Gold, traders may turn to Silver to diversify their investment portfolio, for its intrinsic value or as a potential hedge during high-inflation periods. Investors can buy physical Silver, in coins or in bars, or trade it through vehicles such as Exchange Traded Funds, which track its price on international markets.
Silver prices can move due to a wide range of factors. Geopolitical instability or fears of a deep recession can make Silver price escalate due to its safe-haven status, although to a lesser extent than Gold’s. As a yieldless asset, Silver tends to rise with lower interest rates. Its moves also depend on how the US Dollar (USD) behaves as the asset is priced in dollars (XAG/USD). A strong Dollar tends to keep the price of Silver at bay, whereas a weaker Dollar is likely to propel prices up. Other factors such as investment demand, mining supply – Silver is much more abundant than Gold – and recycling rates can also affect prices.
Silver is widely used in industry, particularly in sectors such as electronics or solar energy, as it has one of the highest electric conductivity of all metals – more than Copper and Gold. A surge in demand can increase prices, while a decline tends to lower them. Dynamics in the US, Chinese and Indian economies can also contribute to price swings: for the US and particularly China, their big industrial sectors use Silver in various processes; in India, consumers’ demand for the precious metal for jewellery also plays a key role in setting prices.
Silver prices tend to follow Gold’s moves. When Gold prices rise, Silver typically follows suit, as their status as safe-haven assets is similar. The Gold/Silver ratio, which shows the number of ounces of Silver needed to equal the value of one ounce of Gold, may help to determine the relative valuation between both metals. Some investors may consider a high ratio as an indicator that Silver is undervalued, or Gold is overvalued. On the contrary, a low ratio might suggest that Gold is undervalued relative to Silver.
Spot Gold extends its slide on Thursday, bottoming during American trading hours at $3,627.98. The US Dollar (USD) gathered near-term momentum following the release of encouraging United States (US) data.
The country reported that Initial Jobless Claims for the week ended September 13 rose by 231K, better than the 240K anticipated and easing from the previous 264K. Additionally, the Philadelphia Fed Manufacturing Survey surged to 23.2 from the previous -0.3 while largely surpassing the expected 2.3.
Other than that, Gold eases on the back of increased demand for high-yielding assets. Wall Street trades in the green, with the Dow Jones Industrial Average (DJIA) reaching fresh record highs in pre-opening trading. American indexes advance on the back of the Federal Reserve (Fed) decision to cut interest rates following its September meeting.
Officials suggested similar cuts will come in October and December, as the dot-plot showed two more rate cuts in the docket for 2025, and one more for 2026. As a result, equities surged on the back of easing borrowing costs.
Meanwhile, the Bank of England (BoE) decided to keep its benchmark rate on hold at 4% early Thursday, as widely anticipated. Policymakers voted 7-2 to keep rates on hold, also meeting expectations. The event, which included no fresh forecast or a press conference, had no impact on financial markets.
The central banks’ week will end with the Bank of Japan (BoJ) announcing its decision on monetary policy early on Friday. The central bank is expected to hold its fire this time and keep interest rates at 0.5%, but rate hikes are in the docket for future meetings amid hawkish comments from BoJ officials.
The daily chart for the XAU/USD pair shows it is down for a second consecutive day, hovering in the $3,640 region. The decline is modest and seems corrective in the medium term, as technical indicators in the mentioned time frame eased from their extreme peaks but remain close to overbought readings. At the same time, the pair develops far above all its moving averages, with the 20 Simple Moving Average (SMA) heading firmly north at around $3,547, in line with the dominant bullish trend. The weekly low at $3,626.66 is the immediate support level, with a clear downward extension below it, opening the door for additional slides.
The near-term picture for the bright metal is bearish. The 4-hour chart shows that a mildly bullish 20 SMA cap advances, currently at around $3,675.00, while the Momentum indicator heads south almost vertically, well below its 100 line. The Relative Strength Index (RSI) indicator also aims lower within negative levels at around 43, supportive on another leg south. Finally, the 100 and 200 SMAs maintain their bullish slopes far below the current level, confirming the slide remains corrective and there’s a long way to go before Gold changes course.
Support levels: 3,626.70 3,611.70 3,600.00
Resistance levels: 3,655.90 3,675.00 3,693.40
Gold is licking its wounds near $3,650 in Thursday’s Asian trades, having stalled its pullback from fresh record highs of $3,707 reached in an initial reaction to the US Federal Reserve (Fed) policy announcements.
Gold witnessed intense volatility during the Fed event on Wednesday, initially spiking to a new lifetime high before falling as low as $3,646 to settle the day just above $3,650.
Fed delivered on the expected 25 basis points (bps) interest rate cut but the Summary of Economic Projections (SEP), the so-called Dot Plot chart, showed that the Fed policymakers project two additional rate cuts this year.
Markets read this as dovish and smashed the US Dollar (USD) across the board, spiking up Gold to new record highs.
However, the Greenback staged an impressive comeback alongside US Treasury bond yields after Fed Chairman Jerome Powell, in his post-policy meeting press conference, adopted a measured rhetoric on further policy easing.
Powell signaled caution on future rate cut outlook by saying that “the policy action as a risk-management cut in response to the weakening labour market and the central bank is in a ‘meeting-by-meeting’ situation,” per Reuters.
The resurgent USD demand and the Fed’s restraint triggered a pullback in the non-yielding Gold.
Traders are now pricing in a 87.7% chance of another 25 bps cut at the Fed’s October meeting, compared to a 74.3% probability a day earlier, according to the CME Group’s FedWatch tool.
With the dovish expectations surrounding the Fed still intact, any downside in Gold is likely to be seen as a good bargain-buying opportunity, keeping the uptrend alive.
Markets now look forward to the mid-tier US Jobless Claims data for fresh trading impetus.
Additionally, geopolitical headlines and US President Donald Trump’s commentary could also play their part in driving Gold price action in the sessions ahead.
The daily chart shows that Gold buyers seem to be given another chance for a sustained uptrend as the 14-day Relative Strength Index (RSI) has finally eased considerably from the extreme overbought zone, from 80 to 72 levels, as of writing.
If dip-buying emerges and gathers strength, Gold could retest the record high at $3,708. A daily candlestick closing above that level will open doors toward the $3,750 region.
However, Gold could challenge this week’s low at $3,627 if the corrective decline extends.
Further down, the $3,600 round figure will be tested, below which the previous week’s low of $3,578 will be next on sellers’ radars.
Gold has played a key role in human’s history as it has been widely used as a store of value and medium of exchange. Currently, apart from its shine and usage for jewelry, the precious metal is widely seen as a safe-haven asset, meaning that it is considered a good investment during turbulent times. Gold is also widely seen as a hedge against inflation and against depreciating currencies as it doesn’t rely on any specific issuer or government.
Central banks are the biggest Gold holders. In their aim to support their currencies in turbulent times, central banks tend to diversify their reserves and buy Gold to improve the perceived strength of the economy and the currency. High Gold reserves can be a source of trust for a country’s solvency. Central banks added 1,136 tonnes of Gold worth around $70 billion to their reserves in 2022, according to data from the World Gold Council. This is the highest yearly purchase since records began. Central banks from emerging economies such as China, India and Turkey are quickly increasing their Gold reserves.
Gold has an inverse correlation with the US Dollar and US Treasuries, which are both major reserve and safe-haven assets. When the Dollar depreciates, Gold tends to rise, enabling investors and central banks to diversify their assets in turbulent times. Gold is also inversely correlated with risk assets. A rally in the stock market tends to weaken Gold price, while sell-offs in riskier markets tend to favor the precious metal.
The price can move due to a wide range of factors. Geopolitical instability or fears of a deep recession can quickly make Gold price escalate due to its safe-haven status. As a yield-less asset, Gold tends to rise with lower interest rates, while higher cost of money usually weighs down on the yellow metal. Still, most moves depend on how the US Dollar (USD) behaves as the asset is priced in dollars (XAU/USD). A strong Dollar tends to keep the price of Gold controlled, whereas a weaker Dollar is likely to push Gold prices up.
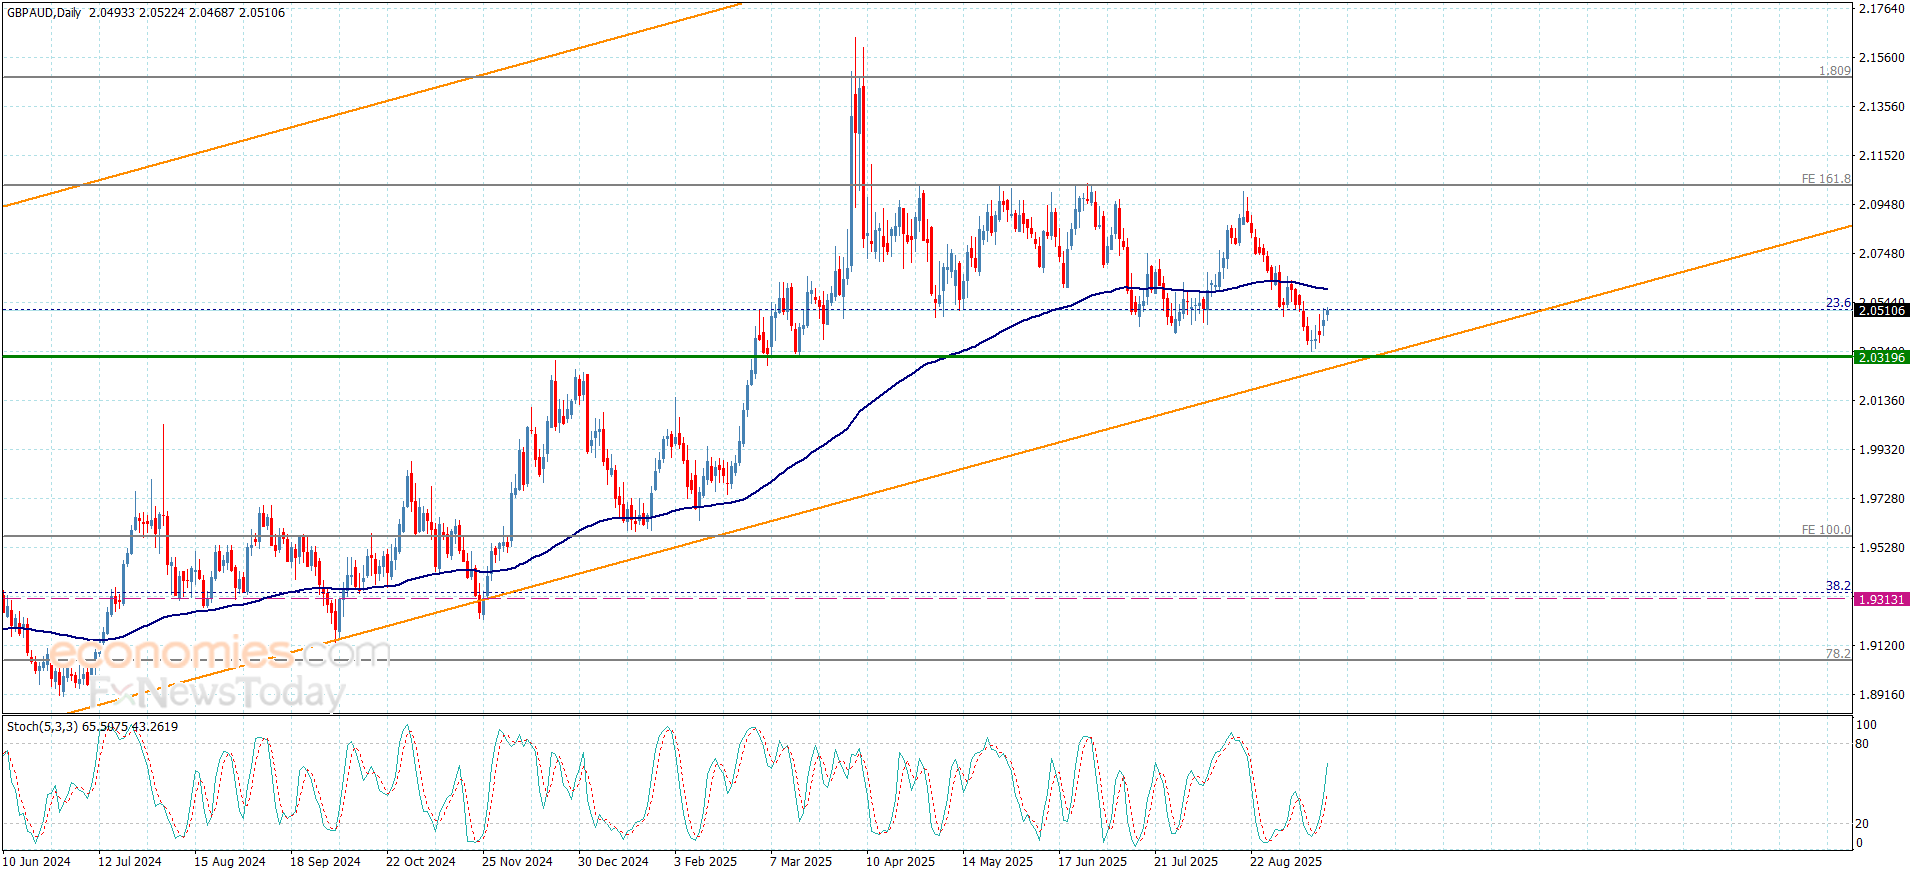
The GBPAUD confirmed the stability of the bullish scenario by providing positive close above the support of the bullish channel at 2.0260, taking advantage of providing positive momentum by stochastic, to notice its rally towards 2.0610, attempting to surpass 23.6%Fibonacci correction level.
The continuation of facing the positive pressures will ease the mission of surpassing the moving average 55 near 2.0610, opening the way for recording several gains that might extend towards 2.0695 and 2.0765.
The expected trading range for today is between 2.0465 and 2.0610
Trend forecast: Bullish
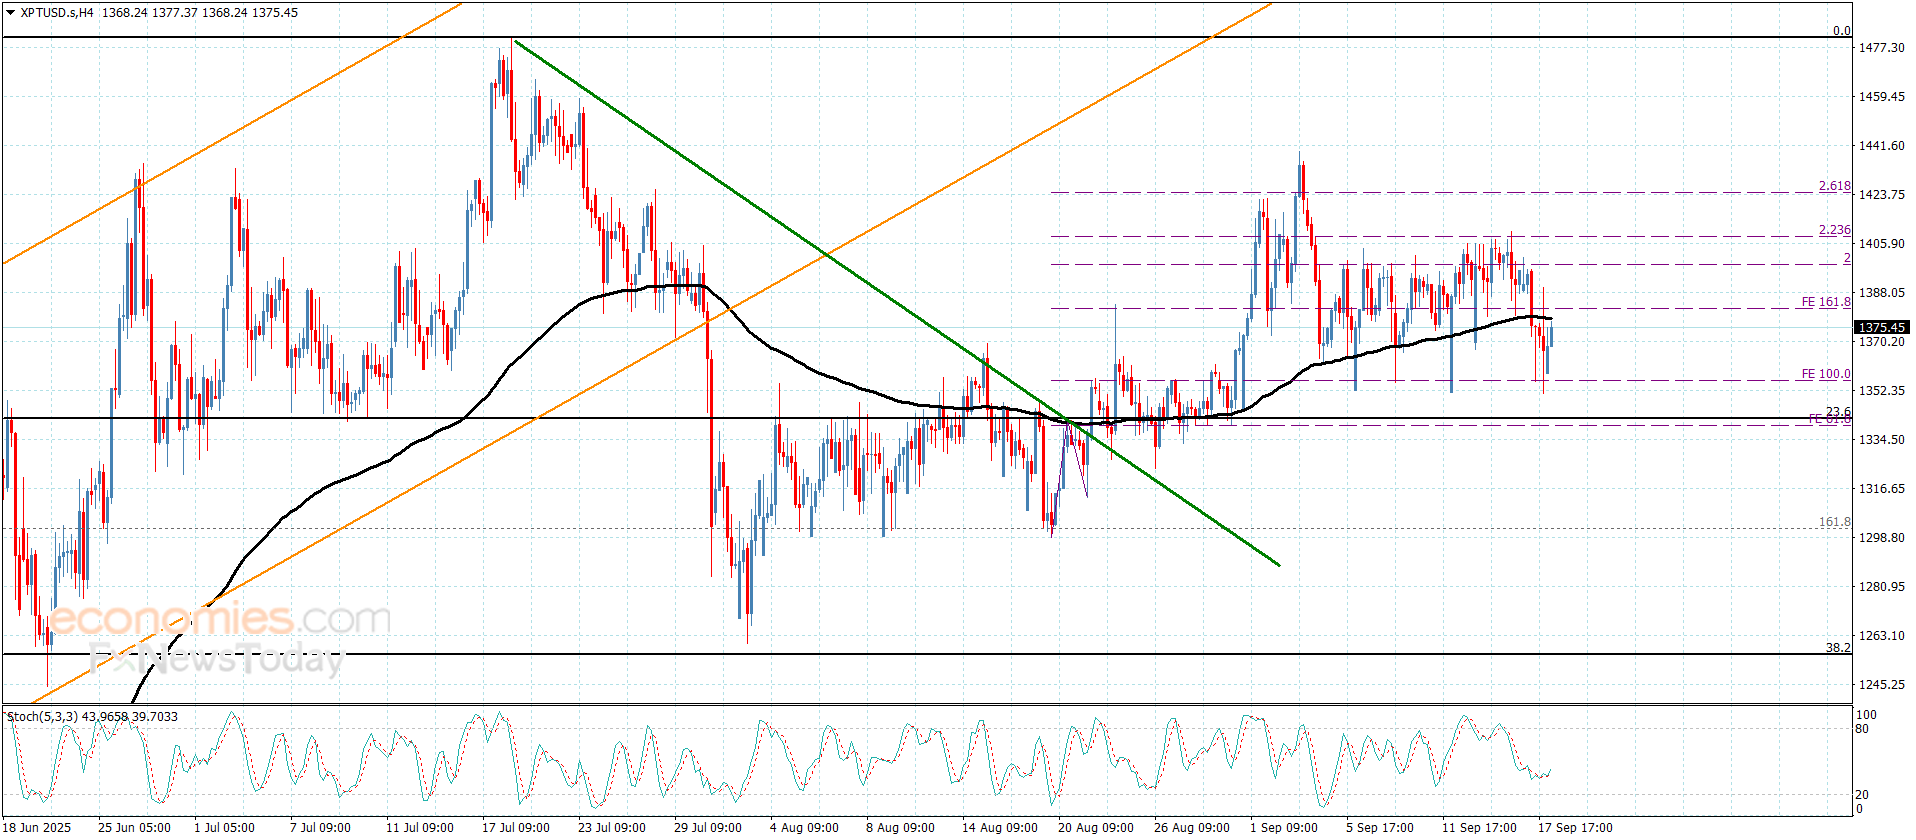
Platinum price is affected by the contradiction between the main indicators, which forces it to delay the bullish attack by reaching below $1400,00, to provide mixed trading to keep its stability main stability above the critical support at $1355.00.
We expect the continuation of forming mixed trading until gathering the positive momentum, to pave the way for holding above $1400.00, to begin recording extra gains that might begin at $1435.00, while the decline below the critical support and holding below it will force the price to activate the negative track, which forces it to suffer several losses by reaching $1315.00 and $1300.00.
The expected trading range for today is between $1355.00 and $1395.00
Trend forecast: Fluctuated within the bullish trend