The main tag of Gold Price Articles.
You can use the search box below to find what you need.
[wd_asp id=1]
The main tag of Gold Price Articles.
You can use the search box below to find what you need.
[wd_asp id=1]
Silver’s (XAG/USD) is trying to break long-terrm highs at $42.75 on Tuesday’s Early European session, favoured by broad-based US Dollar weakness, as the market braces for a “dovish cut” at the end of a two-day Fed monetary policy meeting on Wednesday.
Precious metals have been thriving in recent days with investors pricing in a series of rate cuts by the Federal Reserve in the coming months, starting with a quarter-point cut on Wednesday.
The US Dollar Index, which measures the value of the US dollar against a basket of currencies, is testing two-month lows, just above 97.00, after depreciating nearly 1% from last week’s highs.
The technical pìcture is bullish, Momentum indicators show overbought levels on intra-day charts –the 4-hour RSI is above 70, but US Dollar weakness keeps downside attempts limited.
To the upside, above the mentioned $42.75 resistance area, the $43.00 psychological level might hold bulls ahead of the 261.8% retracement of the September 8 rally, at $43.50.
The pair has solid support at a previous resistance in the area of $42.50. Below here, the September 14 and 15 low, at $42.00, and the September 8 high, at $41.65, would come into focus.
(This story was corrected on September 16 at 11:45 GMT to say that the $42.75 level is a long-term high, and not an all-time high, as previously stated.)
Silver is a precious metal highly traded among investors. It has been historically used as a store of value and a medium of exchange. Although less popular than Gold, traders may turn to Silver to diversify their investment portfolio, for its intrinsic value or as a potential hedge during high-inflation periods. Investors can buy physical Silver, in coins or in bars, or trade it through vehicles such as Exchange Traded Funds, which track its price on international markets.
Silver prices can move due to a wide range of factors. Geopolitical instability or fears of a deep recession can make Silver price escalate due to its safe-haven status, although to a lesser extent than Gold’s. As a yieldless asset, Silver tends to rise with lower interest rates. Its moves also depend on how the US Dollar (USD) behaves as the asset is priced in dollars (XAG/USD). A strong Dollar tends to keep the price of Silver at bay, whereas a weaker Dollar is likely to propel prices up. Other factors such as investment demand, mining supply – Silver is much more abundant than Gold – and recycling rates can also affect prices.
Silver is widely used in industry, particularly in sectors such as electronics or solar energy, as it has one of the highest electric conductivity of all metals – more than Copper and Gold. A surge in demand can increase prices, while a decline tends to lower them. Dynamics in the US, Chinese and Indian economies can also contribute to price swings: for the US and particularly China, their big industrial sectors use Silver in various processes; in India, consumers’ demand for the precious metal for jewellery also plays a key role in setting prices.
Silver prices tend to follow Gold’s moves. When Gold prices rise, Silver typically follows suit, as their status as safe-haven assets is similar. The Gold/Silver ratio, which shows the number of ounces of Silver needed to equal the value of one ounce of Gold, may help to determine the relative valuation between both metals. Some investors may consider a high ratio as an indicator that Silver is undervalued, or Gold is overvalued. On the contrary, a low ratio might suggest that Gold is undervalued relative to Silver.
The U.S. shale patch is trimming capital expenditure budgets to preserve cash amid the lower oil prices. American producers could further cut back on spending and activity if the prevailing forecasts of a global oversupply materialize in the coming months.
Efficiency gains allow companies to pump more or equal volumes of crude with the same or reduced expenses.
The pullback in activity – the number of operating rigs and frac crews has crumbled in recent months – is not showing yet in the U.S. oil production figures. The shale patch is now in the lag window of a few months before the price decline shows up in output.
Efficiency gains are also pushing back production declines, but if the glut hits the global market and prices plunge in the $50s per barrel, the U.S. shale industry will likely curb drilling activity and cut capital budgets even more.
The market consensus appears to be that the strong summer demand is at its peak, and come the fourth quarter, global oil consumption will slow, and rising supply will overwhelm the market.
Growing supply from OPEC+ and higher output from South America will tip the market balance into oversupply toward the end of the year, analysts say.
Despite geopolitical risks, Wall Street banks have lowered their oil price forecasts for later this year and the first quarter of 2026, expecting the glut to depress prices.
Related: Oil Industry Gains Ground in California Regulatory Battle
Major investment banks, including Goldman Sachs, Morgan Stanley, and JPMorgan, see Brent Crude prices averaging $63.57 per barrel in the fourth quarter, a survey compiled by The Wall Street Journal showed this week. The projection is down from $64.13 expected in July and down from the Friday prompt price of about $68 a barrel.
For WTI Crude, the banks expect the price to average just above $60 per barrel, at $60.30, in the fourth quarter, down from last month’s $61.11 a barrel and down compared to the current price of about $64 a barrel.
Oil prices are set to further drop in the first quarter of 2026, with Brent at $62.73 and WTI at $59.65 per barrel, according to the Journal’s survey.
The glut will diminish by the third quarter of 2026, the banks reckon, as excess supply shocks are absorbed during next summer’s peak demand period.
But banks, analysts, and market participants expect oil supply to outstrip demand over the next six months, putting additional downward pressure on prices. This would make U.S. shale producers even more cautious with spending and budgets because a dip below $60 per barrel is threatening breakevens for drilling new wells.
The U.S. Energy Information Administration (EIA) is even more bearish than major banks in oil price projections.
The EIA expects in its latest Short-Term Energy Outlook (STEO) Brent to slump in the coming months, falling from $71 per barrel in July to average just $58 in the fourth quarter of 2025 and around $50 per barrel in early 2026.
Earlier this year, shale executives said that a $50 WTI price would result in declining U.S. crude production.
U.S. shale production will likely plateau if WTI prices remain in the low $60s per barrel, and decline at prices in the $50s, ConocoPhillips chairman and CEO Ryan Lance said in May.
Due to the OPEC+ supply hikes, global oil inventory builds will average more than 2 million barrels per day (bpd) in late 2025 and early 2026, which is 800,000 bpd more than in last month’s STEO.
“Low oil prices in early 2026 will lead to a reduction in supply by both OPEC+ and some non-OPEC producers, which we expect will help moderate inventory builds later in 2026,” the EIA said.
The administration expects Brent prices to average $51 a barrel next year, down from last month’s forecast of $58 a barrel.
Current growth in well productivity will push U.S. crude oil production to an all-time high near 13.6 million bpd in December 2025, the EIA said.
However, as crude oil prices fall, the EIA sees U.S. producers accelerating the decreases in drilling and well completion activity that have been ongoing through most of this year. As a result, U.S. crude oil production is set to decline from a record-high 13.6 million bpd at the end of this year to 13.1 million bpd by the fourth quarter of 2026.
Energy Intelligence forecasts U.S. shale to show greater resilience in the face of falling prices, expecting U.S. crude production to be flat at around 13.5 million bpd through the end of 2025, and closing 2026 at about 13.4 million bpd.
The actual U.S. production will depend on how large the expected oversupply will be and how low oil prices will dip, as well as to what extent efficiencies can offset a drop-off in drilling activity and budgets.
By Tsvetana Paraskova for Oilprice.com
More Top Reads From Oilprice.com
At 16:50 GMT, Natural Gas Futures are trading $3.004, up $0.063 or +2.14%.
Weather forecasts offer mixed signals for demand. NatGasWeather expects high pressure to dominate much of the U.S. this week, keeping highs in the 80s and 90s across the interior and Southwest. These conditions will boost cooling demand in the short term, though national demand is forecast to ease significantly over the weekend as northern states cool into the 60s and 70s.
This pattern translates to moderate demand early in the week, tapering off to light demand by the weekend — a setup that could cap rallies unless weather-driven demand persists longer than expected.
Supply remains a limiting factor for bullish sentiment. U.S. dry gas production continues to hover near 107 Bcf/d, keeping upward pressure on storage and tempering the impact of late-season heat.
The latest EIA storage report showed a 71 Bcf injection for the week ending September 5, bringing total inventories to 3,343 Bcf. While stocks remain 38 Bcf below last year, they sit 188 Bcf above the five-year average — a bearish overhang that looms over any short-term rallies unless demand materially exceeds expectations.
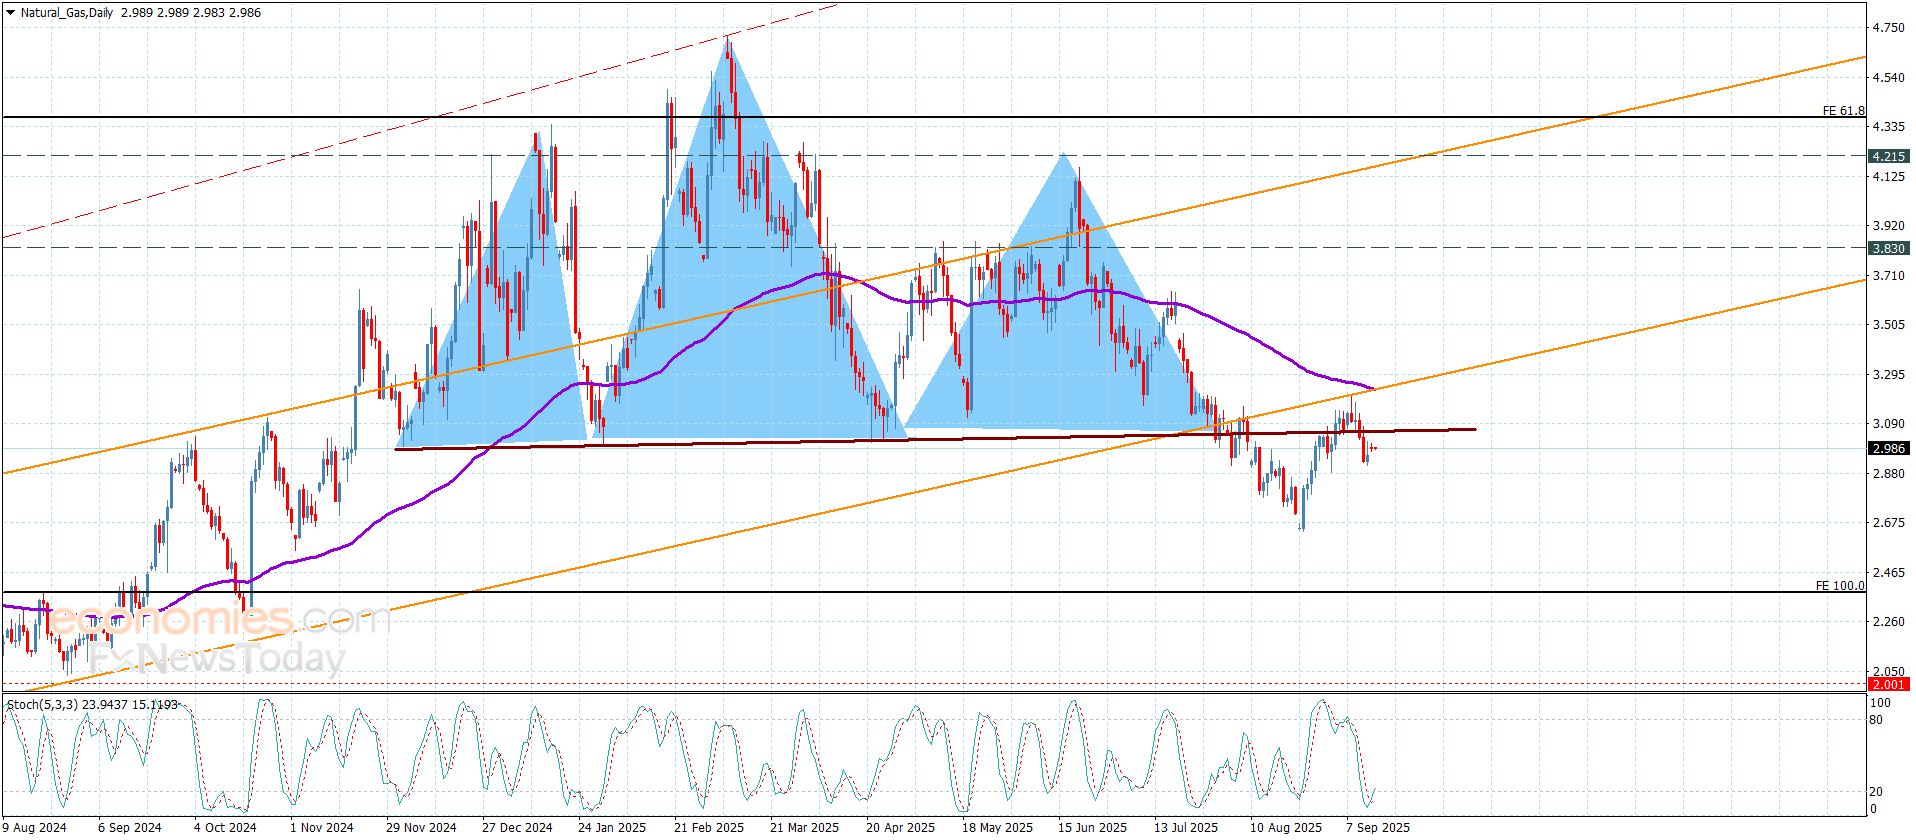
The short-term setup leans neutral-to-bearish with risks skewed lower if bulls fail to retake the $3.147 moving average. The defense of $2.887 was a critical hold, but without strong follow-through — particularly if weekend demand proves weak — prices could slip back toward $2.695.
Gold has paused its record run early Tuesday, as traders cash in on their long positions, gearing up for the top-tier US Retail Sales data and the US Federal Reserve (Fed) policy meeting, starting later in the day.
Despite the latest pullback, Gold’s bullish bias remains intact amid increased calls for aggressive easing by the Fed, in light of growing stagflation risks and the Senate confirmation of US President Donald Trump’s pick, Stephen Miran, as a Fed Governor.
Miran replaces Adrian Kuglar and will be on the Fed Board until January.
Meanwhile, Trump, in a social media post on Monday, called for Fed Chairman Jerome Powell to enact a “bigger” cut to benchmark interest rates.
Further, geopolitical and trade tensions continue to underpin the haven demand for the yellow metal.
Trump said late Monday that trade talks with China are still ongoing, adding that he is “undecided on the TikTok stake.”
The US president also “declared his intention to forcefully insert military forces under his control into cities that he personally deems require it,” per FXStreet’s Analyst Joshua Gibson.
Meanwhile, geopolitical tensions between Israel and Hamas intensify as Israeli Prime Minister Benjamin Netanyahu refused to rule out further attacks on Hamas leaders in foreign countries, following last week’s strike in Qatar.
Looking ahead, attention turns to the high-impact US Retail Sales data on Tuesday and the Fed policy announcements on Wednesday for a fresh directional impetus to Gold.
In the meantime, a brief profit-taking decline cannot be ruled out in Gold as markets resort to repositioning after the recent record rally and ahead of the Fed verdict.
The Fed is widely expected to cut fed fund rates by 25 basis points (bps) as the central bank grapples with a slowing labor market, stubborn inflation and an unprecedented push by US President Donald Trump for lower borrowing costs
Speculations are rife over a 50 bps rate cut, while markets are also betting on three rate cuts this year, beginning this week. Gold tends to benefit in a low-interest rate regime.
The daily chart shows that Gold buyers appear defiant even as the 14-day Relative Strength Index (RSI) remains in the extreme overbought zone, near 80.
On the upside, the $3,700 level is the immediate barrier to conquer, above which doors will open up toward the $3,750 region.
To the downside, the previous day’s low at $3,627 will offer some support on further pullback, below which the $3,600 round figure will be tested.
Sellers could target the previous week’s low of $3,578 on a decisive break below the $3,600 threshold.
The Retail Sales data, released by the US Census Bureau on a monthly basis, measures the value in total receipts of retail and food stores in the United States. Retail Sales measure the change in the total value of goods sold at the retail level during a year. Retail Sales data is widely followed as an indicator of consumer spending, which is a major driver of the US economy. A result higher than expected is typically viewed as positive or bullish for the USD, whereas a lower than expected result is considered negative or bearish for the USD.
Next release:
Tue Sep 16, 2025 12:30
Frequency:
Monthly
Consensus:
–
Previous:
3.9%
Source:
US Census Bureau
Natural Gas (NG=F) futures remain under heavy pressure, drifting around $2.94 per MMBtu after logging a 3.5% weekly decline. The latest U.S. Energy Information Administration (EIA) storage report showed a 71 Bcf injection for the week ending September 5, exceeding both market forecasts of 69 Bcf and the five-year average build of 56 Bcf. This elevated storage level pushed total inventories to 3,343 Bcf, 188 Bcf above the five-year norm, reinforcing a market well-supplied ahead of peak winter demand. With daily consumption slipping to 99.5 Bcf from 99.9 Bcf the prior week and LNG exports softening, the supply cushion is suppressing any immediate price rebound.
Beyond the near-term softness, a structural challenge looms. Global LNG supply capacity is set to surge, with more than 174 million metric tonnes per year of new projects under development, including Qatar’s North Field East and U.S. Gulf Coast expansions. The U.S. alone has revised its 2025 natural gas production forecast upward to 106.63 Bcf/day, near record highs, as active rigs reached a two-year peak. LNG output grew 19% in the first half of the year compared to 2024, underscoring the supply acceleration. While developers expected Europe and China to absorb additional cargoes, China’s LNG imports have slowed due to stronger domestic production and increased flows from Russia. This shift risks leaving the market in a state of surplus by 2026, creating a persistent cap on price rallies beyond the $3.25 ceiling seen earlier in the summer.
In Europe, benchmark Dutch TTF front-month gas slipped to €32.19 per MWh, equivalent to $11.07 per mmBtu, while the U.K. front-month dropped to 79.15 pence per therm. Strong LNG arrivals and storage levels already 80% full have weighed on pricing. Mild weather and high wind generation reduced power-sector gas demand, reinforcing downside pressure. Yet, geopolitical risks remain a potent upside driver. Germany’s Emden terminal will undergo maintenance, and U.S. sanctions on Russian Arctic LNG 2 exports could disrupt flows further, particularly as cargoes have continued to reach China. Any escalation in restrictions would tighten LNG supply chains globally, reversing the current softness in European benchmarks and potentially spilling over into U.S. pricing.
Technically, Natural Gas (NG=F) remains in a consolidation phase, trading just below the $3.00 psychological barrier. Resistance is defined at $3.23, a level repeatedly tested but not breached, while near-term support sits between $2.80 and $2.82. Momentum indicators reinforce this range-bound scenario: the RSI hovers near 51, showing neutrality, while the 25-day EMA provides short-term support against a 50-day EMA ceiling. The inability to close above $3.13 signals buyers lack conviction, and the formation of lower highs since March adds weight to the bearish case. If $2.80 fails, downside could accelerate toward $2.64, while a bullish break above $3.23 would open the path toward $3.50.
Looking toward winter, natural gas demand fundamentals remain a wild card. European inventories may appear comfortable now, but a colder-than-expected season could trigger strong withdrawals, lifting prices back toward $3.50. In the U.S., the growing power needs of hyperscale data centers add another layer of uncertainty. Forecasts diverge widely on how much gas these facilities will consume by decade’s end, with some projecting a material uplift in baseline demand. However, renewable energy expansion continues to compete with natural gas in the power stack, limiting longer-term price sustainability unless structural consumption rises meaningfully.
With NG=F pinned below $3.00 and fundamentals skewed by oversupply risk, the broader stance remains bearish. The strong inventory build, accelerating global LNG capacity, and seasonal demand lull point toward further weakness. However, the downside appears cushioned near $2.80 as the market transitions into the winter cycle, where unexpected cold spells or geopolitical shocks could ignite sharp rallies. For traders, the strategy is to respect the range: accumulation near $2.80 for short-term rebounds toward $3.10–$3.25, while avoiding aggressive long positions until a decisive break above $3.23 confirms momentum. Medium-term, the oversupply trajectory suggests Natural Gas is a Sell on rallies unless demand surprises shift the balance.
HSBC expects a big oil surplus of 1.7 million barrels per day (mbd) from the fourth quarter of 2025, and a surplus of 2.4 mbd in 2026, exacerbated by the return of OPEC+ barrels over the next 12 months, it said in a note on Monday.
At its meeting this month, OPEC+ opted to further increase oil production by 137,000 bpd in October, starting to unwind the 1.65 million bpd in cuts ahead of schedule.
HSBC’s latest oil market supply and demand model envisions OPEC+ gradually unwinding 1.65 million barrels per day in the “first-phase” voluntary production cuts over a 12-month period, HSBC said a week ago.
The bank also saw a downside risk to its 2026 $65 per barrel Brent price assumption if stockbuilds materialise in the West.
U.S. President Donald Trump urged EU officials last week to hit China with tariffs of up to 100% as part of a strategy to pressure Russian President Vladimir Putin.
The bank’s note on Monday stated that “outright losses in Russian supply are not in (HSBC’s) base case (but) Russia will struggle to increase its output in line with OPEC+ quotas.” The bank now expects only a modest production increase, lowering its end-2026 Russian production forecast by 300,000 bpd.
Spot Gold trades near fresh all-time highs just above the $3,680 mark, approaching its all-time high of $3,674.63 posted earlier this month. Absent demand for the US Dollar (USD) prompted the bright metal higher at the beginning of the new week, as market players gear up for central banks’ monetary policy announcements.
Of course, the main focus is the Federal Reserve (Fed) schedule to announce its decision on Wednesday. The Fed is largely anticipated to deliver its first interest rate cut for 2025, with financial markets anticipating a 25 basis points (bps) reduction. The odds for a larger cut decreased following the release of sticky United States (US) inflation data, but some market participants still believe it’s possible.
The central banks of Canada, England, and Japan will also announce their decisions on monetary policy in the upcoming days, while Canada and the United Kingdom (UK) will release fresh inflation data. Other than that, the US will publish August Retail Sales on Tuesday, while Australia will unveil the August employment report on Thursday.
Softer US Treasury yields add to Gold’s advance, with the 10-year note currently offering 4.03%, down from an intraday peak of 4.089%.
The daily chart for the XAU/USD pair shows it retains most of its intraday gains, with more advances in the docket, despite overbought conditions. The Relative Strength Index (RSI) indicator aims north at around 80, while the Momentum indicator approaches overbought territory, without signs of upward exhaustion. At the same time, Gold is rallying far above bullish moving averages, in line with the dominant upward trend. The 20 Simple Moving Average (SMA) currently stands at $3,497.
In the near term and according to the 4-hour chart, XAU/USD is set to extend its advance. Technical indicators head north almost vertically, approaching overbought readings but still with room to go. Meanwhile, a flat 20 SMA provides intraday support at around $3,642, while the 100 and 200 SMAs keep heading firmly north, far below the shorter one.
Support levels: 3,674.30 3,657.30 3,642.00
Resistance levels: 3,690.00 3,705.00 3,720.00
The EURJPY pair ended its last attempts with clear failure, to breach 173.50 barrier, which forces it to delay the bullish attack and begin forming bearish correctional waves, to settle near 172.90.
The price might keep forming correctional trading to gather some of the gains, to target 171.60, keeping its main stability within the bullish channel that appears in the above image, while its success in breaching the barrier and holding above it will allow it achieve more of the gains, to reach 174.25 followed by the next main target at 175.20.
The expected trading range for today is between 171.60 and 173.50
Trend forecast: Fluctuated within the bullish track
Gold failed to find acceptance above the $3,660 area and is trading lower on Thursday, returning to $3,620, as the US Dollar appreciates for the third consecutive day, with all eyes on the US Consumer Prices Index release.
XAU/USD islands tall at a short distance of the all-time high, at $3,675 on Monday. A weaker US Dollar, weighed by market expectations that the Fed will cut rates later this week, keeps precious metals buoyed, with deonside attemots contained above $3,615.
The US Dollar Index, which measures the US Dollar value against a basket of currencies, is trading 0.2% lower today, drifting closer to two-month lows. Investors are positioning for a 25 bps rate cut on Wednesday and also for a dovish turn on the interest rate projections, the so-called “dot plot” and on the bank’s forward guidance.
Gold’s consolidation pattern seen over the last few days has contributed to pulling the 4-hour Relative Strength Index down from the oversold levels seen last week, but it is still above the key 50 level. The MACD in the same timeframe is bearish yet with downside momentum fading.
Downside attempts have been contained above $3,615 so far. Further down, the $3,580 support (September 3 high, September 8 low) might provide some support ahead of the September 4 low, at $3,510.
To the upside, immediate resistance is the September 9 high, at $3,675. Beyond this, the psychological $3,700 level emerges as the next target, and then probably the 161.8% extension of last week’s rally, near $3,740.
The table below shows the percentage change of US Dollar (USD) against listed major currencies today. US Dollar was the strongest against the Canadian Dollar.
| USD | EUR | GBP | JPY | CAD | AUD | NZD | CHF | |
|---|---|---|---|---|---|---|---|---|
| USD | -0.17% | -0.37% | -0.21% | -0.09% | -0.22% | -0.09% | -0.19% | |
| EUR | 0.17% | -0.17% | -0.09% | 0.09% | 0.00% | 0.04% | -0.02% | |
| GBP | 0.37% | 0.17% | 0.16% | 0.27% | 0.17% | 0.21% | 0.04% | |
| JPY | 0.21% | 0.09% | -0.16% | 0.09% | 0.03% | 0.10% | 0.02% | |
| CAD | 0.09% | -0.09% | -0.27% | -0.09% | -0.03% | -0.05% | -0.22% | |
| AUD | 0.22% | -0.00% | -0.17% | -0.03% | 0.03% | 0.04% | -0.05% | |
| NZD | 0.09% | -0.04% | -0.21% | -0.10% | 0.05% | -0.04% | -0.17% | |
| CHF | 0.19% | 0.02% | -0.04% | -0.02% | 0.22% | 0.05% | 0.17% |
The heat map shows percentage changes of major currencies against each other. The base currency is picked from the left column, while the quote currency is picked from the top row. For example, if you pick the US Dollar from the left column and move along the horizontal line to the Japanese Yen, the percentage change displayed in the box will represent USD (base)/JPY (quote).
The EURJPY pair ended its last attempts with clear failure, to breach 173.50 barrier, which forces it to delay the bullish attack and begin forming bearish correctional waves, to settle near 172.90.
The price might keep forming correctional trading to gather some of the gains, to target 171.60, keeping its main stability within the bullish channel that appears in the above image, while its success in breaching the barrier and holding above it will allow it achieve more of the gains, to reach 174.25 followed by the next main target at 175.20.
The expected trading range for today is between 171.60 and 173.50
Trend forecast: Fluctuated within the bullish track