The main tag of Gold Price Articles.
You can use the search box below to find what you need.
[wd_asp id=1]
The main tag of Gold Price Articles.
You can use the search box below to find what you need.
[wd_asp id=1]
Gold’s latest leg higher came on the back of a decisively weak U.S. August jobs report and a quick repricing toward a September Fed rate cut. Spot gold printed fresh records near $3,600/oz and continues to hover just below that line as traders firm up odds of easing at the upcoming FOMC. Lower policy-rate expectations compress real yields and keep the dollar on the defensive—classic tailwinds for bullion.
Beyond the macro rates impulse, the structural bid is alive: central-bank buying (with fresh headlines pointing to continued PBoC additions in August) and elevated geopolitical risk have reinforced gold’s role as a portfolio hedge. That backdrop helped absorb profit-taking dips into the back half of last week.
In Monday’s outlook, we highlighted gold’s ability to reclaim layered H4 Fair Value Gaps as a structural foundation for further upside. That forecast has since materialized: buyers defended the $3,550–$3,560 shelf, and momentum carried price into a clean breakout sequence.
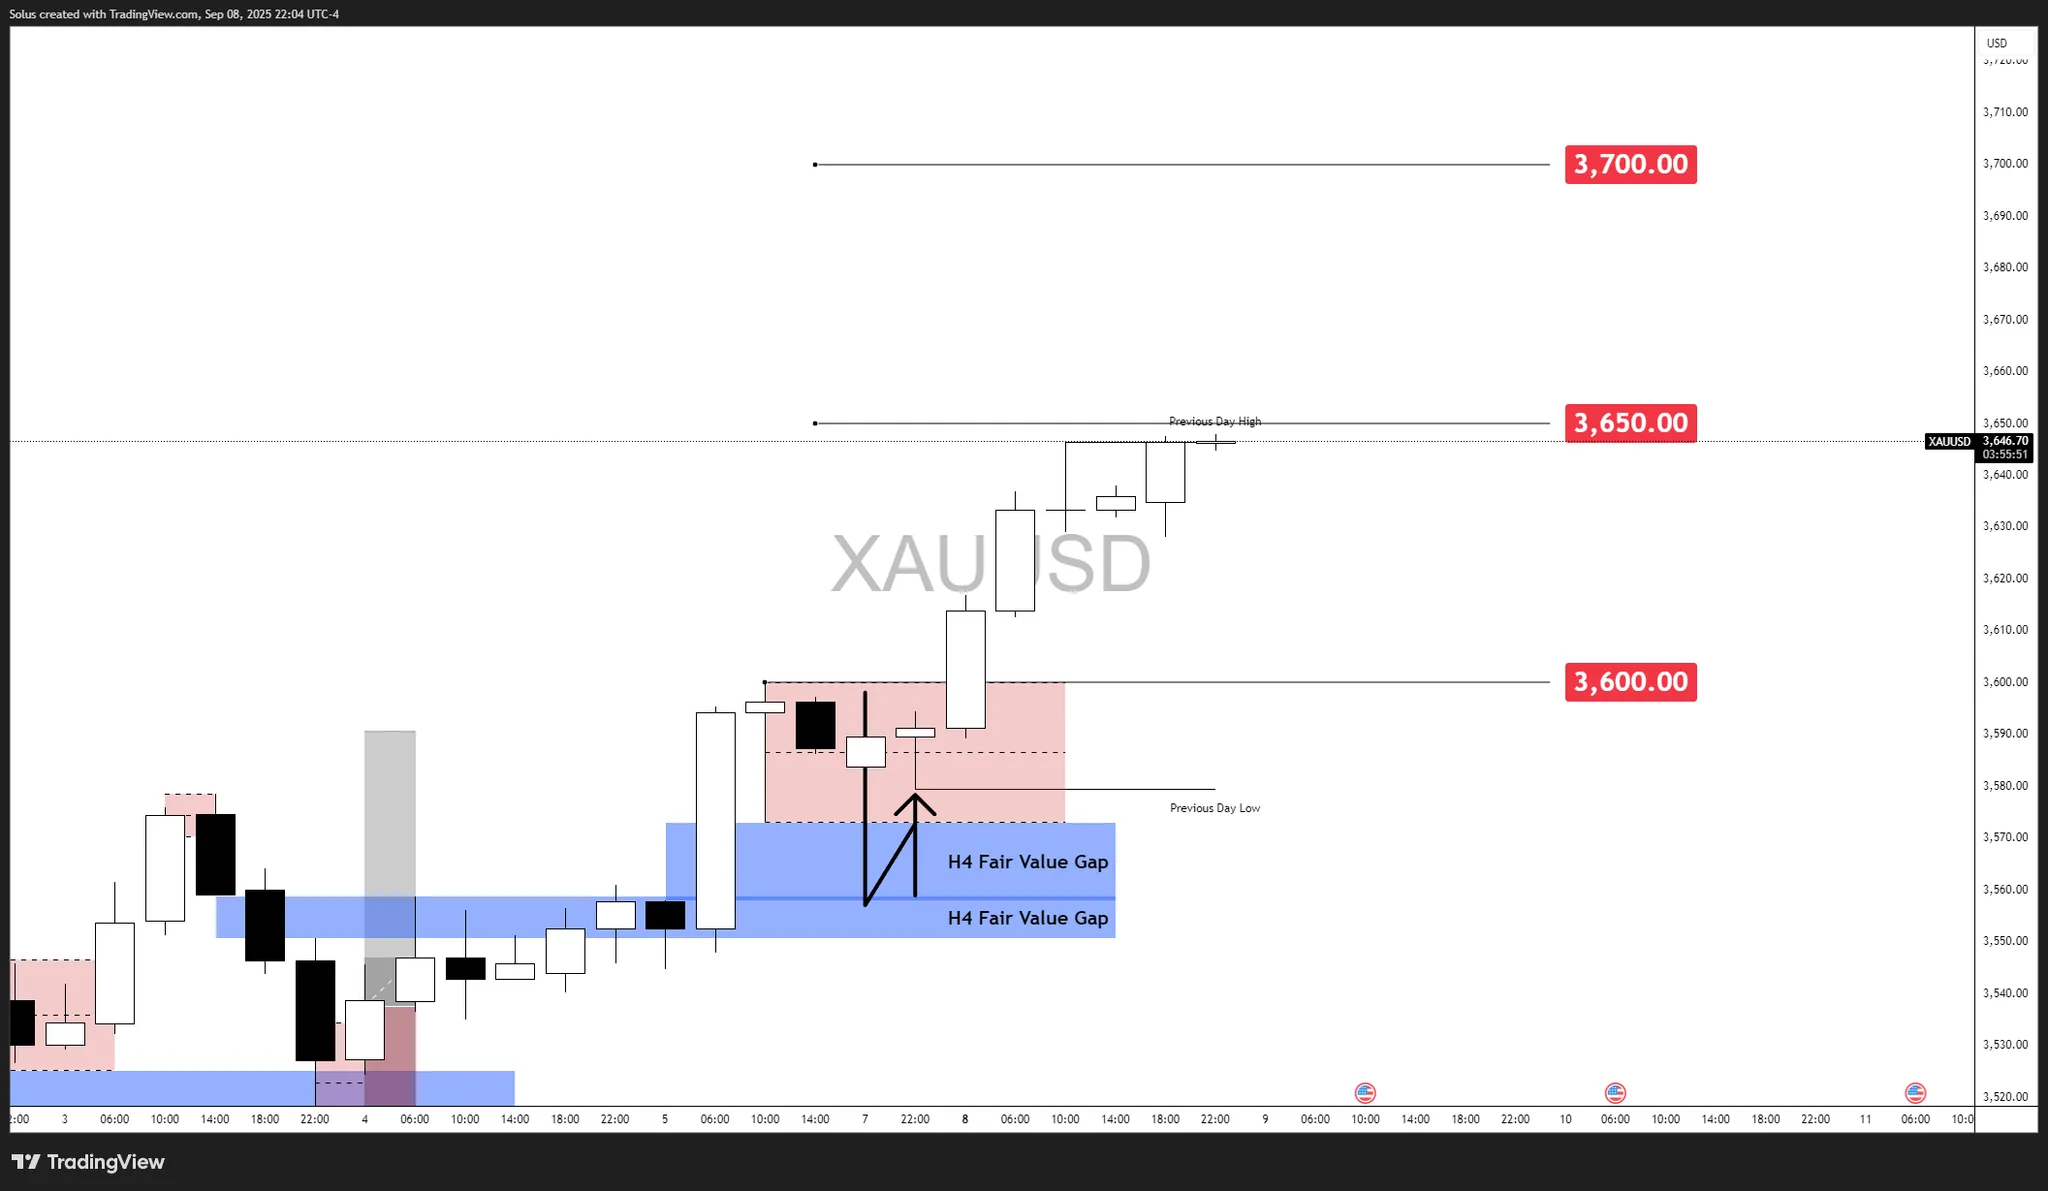
The move extended into the $3,640–$3,650 zone, aligning with our projected bullish continuation path. Each retest of intraday imbalances attracted fresh demand, confirming market conviction that dips remain buying opportunities. The current structure shows price consolidating just under $3,650 – the next pivotal resistance before $3,700 comes into view.
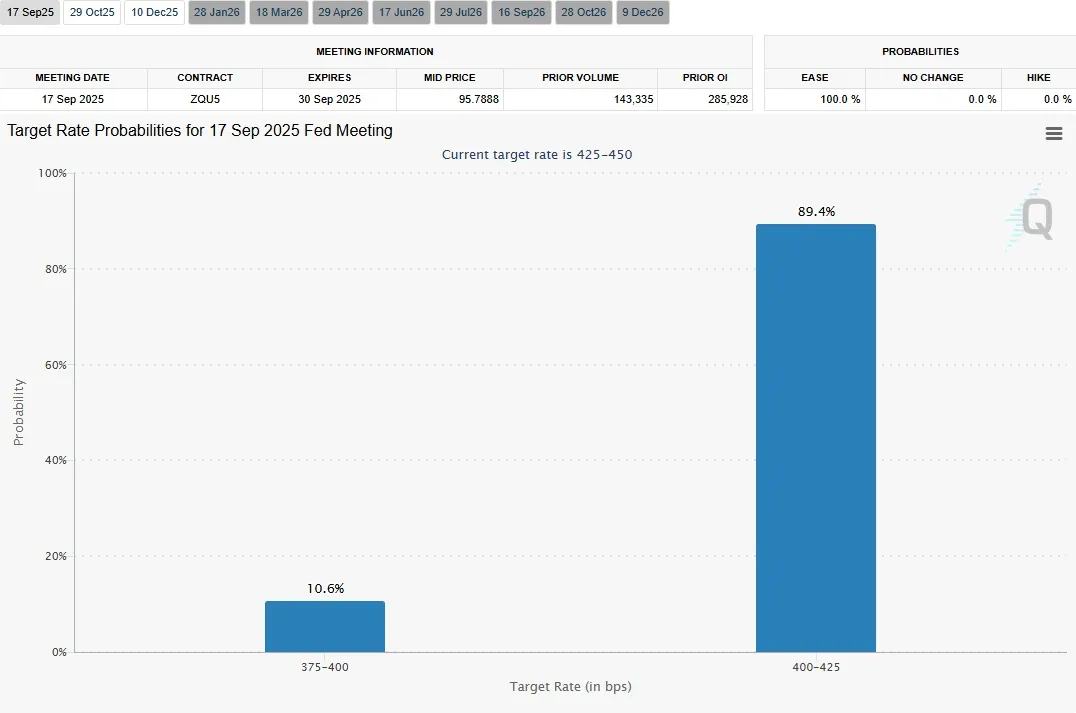
The CME FedWatch Tool now prices an 89% probability of a 25 bp Fed rate cut at the September 17 meeting, with a smaller 10% chance of a 50 bp move.
This overwhelmingly dovish repricing is critical for gold. A confirmed rate cut would:
Together, these dynamics create a macro backdrop where gold’s floor remains supported, even if technicals temporarily stretch into overbought territory. Traders will watch whether CPI/PPI confirm the Fed’s dovish path—cool inflation could propel gold beyond $3,650 toward the $3,700 target zone.
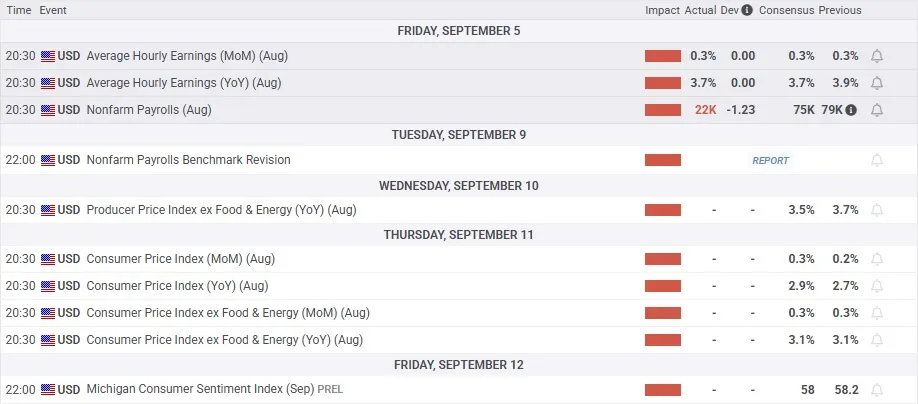
Rate expectations are the beating heart of this move. With FedWatch showing nearly 90% odds of easing, gold has a clear policy-driven tailwind. Pair that with central-bank accumulation and risk-hedging flows, and dips have struggled to develop follow-through. If CPI/PPI confirm a cooling trend, the path of least resistance remains higher into the Fed meeting.
Gold’s is consolidating beneath the $3,650 resistance, with multiple H4 Fair Value Gaps (FVGs) forming below current levels.
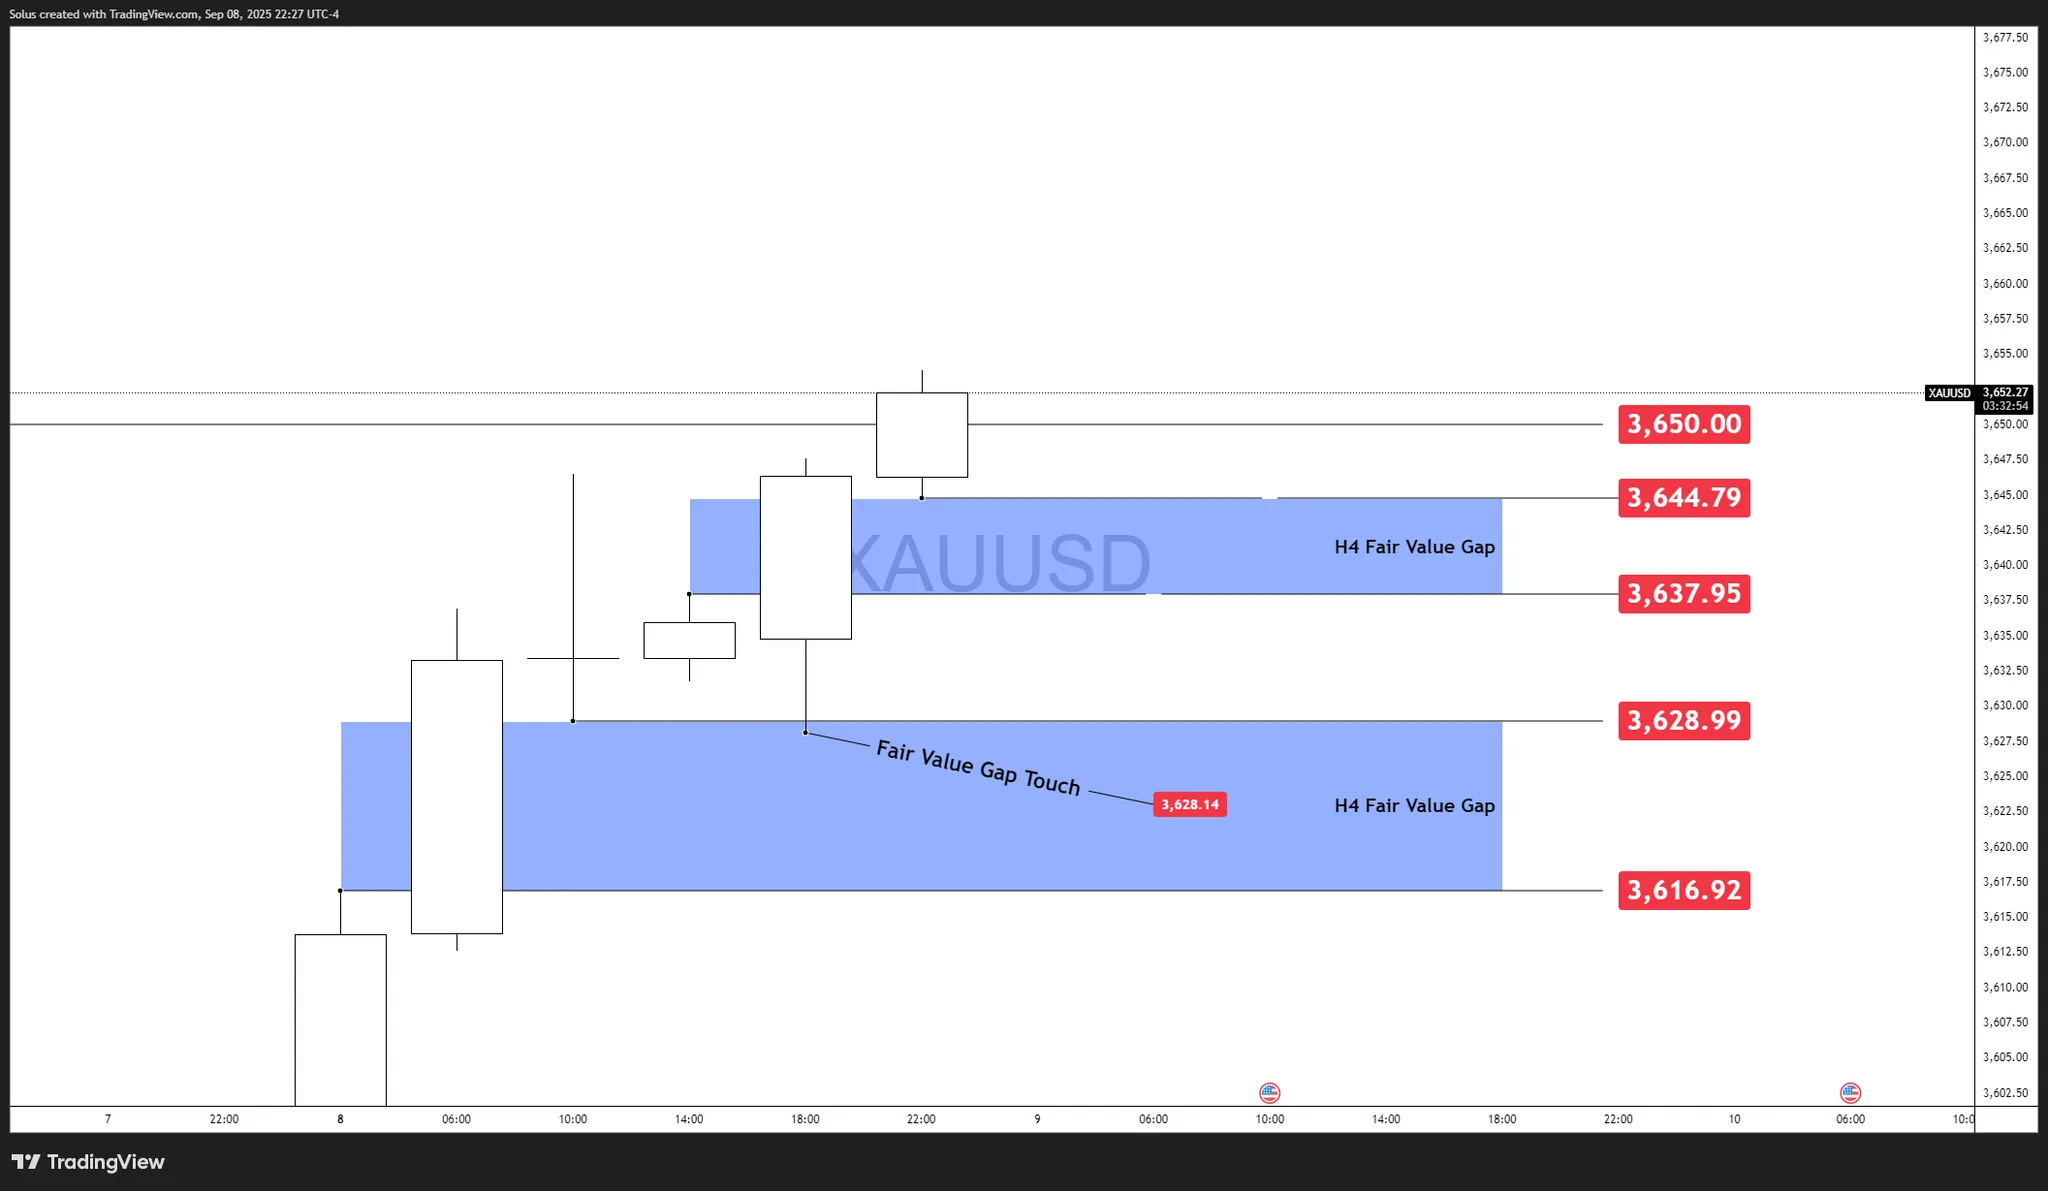
Prior to this move, the FVG at $3,630 – $3,616 served as a point-of-interest for bounce to the upside.
These FVGs between $3,616 – $3,645 are pivotal zones where buyers may attempt to step back in if price retraces. The reaction at these imbalances will dictate whether gold clears $3,650 for continuation or fades back into deeper retracement.
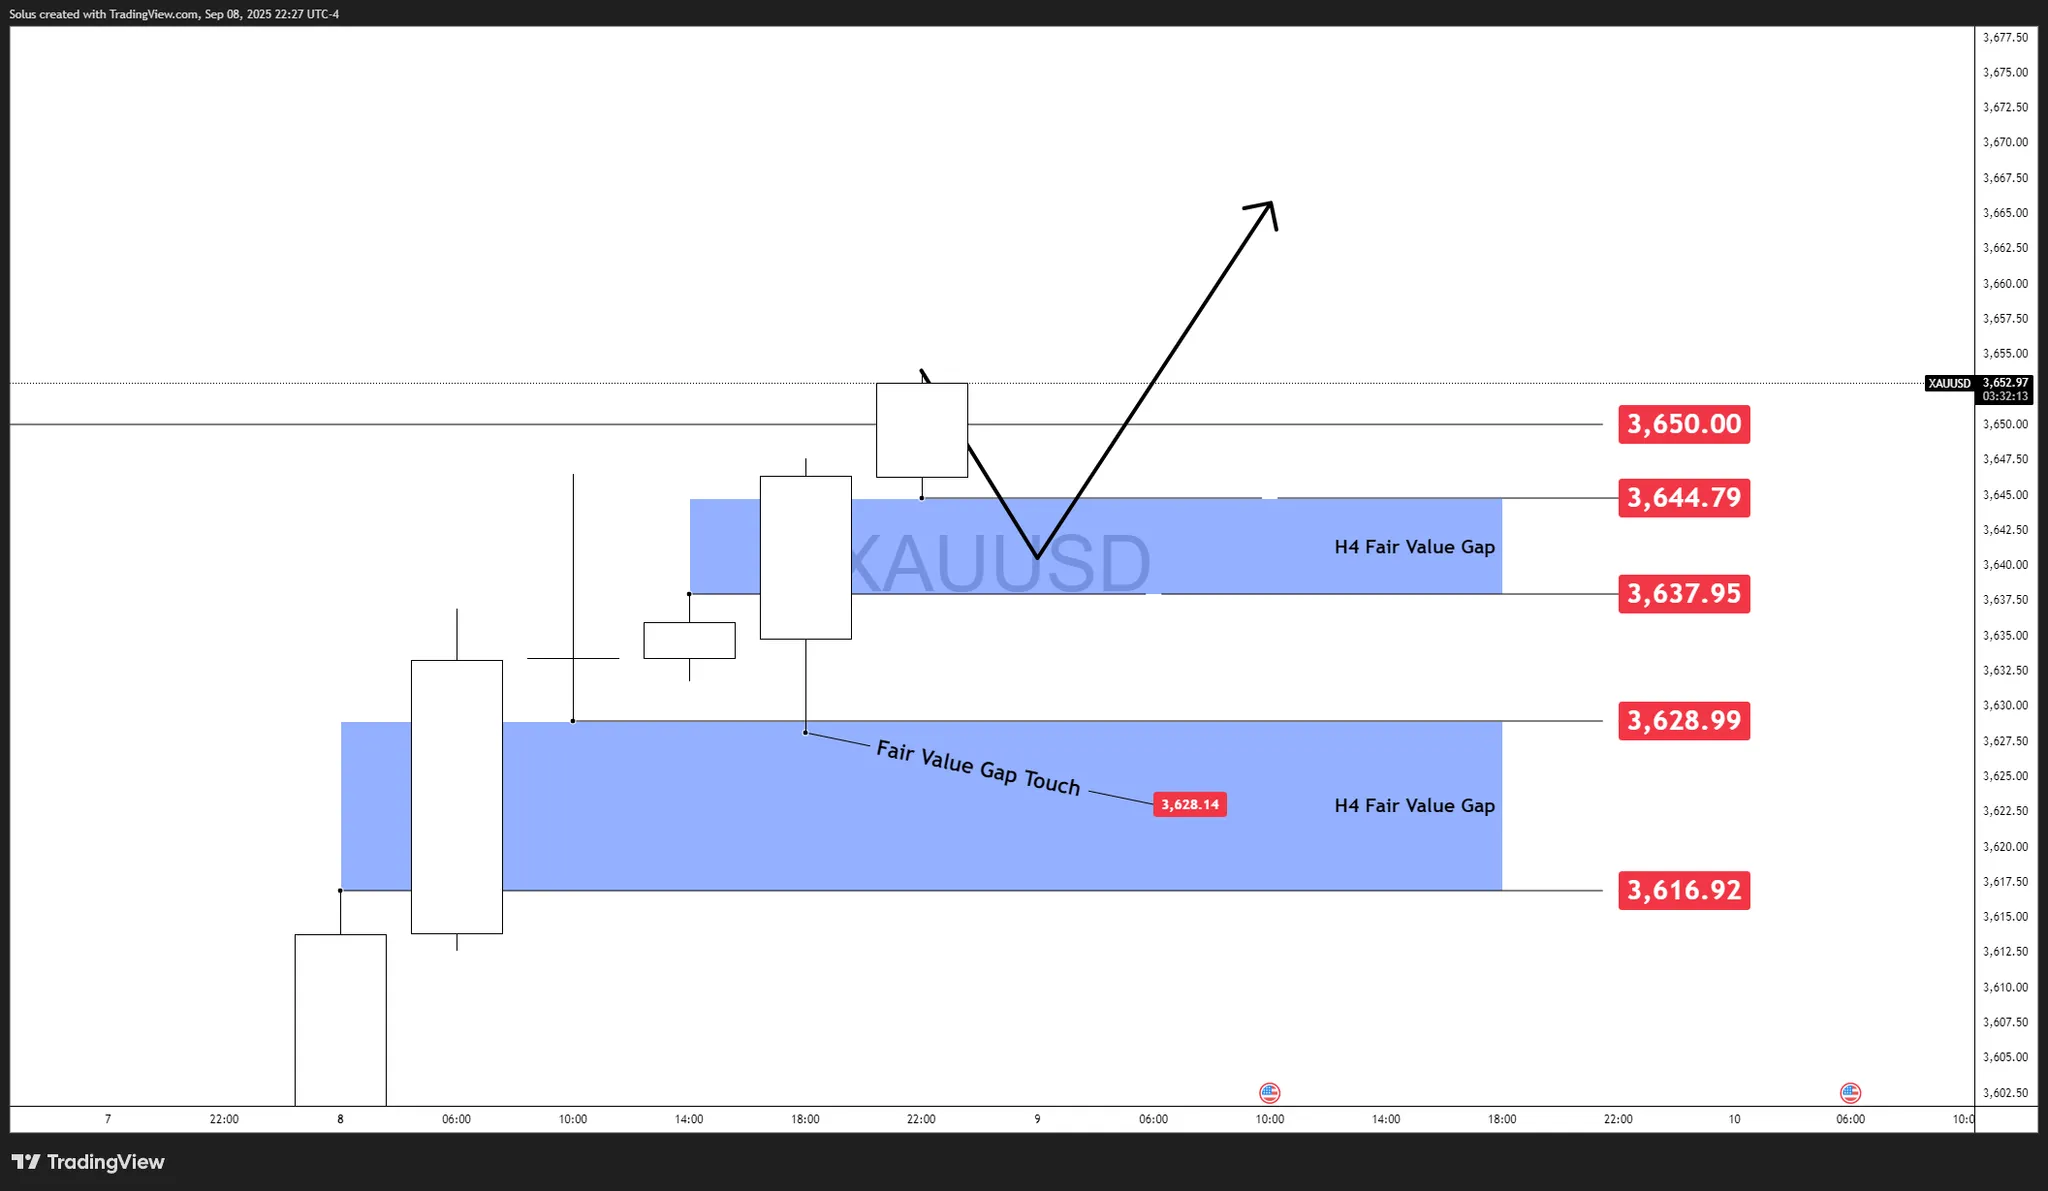
The bullish case hinges on whether buyers can hold the FVGs and reclaim $3,650 with conviction.
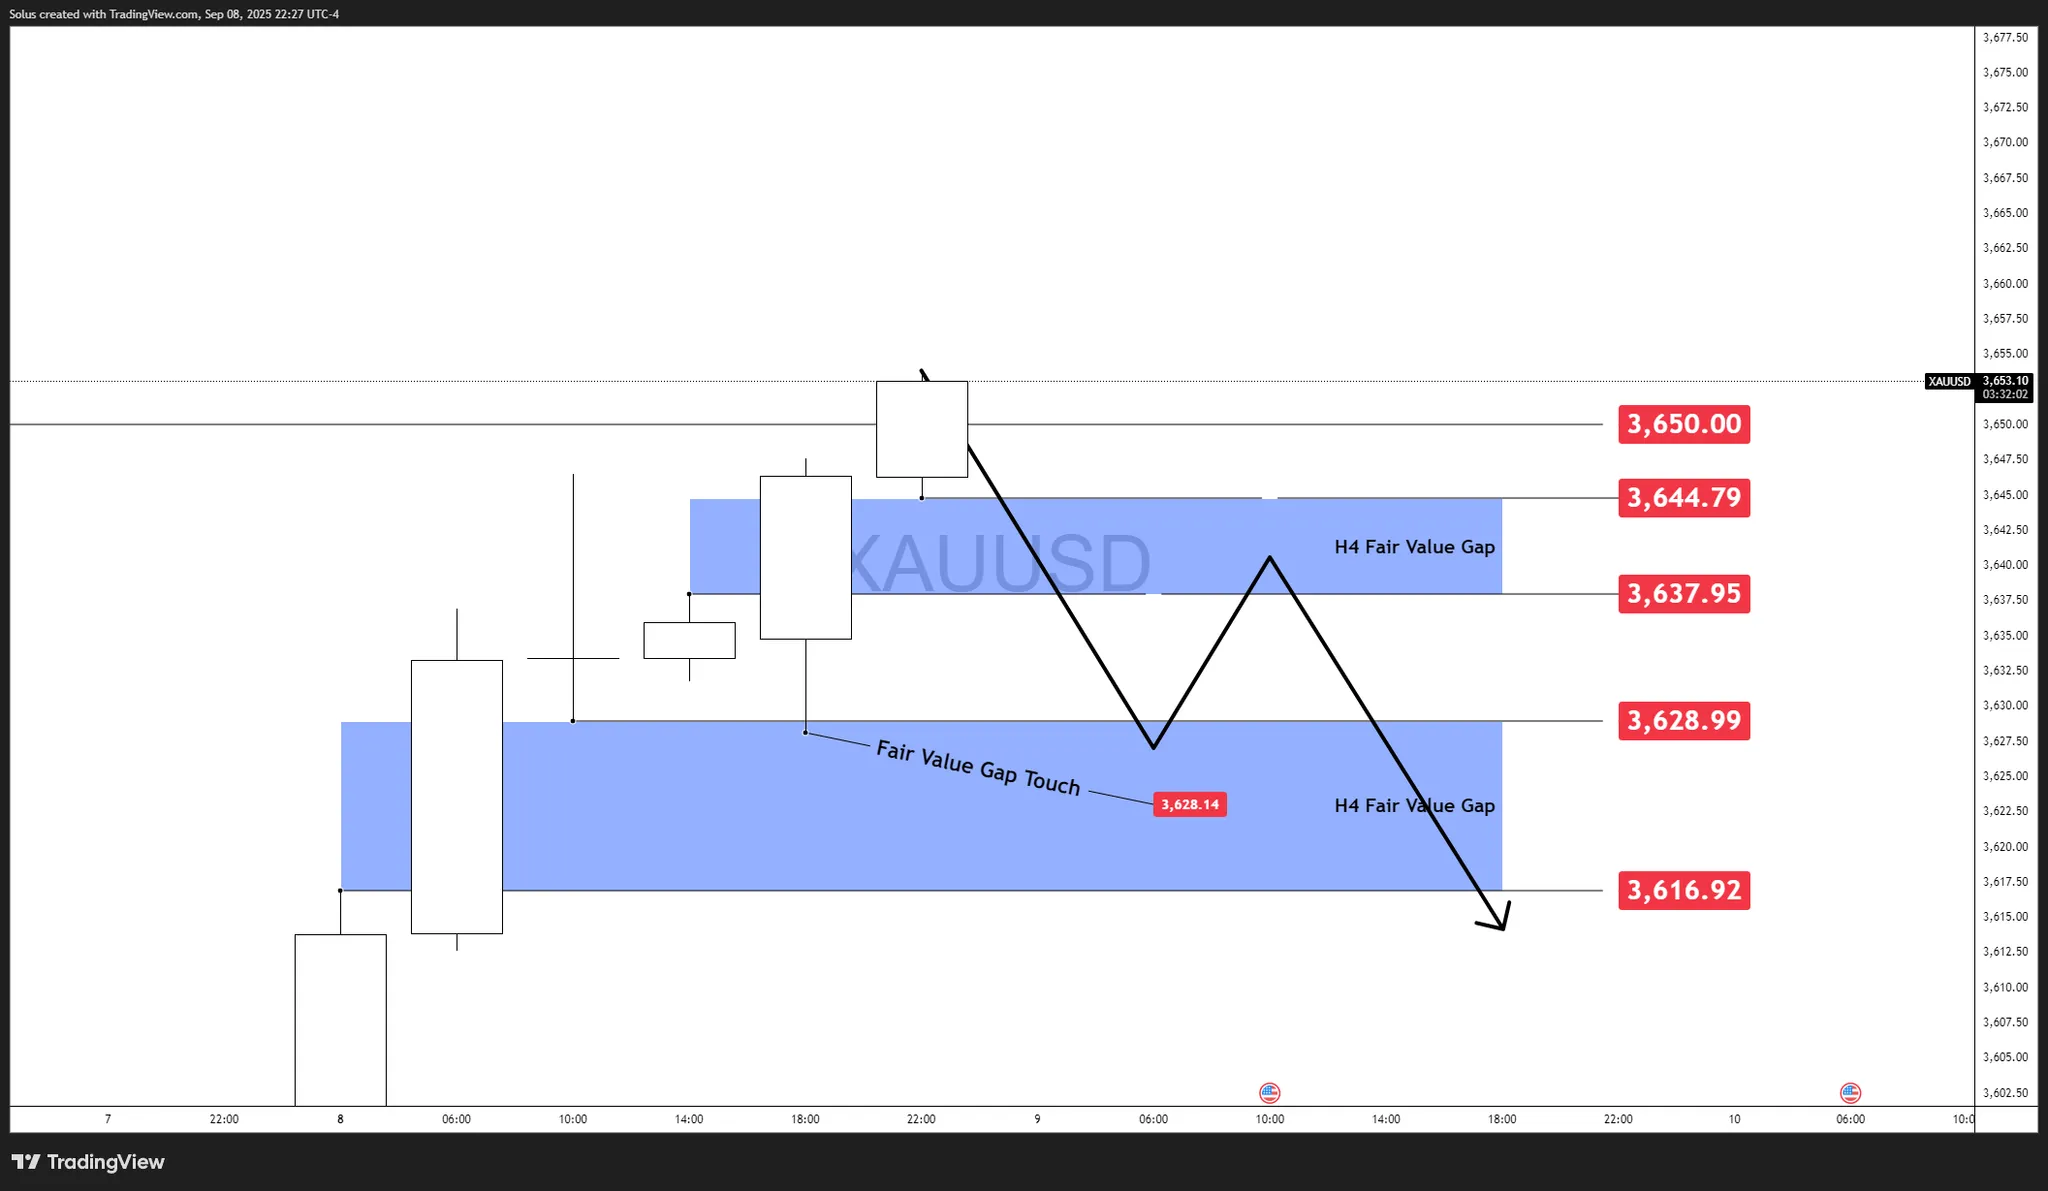
Alternatively, a sustained rejection under $3,650 combined with a hot CPI or stronger USD could trigger a deeper pullback.
While both bullish and bearish paths are clear on the chart, gold is sitting at a pivotal juncture. With CPI/PPI ahead and Fed cut odds already priced, chasing moves without confirmation risks being trapped in volatility. Traders should wait for a confirmed breakout above $3,650 or a decisive breakdown through the $3,628–$3,616 zone before committing to directional trades.
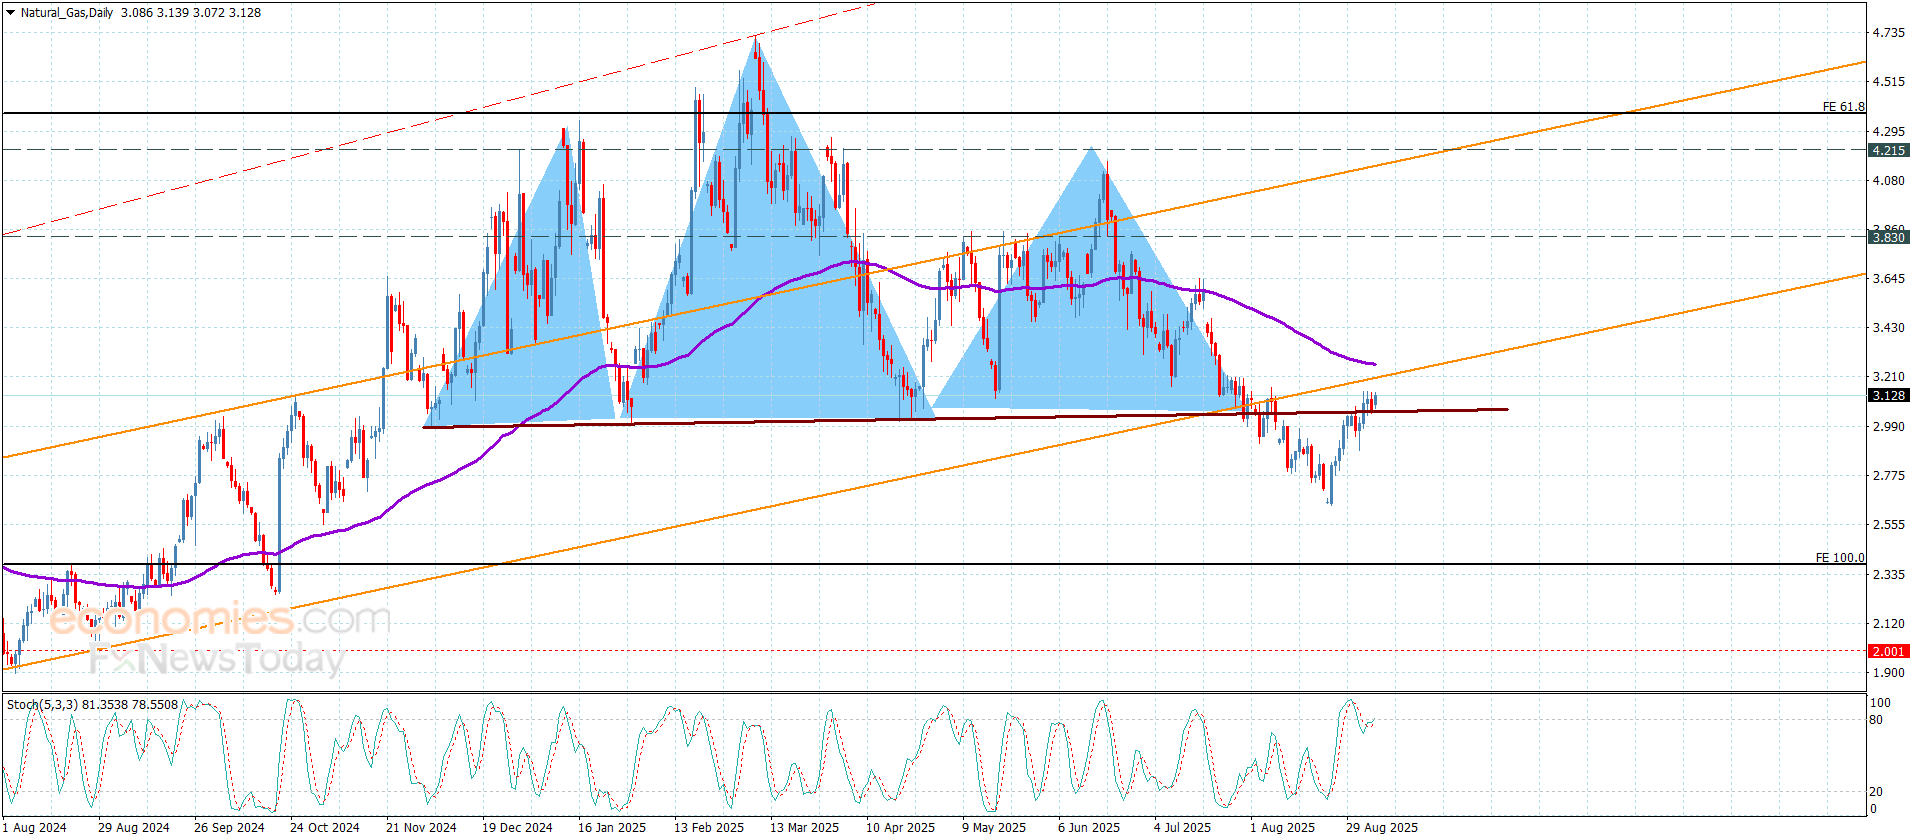
Natural gas price ended the bullish correctional rally by testing the resistance at $3.210, then begin forming bearish waves, affected by the negativity of the indicators and providing negative momentum, to notice its stability near $3.100.
The continuation of facing negative pressures will confirm its surrender to the previously suggested scenario, to keep waiting for targeting $2.810 level, and breaking this barrier will extend the losses directly towards $2.620 reaching the next main target at $2.390.
The expected trading range for today is between $2.820 and $3.150
Trend forecast: Bearish
Gold prices reached fresh record highs on Monday, with the bright metal extending its rally beyond the $3,630 mark. It currently trades not far below an intraday peak of $3,646.41, as investors keep dropping the US Dollar (USD). The Greenback’s selling spiral was triggered by a tepid Nonfarm Payrolls (NFP), which showed the country added a modest 22K new jobs in August. The country added 79K in July, and lost 12K in June, making it a third consecutive discouraging report.
Tepid job creation pretty much confirmed the Federal Reserve (Fed) will cut interest rates when it meets next week, with market participants even increasing bets for a larger interest rate cut of 50 basis points (bps).
During the upcoming days, the United States (US) will publish inflation-related figures. The July Producer Price Index (PPI) will be out on Wednesday, while the August Consumer Price Index (CPI) will be out on Thursday. The latter is foreseen at 2.9% YoY, higher than the 2.7% posted in July. The core annual reading is expected to remain steady at 3.1%. Also on Thursday, the European Central Bank (ECB) is scheduled to announce its decision on monetary policy. The ECB is widely anticipated to keep interest rates on hold this time.
From a technical point of view, the daily chart for XAU/USD shows that bulls are in full control despite overbought conditions. Technical indicators head firmly north at extreme levels, without signs of changing course anytime soon. At the same time, the pair is developing above all its moving averages, with the 20 Simple Moving Average (SMA) gaining upward traction above the 100 and 200 SMAs.
The near-term picture also skews the risk to the upside. The 4-hour chart shows that technical indicators keep heading higher within overbought readings, partially losing their upward strength but still aiming north. At the same time, a bullish 20 SMA stands at around $3,571, which is well above the longer ones, reflecting the latest run to record highs. Corrective declines should now find buyers around $3,600 for the bullish trend to remain alive.
Support levels: 3,625.85 3,608.40 3,593.70
Resistance levels: 3,650.00 3,675.00 3,690.00
Important DisclaimersThe content provided on the website includes general news and publications, our personal analysis and opinions, and contents provided by third parties, which are intended for educational and research purposes only. It does not constitute, and should not be read as, any recommendation or advice to take any action whatsoever, including to make any investment or buy any product. When making any financial decision, you should perform your own due diligence checks, apply your own discretion and consult your competent advisors. The content of the website is not personally directed to you, and we does not take into account your financial situation or needs.The information contained in this website is not necessarily provided in real-time nor is it necessarily accurate. Prices provided herein may be provided by market makers and not by exchanges.Any trading or other financial decision you make shall be at your full responsibility, and you must not rely on any information provided through the website. FX Empire does not provide any warranty regarding any of the information contained in the website, and shall bear no responsibility for any trading losses you might incur as a result of using any information contained in the website.The website may include advertisements and other promotional contents, and FX Empire may receive compensation from third parties in connection with the content. FX Empire does not endorse any third party or recommends using any third party’s services, and does not assume responsibility for your use of any such third party’s website or services.FX Empire and its employees, officers, subsidiaries and associates, are not liable nor shall they be held liable for any loss or damage resulting from your use of the website or reliance on the information provided on this website.Risk DisclaimersThis website includes information about cryptocurrencies, contracts for difference (CFDs) and other financial instruments, and about brokers, exchanges and other entities trading in such instruments. Both cryptocurrencies and CFDs are complex instruments and come with a high risk of losing money. You should carefully consider whether you understand how these instruments work and whether you can afford to take the high risk of losing your money.FX Empire encourages you to perform your own research before making any investment decision, and to avoid investing in any financial instrument which you do not fully understand how it works and what are the risks involved.
Gold is hanging close to the all-time high of $3,600 in Asian trading on Monday, in the aftermath of awful US labor data for August released on Friday.
Despite the latest pullback from record highs, Gold buyers retain control amid sustained dovish expectations surrounding the US Federal Reserve (Fed), lingering Russia-Ukraine geopolitical tensions, and additional Gold buying by China’s central bank last month.
The August US jobs report underscored the fourth consecutive month of weak hiring, cementing a 25 basis points (bps) Fed interest rate cut later this month.
The Bureau of Labor Statistics (BLS) showed Friday that the headline US Nonfarm Payrolls (NFP) increased by 22,000, far below forecasts of 75,000, while the Unemployment Rate climbed to 4.3%, the highest level since late 2021.
Additionally, Russia carried out its biggest air strike of the war on Ukraine over the weekend. In response, Ukrainian President Volodymyr Zelensky said the barrage of drones and missiles left four people dead and caused widespread damage across the north, south and east of the country, per Reuters.
Furthermore, the official data showed on Sunday that the People’s Bank of China (PBoC) added Gold to its reserves in August, extending purchases of bullion into a 10th straight month.
However, Gold buyers turn cautious amid renewed US Dollar upswing, led by a steep surge in the USD/JPY pair after the Japanese Yen (JPY) tumbled on the domestic political instability.
Japanese Prime Minister Shigeru Ishiba stepped down from his position on Sunday, following a string of election defeats that stripped his Liberal Democratic Party (LDP) of its majority in both houses of Parliament.
A slowdown in Chinese imports in August raised concerns over the dragon nation’s economic prospects, threatening the Gold price upside. China is the world’s top yellow metal consumer.
Looking ahead, traders could resort to liquidating their Gold long trades, repositioning before the critical US Consumer Price Index (CPI) and Producer Price Index (PPI) inflation data due later in the week.
The inflation data will help confirm whether the Fed will deliver a jumbo rate cut this month.
Technically, Gold could see a brief corrective decline as the 14-day Relative Strength Index (RSI) remains in a heavily overbought zone. The leading indicator is currently near 76.
Any pullback in Gold could challenge the initial support at the $3,550 psychological level, below which the September 4 low of $3,511 will be tested.
A sustained break below the latter will open up a fresh downside toward this month’s low of 3,437.
However, the Bull Cross of the 21-day Simple Moving Average (SMA) and the 50-day SMA could keep bargain hunting alive.
If buyers regain poise, the next topside barrier is seen at the $3,600 psychological mark/ record high. Further north, all eyes will be on the $3,650 figure.
Inflation measures the rise in the price of a representative basket of goods and services. Headline inflation is usually expressed as a percentage change on a month-on-month (MoM) and year-on-year (YoY) basis. Core inflation excludes more volatile elements such as food and fuel which can fluctuate because of geopolitical and seasonal factors. Core inflation is the figure economists focus on and is the level targeted by central banks, which are mandated to keep inflation at a manageable level, usually around 2%.
The Consumer Price Index (CPI) measures the change in prices of a basket of goods and services over a period of time. It is usually expressed as a percentage change on a month-on-month (MoM) and year-on-year (YoY) basis. Core CPI is the figure targeted by central banks as it excludes volatile food and fuel inputs. When Core CPI rises above 2% it usually results in higher interest rates and vice versa when it falls below 2%. Since higher interest rates are positive for a currency, higher inflation usually results in a stronger currency. The opposite is true when inflation falls.
Although it may seem counter-intuitive, high inflation in a country pushes up the value of its currency and vice versa for lower inflation. This is because the central bank will normally raise interest rates to combat the higher inflation, which attract more global capital inflows from investors looking for a lucrative place to park their money.
Formerly, Gold was the asset investors turned to in times of high inflation because it preserved its value, and whilst investors will often still buy Gold for its safe-haven properties in times of extreme market turmoil, this is not the case most of the time. This is because when inflation is high, central banks will put up interest rates to combat it.
Higher interest rates are negative for Gold because they increase the opportunity-cost of holding Gold vis-a-vis an interest-bearing asset or placing the money in a cash deposit account. On the flipside, lower inflation tends to be positive for Gold as it brings interest rates down, making the bright metal a more viable investment alternative.
The (Brent) price soars high in its last intraday trading, taking advantage of forming a positive divergence on the (RSI), with the emergence of the positive signals from there, and the price gad previously benefited from the stability of the key support at $65.00, gaining positive momentum that intensified these signals, in attempt to recover some of the previous losses on the short-term basis, with the continuation of the negative pressure that comes from its trading below EMA50, decreasing the chances for the recovery.
Get high-accuracy trading signals delivered directly to your Telegram. Subscribe to specialized packages tailored for the world’s top markets:
Full VIP signals performance report for September 1–5, 2025:
The (Brent) price soars high in its last intraday trading, taking advantage of forming a positive divergence on the (RSI), with the emergence of the positive signals from there, and the price gad previously benefited from the stability of the key support at $65.00, gaining positive momentum that intensified these signals, in attempt to recover some of the previous losses on the short-term basis, with the continuation of the negative pressure that comes from its trading below EMA50, decreasing the chances for the recovery.
Get high-accuracy trading signals delivered directly to your Telegram. Subscribe to specialized packages tailored for the world’s top markets:
Full VIP signals performance report for September 1–5, 2025:
The (Brent) price soars high in its last intraday trading, taking advantage of forming a positive divergence on the (RSI), with the emergence of the positive signals from there, and the price gad previously benefited from the stability of the key support at $65.00, gaining positive momentum that intensified these signals, in attempt to recover some of the previous losses on the short-term basis, with the continuation of the negative pressure that comes from its trading below EMA50, decreasing the chances for the recovery.
Get high-accuracy trading signals delivered directly to your Telegram. Subscribe to specialized packages tailored for the world’s top markets:
Full VIP signals performance report for September 1–5, 2025:
The Gold price (XAU/USD) extends the rally to near $3,590 during the early Asian session on Monday. The precious metal edges higher near an all-time high as soft US jobs data further cemented expectations for a US Federal Reserve (Fed) rate cut later this month.
The US Nonfarm Payrolls (NFP) report on Friday showed a slowdown in hiring in August, while the Unemployment Rate rose to the highest level since 2021, confirming that labor market conditions in the world’s biggest economy are slumping. These reports boost Fed rate cut expectations, which provides some support to the precious metal price, as lower interest rates could reduce the opportunity cost of holding Gold.
Following the data, traders are now almost certain that the Fed will lower rates at its upcoming meeting on September 17, with an 84% chance of it being a 25 basis points (bps) cut and a 16% possibility of a more aggressive 50 bps reduction.
Additionally, rising demand from major central banks contributes to the upside. Official data showed on Sunday that the People’s Bank of China (PBoC) added gold to its reserves in August, extending purchases of bullion into a 10th straight month. China’s gold reserves stood at 74.02 million fine troy ounces at the end of August, up from 73.96 million at the end of July.
Traders will take more cues from the US Producer Price Index (PPI) for August, which is due later on Wednesday. If the report shows hotter-than-expected outcomes, this could boost the US Dollar (USD) and weigh on the USD-denominated commodity price.
Gold has played a key role in human’s history as it has been widely used as a store of value and medium of exchange. Currently, apart from its shine and usage for jewelry, the precious metal is widely seen as a safe-haven asset, meaning that it is considered a good investment during turbulent times. Gold is also widely seen as a hedge against inflation and against depreciating currencies as it doesn’t rely on any specific issuer or government.
Central banks are the biggest Gold holders. In their aim to support their currencies in turbulent times, central banks tend to diversify their reserves and buy Gold to improve the perceived strength of the economy and the currency. High Gold reserves can be a source of trust for a country’s solvency. Central banks added 1,136 tonnes of Gold worth around $70 billion to their reserves in 2022, according to data from the World Gold Council. This is the highest yearly purchase since records began. Central banks from emerging economies such as China, India and Turkey are quickly increasing their Gold reserves.
Gold has an inverse correlation with the US Dollar and US Treasuries, which are both major reserve and safe-haven assets. When the Dollar depreciates, Gold tends to rise, enabling investors and central banks to diversify their assets in turbulent times. Gold is also inversely correlated with risk assets. A rally in the stock market tends to weaken Gold price, while sell-offs in riskier markets tend to favor the precious metal.
The price can move due to a wide range of factors. Geopolitical instability or fears of a deep recession can quickly make Gold price escalate due to its safe-haven status. As a yield-less asset, Gold tends to rise with lower interest rates, while higher cost of money usually weighs down on the yellow metal. Still, most moves depend on how the US Dollar (USD) behaves as the asset is priced in dollars (XAU/USD). A strong Dollar tends to keep the price of Gold controlled, whereas a weaker Dollar is likely to push Gold prices up.
While tariffs and mining challenges dominate international copper headlines, the U.S. faces domestic supply pressures from theft. In California, Assembly Bill 476 was introduced to curb rampant copper wire thefts that have blacked out public infrastructure across Los Angeles. The bill, which passed committee by an 18-0 vote, would enforce stricter licensing for copper sellers, mandate reporting by recyclers, and revise penalties to reflect the full cost of damages. For utilities already squeezed by high copper prices, this legislation could provide a safeguard against mounting operational losses. The theft issue underscores how copper’s surging value, now flirting with all-time highs, has spilled into social and infrastructure vulnerabilities.
The convergence of a 50% U.S. tariff baseline, production disruptions in Chile, institutional repositioning in Brazil, and rising domestic theft in the U.S. has created a rare cocktail of volatility for HG=F copper futures. The divergence between COMEX at $13,000 per ton and LME prices under $10,000 shows just how fractured global copper pricing has become under tariff pressure. Investors must weigh whether these conditions justify further upside, or if the arbitrage window signals a corrective phase ahead. With Ero Copper beating on profits but facing selling from one of its largest institutional holders, and Capstone Copper balancing short-term operational strain against long-term project optimism, the equity side of the copper trade offers selective opportunity but rising risk.
Given the policy backdrop, copper’s outlook leans bullish in pricing but fragile in fundamentals. The tariff regime is poised to elevate costs across supply chains, but also incentivizes domestic investment. For investors in miners like FCX, ERO, and CS, the key question is whether operational execution can match market enthusiasm. At current levels, copper equities demand close scrutiny, with valuations likely to stretch further if tariffs translate into sustained price floors above $11,000 per ton on COMEX.