The main tag of Gold Price Articles.
You can use the search box below to find what you need.
[wd_asp id=1]
The main tag of Gold Price Articles.
You can use the search box below to find what you need.
[wd_asp id=1]
Gold (XAU/USD $3,410.80, +1.1%) opened Tuesday above the $3,400 threshold, extending a rebound triggered by Fed Chair Jerome Powell’s Jackson Hole speech. Powell emphasized that tariffs’ inflationary impact was likely temporary and hinted at a September rate cut, sending Treasury yields lower and the dollar weaker. The move gave bullion a $50 surge to $3,380 late Friday and follow-through buying pushed it to Tuesday’s open at $3,410.80 per ounce, not far from the April 22 all-time high of $3,485.60. In euro terms, the rally was less pronounced, underscoring that the U.S. dollar’s weakness was the primary driver.
The removal of Fed Governor Lisa Cook by President Donald Trump jolted markets and deepened concerns over central bank independence. Such political moves suggest lower-for-longer rates, which historically bolster gold. Gold has already risen 35.9% year-over-year, from $2,509.90 in August 2024 to $3,410.80 today. The perception that the Fed is under pressure to ease aggressively raises the likelihood of further safe-haven flows into bullion. Traders are eyeing the core PCE index release on Friday, which could confirm or weaken the case for a September cut.
ETF flows, which had seen heavy outflows during the late July correction, have stabilized. Inflows into gold-backed ETFs in August resumed as global investors rotated back into safe-haven assets amid tariff risks and Fed turmoil. Central bank accumulation remains another critical driver: emerging market banks, particularly in Asia and the Middle East, continue diversifying away from the dollar. The World Gold Council reported that Q2 central bank demand hit record highs, supporting structural upside. Local currency moves are also highlighting demand: in the Philippines, gold rose to PHP 6,182.63 per gram and PHP 72,113.35 per tola, up from the previous day’s PHP 71,872.19 per tola, reflecting global price translation.
Exploration activity is accelerating with prices above $3,400. Legacy Minerals (ASX:LGM) secured approval for 4,500 meters of diamond drilling at Mt Carrington, a project with historical results of 12.82 meters at 48 g/t gold. The site, which closed in 1993 when gold was below $400, now looks viable with gold at nine times those levels. Legacy raised AU$7.75 million earlier this year, highlighting how elevated gold prices are revitalizing once-marginal projects. Additional assays at its Thomson project, showing long intersections of low-grade gold, point to broader exploration appetite underpinned by bullion strength.
Technically, gold is consolidating gains just below $3,420, with the 20- and 100-period moving averages clustering between $3,340–$3,355, forming a potential bullish crossover. If sustained, the setup favors a push toward the $3,500 level, where breakout targets extend to $3,800. On the downside, support rests at $3,370, followed by $3,300 and $3,260, with $3,200 seen as the hard floor aligning with the 200-day EMA. The RSI remains positive but not overbought, indicating room for continuation if macro catalysts align.
Markets await the U.S. Core PCE Index and the Q2 GDP revision later this week. A softer inflation print would validate rate cut bets and reinforce gold’s bid above $3,400. Stronger data could cool expectations, but geopolitical and political risks suggest downside is capped. Bond markets have already priced in a September cut almost fully, with additional easing in Q4, keeping pressure on the dollar and underpinning bullion.
Beyond short-term volatility, gold is in a powerful long-cycle uptrend. In the past month, futures gained 2% from $3,344 on July 25 to $3,410.80 today, while year-to-date performance exceeds +40%. Forecasts from major banks project prices reaching $3,700 by year-end 2025, citing record central bank demand and trade-war-induced dollar weakness. With legacy projects reopening and ETF inflows resuming, gold’s structural appeal remains strong, especially as political risks weigh on fiat credibility.
At 13:01 GMT, XAU/USD is trading $3372.01, up $6.29 or +0.19%.
The dismissal is widely seen as a political maneuver aimed at steering the Fed toward a more dovish stance. Analysts, including Swissquote’s Carlo Alberto De Casa, warned that this introduces deeper uncertainty around the Fed’s credibility and decision-making autonomy—conditions historically supportive of gold.
Bond markets also reacted sharply. The 2-year Treasury yield dropped 3 bps to 3.70%, while the 10-year yield held around 4.279% and the 30-year yield rose to 4.916%, steepening the yield curve. Traders are now betting on lower short-term rates but pricing in longer-term inflation risk, both favorable for non-yielding gold.
Adding to the bullish gold narrative, Fed Chair Jerome Powell hinted at a potential rate cut in September, citing softening labor market indicators, even as inflation remains a concern. Money markets are now pricing in an 82% chance of a 25 bps cut.
Investors are eyeing this Friday’s PCE price index data—seen as the Fed’s preferred inflation gauge—for confirmation. A cooler reading could solidify the rate-cut narrative and strengthen gold’s upside.
On the demand side, China’s net gold imports via Hong Kong jumped 126.81% in July compared to June, according to Hong Kong Census data. This marked a major rebound in physical demand, offering further support to bullion.
Friday’s breakout also pushed silver above the prior swing high at $38.74, keeping it firmly within its rising trend channel. That channel has been respected since late July, and the recent pullback to $36.96 tested both the lower channel line and the 50-Day moving average — both of which held. The 50-Day line has now supported two significant swing lows: one in early August and the other at the most recent trough. That reinforces its role as medium-term trend support. As long as silver holds above the 50-Day (currently near $37.10), the broader uptrend remains firmly intact.
With silver consolidating in the upper third of Friday’s wide-range day, attention now turns to the July high at $39.53 as the next logical upside target. A decisive breakout above that swing high would strengthen the bullish outlook and confirm a breakout of a rising trend channel. There is potential resistance around the top of the channel. Twice in July, silver approached that upper boundary and failed — triggering short-term corrections each time. A similar reaction could unfold again if price stalls there.
For now, silver is in a constructive technical position: it has broken out above interim resistance, retested dynamic support, and is consolidating near recent highs. The next major signal will come from how price behaves near the channel top and trend high. A clean breakout through each would suggest accelerating momentum and the potential for a new leg higher.
Alternatively, another rejection at channel resistance could lead to a corrective retracement — possibly back toward the 50-Day line. Until either scenario plays out, silver remains bullish within its rising channel and supported by its key moving averages.
For a look at all of today’s economic events, check out our economic calendar.
The (Brent) price declined on its last intraday levels, amid the emergence of the negative signals on the (RSI), after reaching overbought levels, attempting to offload this overbought condition, gaining bullish momentum that might assist it to recover and rise again, amid the dominance of the bullish correctional trend on the short-term basis, with the continuation of the positive pressure that comes from its trading above EMA50, besides the price affection by positive technical formation on the short-term basis, which is represented by the double bottom pattern.
BestTradingSignal.com – Professional Trading Signals with high accuracy. Subscribe now to tailored packages for the world’s leading markets and receive signals instantly via Telegram from an expert team:
Check full VIP signals performance report for the week of August 18–22, 2025: Full Report
Gold price (XAU/USD) trades 0.3% lower around $3,330.00 during the European trading session on Friday. The precious metal faces selling pressure as market experts believe that Federal Reserve (Fed) Chair Jerome Powell could reiterate his argument that a “wait and see” approach on the interest rate outlook is appropriate in the current environment in his speech at the Jackson Hole (JH) Symposium at 14:00 GMT.
“The most likely scenario is that Powell won’t provide any definitive clues on what the Fed will do next ahead of critical non-farm payrolls and CPI data,” analysts at Commonwealth Bank said.
The Federal Open Market Committee (FOMC) minutes of the July monetary policy meeting also showed on Wednesday that a majority of members, including Jerome Powell, underscored the need for time to gain absolute clarity on the “magnitude and persistence of higher tariffs’ effects on inflation”.
Ahead of Fed Powell’s speech, traders have also trimmed bets supporting interest rate cuts by the Fed in the September meeting. According to the CME FedWatch tool, the probability of the Fed cutting interest rates in September has eased to 73.3% from 85.4% seen a week ago.
The maintenance of interest rates at higher levels by the Fed bodes poorly for non-yielding assets, such as Gold.
Traders raised Fed dovish bets earlier this month after the release of the Nonfarm Payrolls (NFP) report for July, which showed a significant revision in newly employed workers in May and June on the downside.
On the global front, growing uncertainty over peace between Russia and Ukraine is expected to continue supporting the Gold price. On Thursday, Moscow launched a mass attack on targets in Ukraine. This came at a time when US President Donald Trump is persuading leaders from both nations to end the three-year-long war.
Gold price trades in a Symmetrical Triangle, which indicates a sharp volatility contraction. The upper border of the above-mentioned chart pattern is plotted from the April 22 high around $3,500, while the downward border is placed from the May 15 low near $3,180.86.
The yellow metal wobbles near the 20-day Exponential Moving Average (EMA) around $3,351.00, indicating a sideways trend.
The 14-day Relative Strength Index (RSI) oscillates inside the 40.00-60.00 range, suggesting indecisiveness among market participants.
Looking down, the Gold price would fall towards the round-level support of $3,200 and the May 15 low at $3,121, if it breaks below the May 29 low of $3,245.
Alternatively, the Gold price will enter an uncharted territory if it breaks above the psychological level of $3,500 decisively. Potential resistances would be $3,550 and $3,600.
Gold has played a key role in human’s history as it has been widely used as a store of value and medium of exchange. Currently, apart from its shine and usage for jewelry, the precious metal is widely seen as a safe-haven asset, meaning that it is considered a good investment during turbulent times. Gold is also widely seen as a hedge against inflation and against depreciating currencies as it doesn’t rely on any specific issuer or government.
Central banks are the biggest Gold holders. In their aim to support their currencies in turbulent times, central banks tend to diversify their reserves and buy Gold to improve the perceived strength of the economy and the currency. High Gold reserves can be a source of trust for a country’s solvency. Central banks added 1,136 tonnes of Gold worth around $70 billion to their reserves in 2022, according to data from the World Gold Council. This is the highest yearly purchase since records began. Central banks from emerging economies such as China, India and Turkey are quickly increasing their Gold reserves.
Gold has an inverse correlation with the US Dollar and US Treasuries, which are both major reserve and safe-haven assets. When the Dollar depreciates, Gold tends to rise, enabling investors and central banks to diversify their assets in turbulent times. Gold is also inversely correlated with risk assets. A rally in the stock market tends to weaken Gold price, while sell-offs in riskier markets tend to favor the precious metal.
The price can move due to a wide range of factors. Geopolitical instability or fears of a deep recession can quickly make Gold price escalate due to its safe-haven status. As a yield-less asset, Gold tends to rise with lower interest rates, while higher cost of money usually weighs down on the yellow metal. Still, most moves depend on how the US Dollar (USD) behaves as the asset is priced in dollars (XAU/USD). A strong Dollar tends to keep the price of Gold controlled, whereas a weaker Dollar is likely to push Gold prices up.
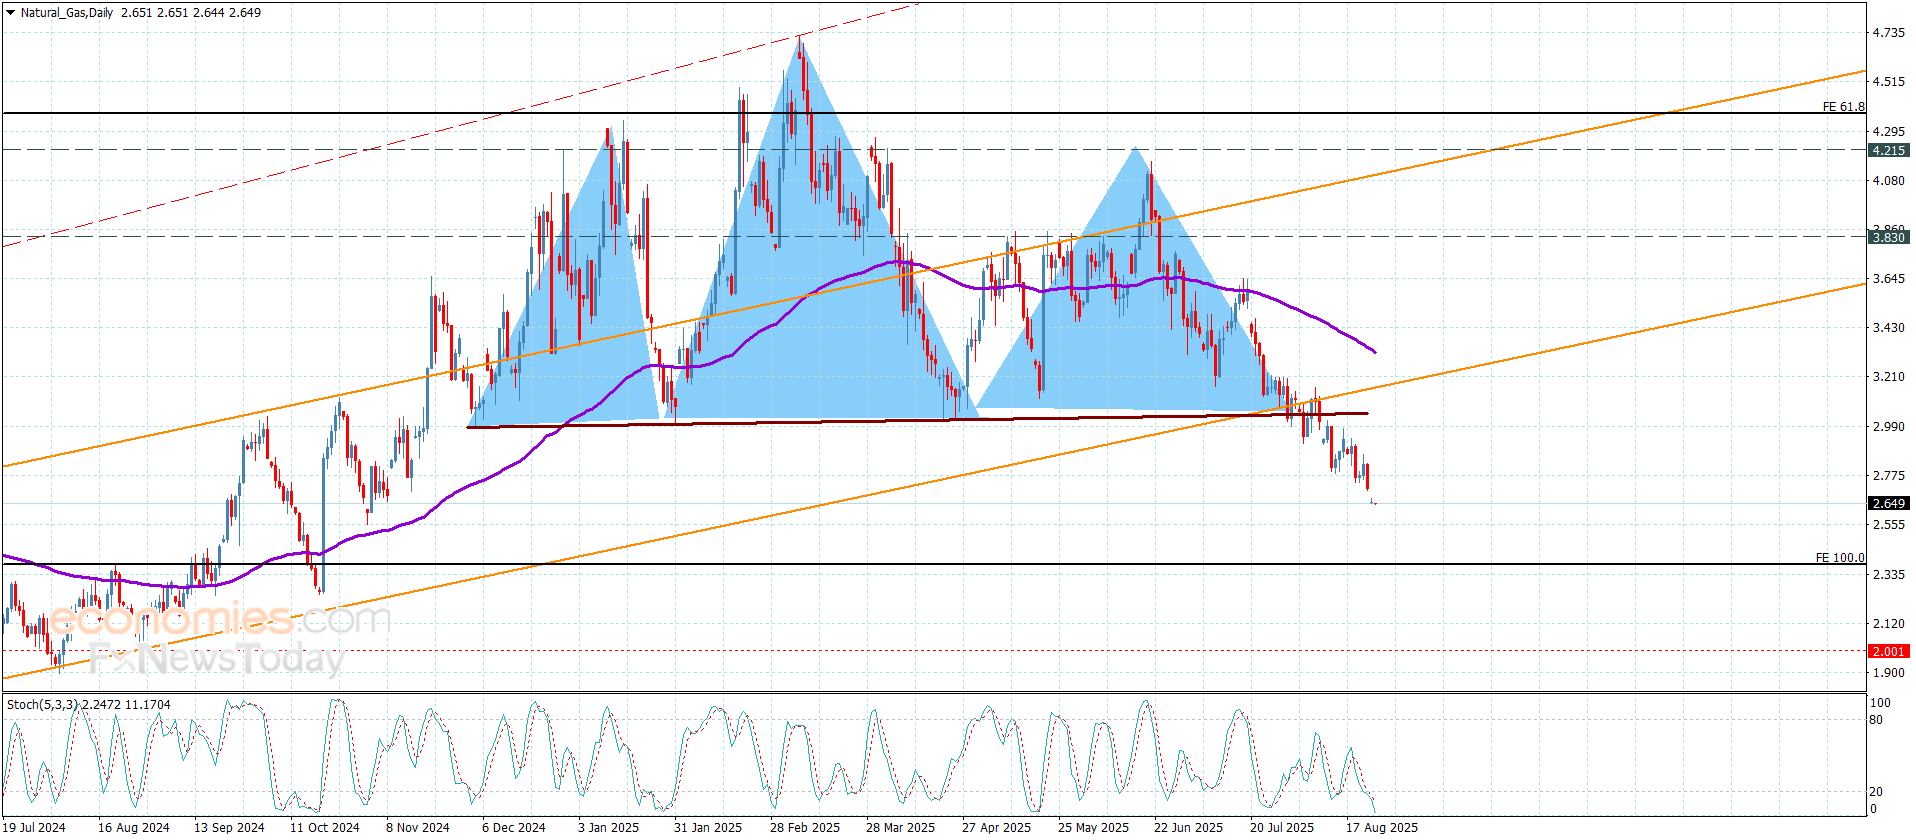
Despite today’s rebound, natural gas remains entrenched in a broader downtrend. Bearish confidence increased after a long-term dynamic support zone was decisively broken on August 12. Following that break, the anchored volume weighted average price (AVWAP) that once provided support flipped into resistance, capping further upside attempts and leading to fresh selling pressure that drove today’s new trend low.
Monday’s decline completed a 100% projection of a falling ABCD pattern at $2.63. While this target often marks a potential pivot, confirmation is lacking. Broader bearish signals remain intact, including the recent break below the April swing low at $2.86, which confirmed trend continuation. Today’s price action shows the market recognized the price level. With larger patterns pointing lower, traders should view the $2.63 level as an interim step within a continuing bearish structure.
Short-term trendlines outlining recent consolidation suggest a possible bullish falling wedge is forming. This pattern would remain valid even if natural gas declines further toward the next lower target zone between $2.54 and $2.51. This range is defined by the 78.6% Fibonacci retracement at $2.54, reinforced by a declining trendline from the 2023 peak. The confluence of technical factors makes this zone a likely magnet for price action in the near term. Once the price zone is reached, if the wedge remains intact, an upside breakout could signal a bullish reversal.
Although today’s low matched an ABCD projection, there has been no confirmation of a sustainable pivot. The lower $2.54–$2.51 support zone remains the more technically significant area. Until natural gas can reclaim and hold above $2.72, sellers remain firmly in control, with risk skewed toward a test of deeper support before any meaningful bullish reversal is likely to develop.
For a look at all of today’s economic events, check out our economic calendar.
Silver (XAG/USD) stages a sharp recovery on Wednesday after sliding to its lowest level in over two weeks, since August 4. The rebound comes as the US Dollar (USD) lost ground following renewed political pressure on the Federal Reserve (Fed), with US President Donald Trump publicly calling for the resignation of Fed Governor Lisa Cook. The safe-haven appeal of Silver re-emerged, helping the metal bounce from session lows.
At the time of writing, Silver is trading around $37.80, up nearly 1.0% on the day, having rebounded strongly from an intraday low of $36.96. The bounce coincides with growing market caution ahead of the release of the Federal Open Market Committee (FOMC) July meeting minutes at 18:00 GMT, which could offer insight into the Fed’s evolving inflation outlook and interest rate path.
From a technical standpoint, Silver is trading within a symmetrical triangle pattern on a 4-hour chart. The price rebounded sharply from the lower boundary of the triangle formation near $37.00, where buyers re-emerged and defended key support. This bounce has brought the metal back toward the 100-period Simple Moving Average (SMA), which now acts as immediate resistance near $37.76.
A sustained break above the 100-SMA could pave the way for a retest of the triangle’s upper boundary near the $38.20 psychological level. A confirmed breakout above this confluence zone would likely accelerate bullish momentum, exposing the next upside targets at $38.74—the August 14 swing high, followed by $39.53, which marks the multi-year peak.
Momentum indicators are showing early signs of a potential bullish shift. The Relative Strength Index (RSI) has rebounded after briefly dipping into oversold territory, now climbing back toward the midline, which reflects improving intraday strength and fading bearish pressure. Meanwhile, the Moving Average Convergence Divergence (MACD) histogram is narrowing, and the MACD line is approaching a bullish crossover above the signal line, another indication that downside momentum is weakening and a reversal may be underway.
On the downside, failure to clear the 100-SMA may keep the metal confined within the triangle structure. A break below the $37.00 support could trigger a bearish breakdown, exposing the next support levels at $36.50 and $35.90.
Silver is a precious metal highly traded among investors. It has been historically used as a store of value and a medium of exchange. Although less popular than Gold, traders may turn to Silver to diversify their investment portfolio, for its intrinsic value or as a potential hedge during high-inflation periods. Investors can buy physical Silver, in coins or in bars, or trade it through vehicles such as Exchange Traded Funds, which track its price on international markets.
Silver prices can move due to a wide range of factors. Geopolitical instability or fears of a deep recession can make Silver price escalate due to its safe-haven status, although to a lesser extent than Gold’s. As a yieldless asset, Silver tends to rise with lower interest rates. Its moves also depend on how the US Dollar (USD) behaves as the asset is priced in dollars (XAG/USD). A strong Dollar tends to keep the price of Silver at bay, whereas a weaker Dollar is likely to propel prices up. Other factors such as investment demand, mining supply – Silver is much more abundant than Gold – and recycling rates can also affect prices.
Silver is widely used in industry, particularly in sectors such as electronics or solar energy, as it has one of the highest electric conductivity of all metals – more than Copper and Gold. A surge in demand can increase prices, while a decline tends to lower them. Dynamics in the US, Chinese and Indian economies can also contribute to price swings: for the US and particularly China, their big industrial sectors use Silver in various processes; in India, consumers’ demand for the precious metal for jewellery also plays a key role in setting prices.
Silver prices tend to follow Gold’s moves. When Gold prices rise, Silver typically follows suit, as their status as safe-haven assets is similar. The Gold/Silver ratio, which shows the number of ounces of Silver needed to equal the value of one ounce of Gold, may help to determine the relative valuation between both metals. Some investors may consider a high ratio as an indicator that Silver is undervalued, or Gold is overvalued. On the contrary, a low ratio might suggest that Gold is undervalued relative to Silver.
The gold price (XAU/USD) is hovering near $3,365–$3,370 as markets digest Jerome Powell’s Jackson Hole remarks that tilted unexpectedly dovish. Powell noted that the “balance of risks” is shifting toward labor market weakness, with traders now pricing in an 85% probability of a 25 bps rate cut in September, up from 75% before his speech. Lower interest rates reduce the opportunity cost of holding gold, and that shift has underpinned the metal’s resilience above $3,350 despite intermittent dollar strength. Benchmark 10-year Treasury yields trade near 4.27%, while the U.S. Dollar Index (DXY) is consolidating just above 98, close to a four-week low. This dynamic—falling yields versus a still-firm greenback—is defining the near-term tug-of-war around gold’s direction.
Beyond monetary policy, geopolitical risks are injecting a safety premium into gold. Russia confirmed new Ukrainian drone strikes against energy and nuclear infrastructure in Kursk, while President Zelensky reiterated that Kyiv will “fight for freedom” on Independence Day. The escalation provides a geopolitical bid for gold, keeping safe-haven flows alive. At the same time, in Saudi Arabia, retail gold prices adjusted lower in local terms, reflecting the translation of global USD moves into regional markets. Gold traded at SAR 405.99 per gram, slightly down from SAR 406.84 on Friday, underscoring how shifts in the global market ripple across regional buyers.
The market is now bracing for Thursday’s release of U.S. Q2 GDP, expected to show 3.0% annualized growth. A stronger print risks firming the dollar further and weighing on gold, while a downside surprise would validate Powell’s dovish tilt and likely accelerate bids into bullion. Additional catalysts include this week’s inflation, personal income, and jobless claims updates, all of which could further steer Fed expectations and, by extension, gold’s positioning into September.
Gold futures opened the week above $3,417.60, the first open above $3,400 since early August, and are holding near the 20-day EMA around $3,350. On the upside, the key resistance lies at $3,400–$3,410, followed by $3,439 (July high) and the psychologically critical $3,500. A decisive break above $3,500 opens the door to $3,550–$3,600, with some houses projecting $3,700 by year-end if Fed easing combines with central bank demand. On the downside, immediate support is at $3,315 (Aug 19 low), followed by $3,285–$3,268, near the 100-day EMA. A break of $3,245 would risk a deeper slide toward $3,200–$3,121. Indicators remain mixed: the RSI sits mid-range (40–60), suggesting indecision, while Bollinger Bands are tightening, implying a volatility breakout ahead.
Structural demand remains a powerful theme. Central banks have been net buyers at 50-year highs, absorbing dips in bullion as part of diversification away from the dollar. At the same time, analysts highlight that U.S. gold reserves are at their lowest levels in 90 years, even as Treasury debt climbs to $36 trillion. Revaluation studies suggest that if U.S. gold holdings were marked against Treasury obligations at historical ratios, implied fair value could reach $25,000–$55,000 per ounce. While not immediate targets, these long-cycle comparisons highlight the imbalance underpinning long-term bullish calls.
In India, jewelers have begun seasonal stocking ahead of the festival period, but overall Asian demand remains uneven. Volatility above $3,400 has kept some retail buyers on the sidelines, though dips back toward $3,300 are sparking interest. Physical premiums in hubs like China remain elevated, signaling tight local supply despite fluctuating international benchmarks.
Bulls argue that Powell’s dovish tone, the high probability of a September rate cut, and geopolitical uncertainty create the ideal backdrop for renewed momentum. The break above $3,400 strengthens the case for retests of $3,439 and a push to $3,500, with stretch targets at $3,700 by year-end. Bears counter that gold is vulnerable to stronger-than-expected GDP and inflation prints this week, which could revive the dollar and push bullion back toward $3,285 or even $3,245. A breakdown through $3,200 risks accelerating losses to $3,121, unwinding part of the summer rally. With volatility compressing, the standoff between bulls targeting $3,700 and bears eyeing $3,200 is about to resolve decisively.
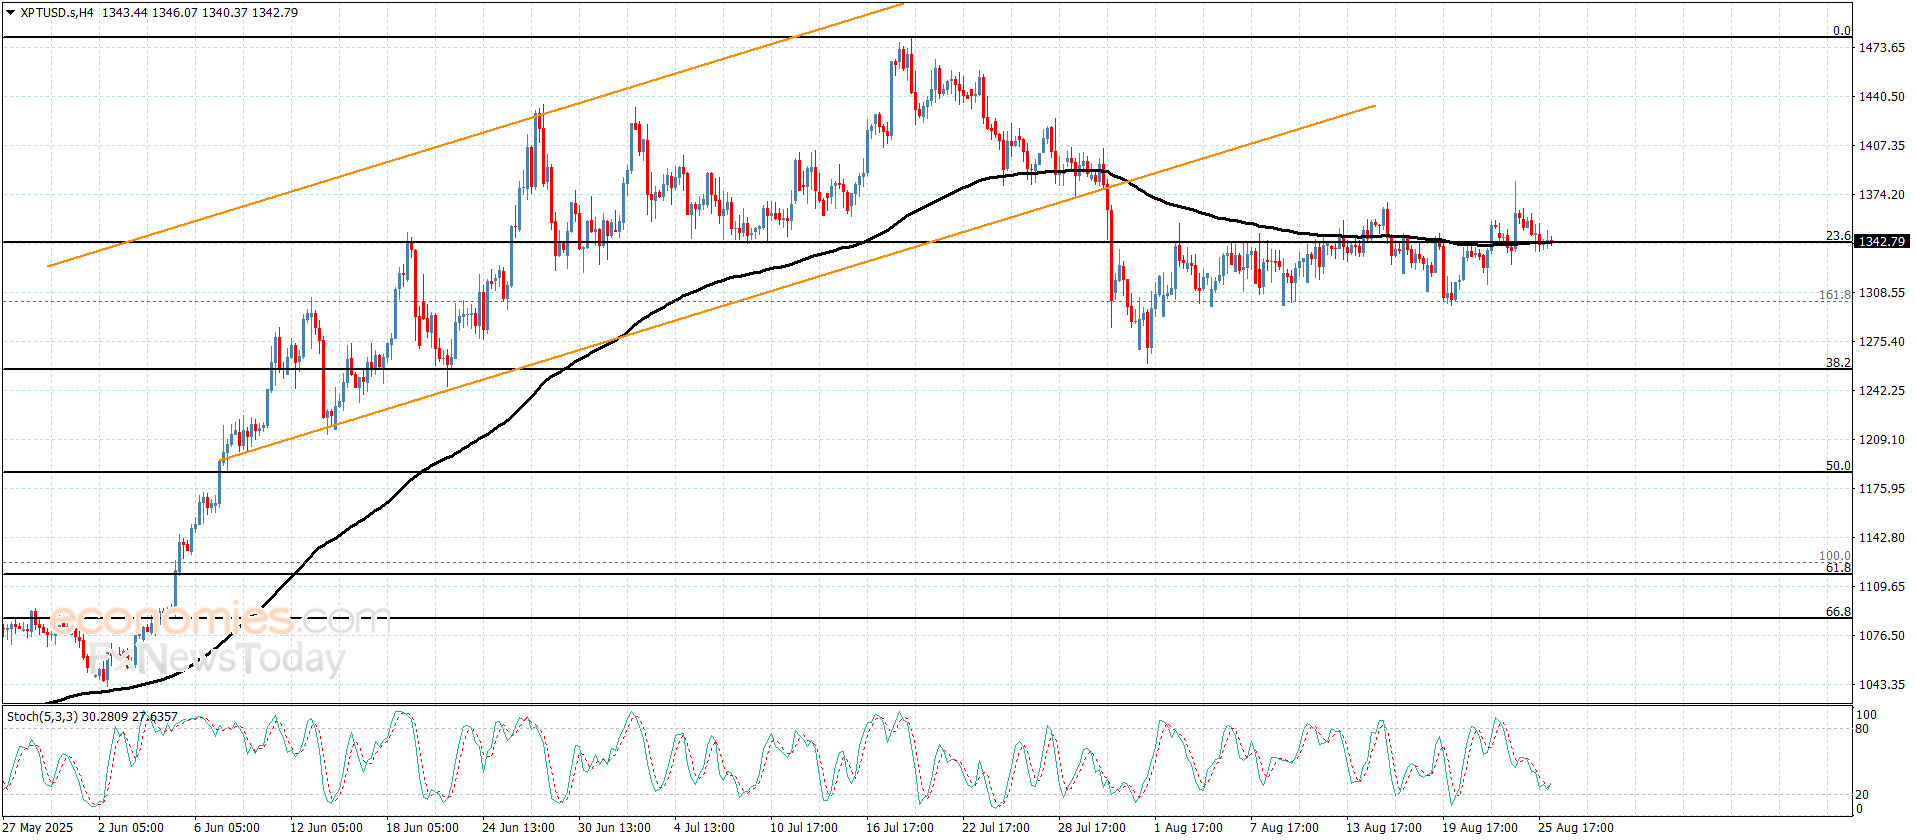
Platinum price took advantage of its repeated positive stability above the breached obstacle level at $1342.00, besides providing positive momentum by the main indicators, achieving the suggested targets by hitting $1383.60, to force it to provide some sideways trading by its fluctuation near $1355.00.
By the above image, we notice the stability of the moving average 55 near $1342.00 level, reinforcing the chances for forming an important extra support level, increasing the efficiency of the bullish track, to expect reaching $1383.00 and surpassing it will form the next main target for the bullish track at $1420.00 level.
The expected trading range for today is between $1340.00 and $1383.00
Trend forecast: Bullish

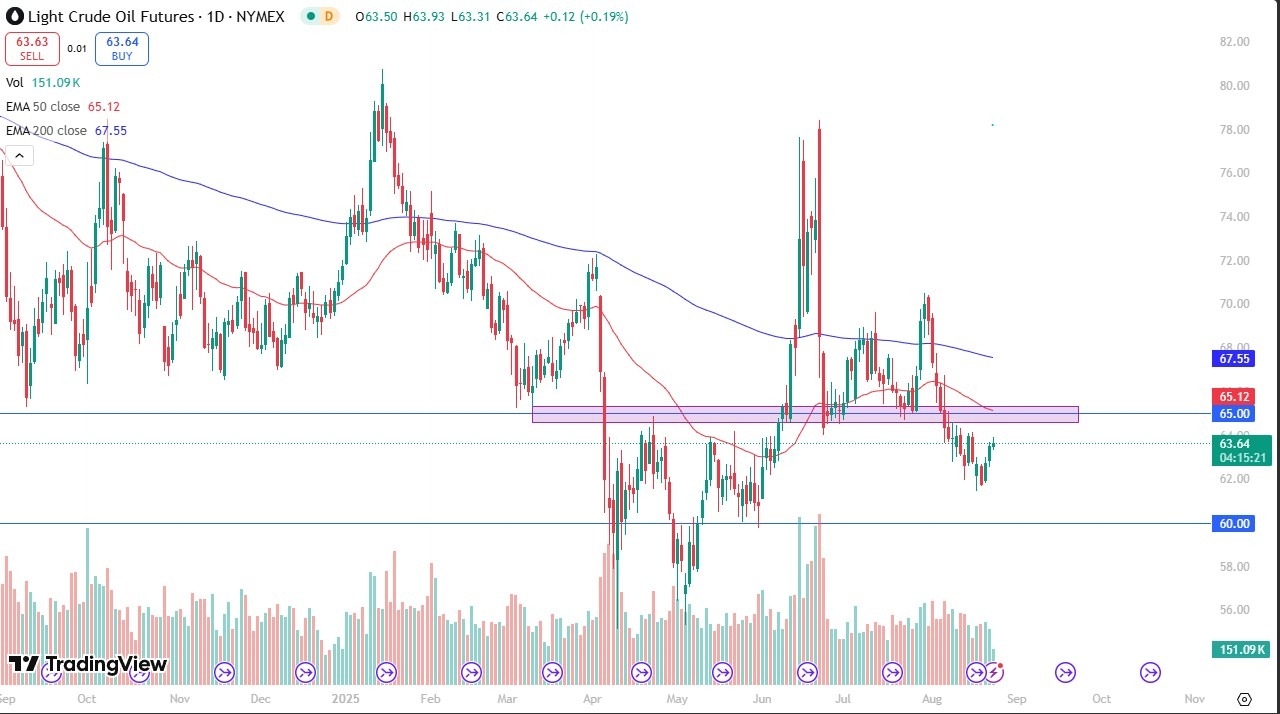
Keep in mind that the $65 level continues to be important from both a psychological standpoint, and of course from a “market memory” standpoint. It’s an area where we have seen a lot of support and resistance previously, and we do have the 50 Day EMA sitting right there as well offering resistance. If we can break above there, then the market is likely to take off toward the 200 Day EMA. On the other hand, if we reach their and show signs of exhaustion, I have no issues whatsoever in shorting the crude oil market, because there are a lot of things working against it. On a break down below the $62 level, it’s likely that WTI Crude will drop to the $60 handle.
Keep in mind that oversupply is going to continue to be a major issue here, as OPEC, Russia, and the United States are all producing massive amounts of crude oil at the moment. In fact, OPEC is set to add another 500,000 barrels to the market next month, meaning that it’s going to be very difficult for crude oil to hang on to any pricing power. This isn’t to say that we are suddenly going to fall apart and that crude oil is going to zero, but it wasn’t that long ago we had major issues with storage capacity, driving the futures markets to negative numbers. While I don’t necessarily look for that, we certainly have seen what this oversupply of crude can do to trading houses who find themselves suddenly on the hook to take delivery of something that can’t store. I think oil has plenty of headwinds at the moment.
Ready to trade daily crude oil price analysis? We’ve shortlisted the best Forex Oil trading brokers in the industry for you.
Christopher Lewis has been trading Forex and has over 20 years experience in financial markets. Chris has been a regular contributor to Daily Forex since the early days of the site. He writes about Forex for several online publications, including FX Empire, Investing.com, and his own site, aptly named The Trader Guy. Chris favours technical analysis methods to identify his trades and likes to trade equity indices and commodities as well as Forex. He favours a longer-term trading style, and his trades often last for days or weeks.