The main tag of Gold Price Articles.
You can use the search box below to find what you need.
[wd_asp id=1]
The main tag of Gold Price Articles.
You can use the search box below to find what you need.
[wd_asp id=1]
The article covers the following subjects:
Consider long positions from corrections above 67.00 with a target of 105.17–115.50.
Breakout and consolidation below 67.00 will allow the asset to continue declining to the levels of 58.50–50.00.
A descending correction (2) appears to have formed on the weekly chart, with wave C of (2) completed as its part. On the daily time frame, an ascending wave (3) is likely developing. Within it, the first wave of smaller degree 1 of (3) has formed, a downward correction 2 of (3) has been completed, and wave 3 of (3) has started forming. Wave i of 3 is still developing on the H4 chart, with a local correction (ii) of i completed as part of its structure. If the presumption is correct, WTI will continue to rise to 105.17–115.50 in wave (iii) of i. The level of 67.00 is critical in this scenario as a breakout below it will enable the asset to continue declining to the levels of 58.50–50.00.
This forecast is based on the Elliott Wave Theory. When developing trading strategies, it is essential to consider fundamental factors, as the market situation can change at any time.
The content of this article reflects the author’s opinion and does not necessarily reflect the official position of LiteFinance broker. The material published on this page is provided for informational purposes only and should not be considered as the provision of investment advice for the purposes of Directive 2014/65/EU.
According to copyright law, this article is considered intellectual property, which includes a prohibition on copying and distributing it without consent.
As summer enters its final stretch, the U.S. natural gas market remains well supplied despite higher year-over-year demand trends. According to preliminary data from Rystad Energy, total natural gas demand, including exports, of more than 118 Bcf per day through July is running 2.5 percent above the same period in 2025. Growth has been driven by LNG feedgas deliveries and higher power sector consumption despite flagging industrial and residential/commercial demand signals. On the supply side, dry gas production for the year so far has averaged 111.1 Bcf per day, 4.3 percent higher than year-ago levels, and underground storage inventories remain nearly 7 percent above the five-year average.
Looking ahead, 2026 average annual daily production is expected to rise 4.7 percent over 2025 levels, according to recent forecasts from Rystad Energy. Despite an expected increase in total natural gas demand of nearly 3 percent year over year, Rystad Energy lowered its price forecast in the July North America Gas Market Report (July Market Report). The current forecast now expects Henry Hub prices to average $3.31 per MMBtu in 2026, down 6.2 percent from the June forecast, on a looser market and bearish market fundamentals.
Natural gas prices declined in July amid record production and softer LNG feedgas demand. Henry Hub futures prices fell nearly 15 percent for the month, from $3.22 per MMBtu on July 1 to $2.75 per MMBtu on July 31. In the day-ahead spot market, Henry Hub prices followed a similar trend, declining 22.7 percent from $3.35 per MMBtu on July 1 to $2.59 per MMBtu on July 31, according to data from Argus Media.
Average day-ahead spot prices fell to discounted levels in most regions relative to Henry Hub during July as regional supply and demand dynamics influenced local pricing (all in $/MMBtu):
Most regional indexes averaged below Henry Hub during July. Regional average price differentials ranged from nearly flat in Louisiana/Southeast and the Northeast, to discounts greater than $0.70 per MMBtu in the Rockies/Northwest, Southwest, and Appalachia.
Both spot prices and futures at Henry Hub have remained below $3 in August to date, reinforcing recent bearish trends. As of August 5, prices settled at $2.69 per MMBtu in the day-ahead spot market and $2.60 per MMBtu in the futures market.
The U.S. experienced a two-week decline in temperatures through the end of July, even as conditions remained above the 30-year normal. For the week ending August 1, temperatures were 6.7 percent cooler than the same week last year but 10.7 percent warmer than the 30-year normal, according to cooling degree days (CDDs) weighted by electric home air conditioning customers. Regionally, CDD data were mixed, with four regions – the West North Central, West South Central, Mountain, and Pacific – running warmer than last year. All but three regions – the Middle Atlantic, East North Central, and New England – were warmer than normal. Despite the late-month moderation, July finished 1.1 percent warmer than last year and 18.4 percent warmer than normal.
The National Oceanic and Atmospheric Administration’s (NOAA) 8–14-day temperature outlook for August 13–19 favors above-normal temperatures across much of the continental U.S., Alaska, and Hawaii. The highest probabilities are expected across the South and Midwest, where chances exceed 60 percent in portions of the Gulf Coast states, Oklahoma, and Arkansas. Near- and below-normal temperatures are favored across the Northeast and portions of the northern tier. At the time of writing, NOAA’s National Hurricane Center is monitoring two disturbances in the Pacific, each with a less than 40 percent chance of cyclone formation in the next seven days. No tropical cyclone activity is expected in the next seven days in the Atlantic.
Total natural gas demand, including exports, averaged 113.8 Bcf per day in July, rising 2.8 percent above the previous record for the month set in July 2025, according to preliminary data from Rystad Energy. Growth was driven primarily by higher export demand, with LNG feedgas and pipeline exports to Mexico increasing 7.8 percent year-over-year. Domestic demand also increased, supported by record electric power consumption and higher industrial natural gas demand. Preliminary data from Rystad shows that electric power demand averaged 49.6 Bcf per day in July, which would be a new monthly record for the sector, while industrial consumption rose 3.2 percent year-over-year. Residential and commercial demand declined year-over-year, averaging 3.3 Bcf per day in July.
Month-over-month trends were more mixed. LNG exports averaged 15.8 Bcf per day in July, declining 1.2 percent from June due to the ongoing Freeport LNG outage and slower-than-expected Golden Pass LNG ramp-up. However, total export demand still increased 2.0 percent month-over-month, supported by a 10.4 percent increase in pipeline exports to Mexico amid strong cooling demand.
Dry natural gas production averaged 112.2 Bcf per day in July, up 3.9 percent from July 2025 and marking a record high for the month, according to preliminary data from Rystad Energy. In its July Market Report, Rystad revised its forecast for 2026 exit-to-exit production growth to 2.8 Bcf per day, meaning production at year-end 2026 is expected to be 2.8 Bcf per day higher than at year-end 2025. This is up from the 2.4 Bcf per day increase projected in its June forecast. Production growth has been concentrated in the Haynesville Basin, where the company Citadel-backed Apex has accounted for more than 800 MMcf per day of growth so far in 2026. Looking ahead, Rystad expects exit-to-exit production growth to accelerate to 5.0 Bcf per day in 2027, supported by stronger LNG capacity additions and rising natural gas demand from AI data centers.
In July, LNG feedgas flows averaged 17.4 Bcf per day, declining 1.2 percent from June and remaining below early-year highs of nearly 19 Bcf per day, according to preliminary data from Rystad Energy. Rystad Energy’s July Market Report attributed the decline to another maintenance period at Freeport LNG, which began in early July and is expected to continue through the end of August. Flows have averaged approximately 0.7 Bcf per day below normal intake levels during the outage. Feedgas intake at Golden Pass LNG also remained below expected levels as the facility’s ramp-up progressed more slowly than anticipated. The combination of reduced LNG feedgas demand has contributed to additional supply availability in the domestic market, supporting downward pressure on natural gas prices.
According to Reuters, the July slowdown in U.S. LNG exports coincided with higher global natural gas prices. Preliminary data from financial firm LSEG indicate that exports declined by 0.1 million metric tons (MMT), from 10.6 MMT in June to 10.5 MMT in July. Over the same period, prices increased at key Asian and European trading hubs. Asia’s benchmark Japan Korea Marker averaged $19.10 per MMBtu in July, increasing 10.2 percent from June, while Europe’s Dutch Title Transfer Facility averaged $18.07 per MMBtu, up 37.0 percent from the June average. Europe remained the primary destination for U.S. LNG cargoes as buyers continued to replenish storage inventories ahead of the winter heating season. U.S. LNG shipments to Europe increased to 4.8 million metric tons (MMT) in July from 4.4 MMT in June, accounting for nearly half of total U.S. LNG exports.
In other LNG news:
The EIA reported a 33 Bcf net injection into underground storage for the week ending July 31, bringing lower 48 natural gas inventories to 3,117 Bcf. The weekly refill was driven by net injections of 24 Bcf and 20 Bcf in the East and Midwest, respectively, while other regions posted net withdrawals of up to 6 Bcf in the South Central. Working gas stocks now sit 6.7 percent above the five-year average but 0.4 percent below year-ago levels. Regional storage inventories remain in surplus territory relative to their respective five-year averages, while only the East and Midwest remain above year-ago levels.
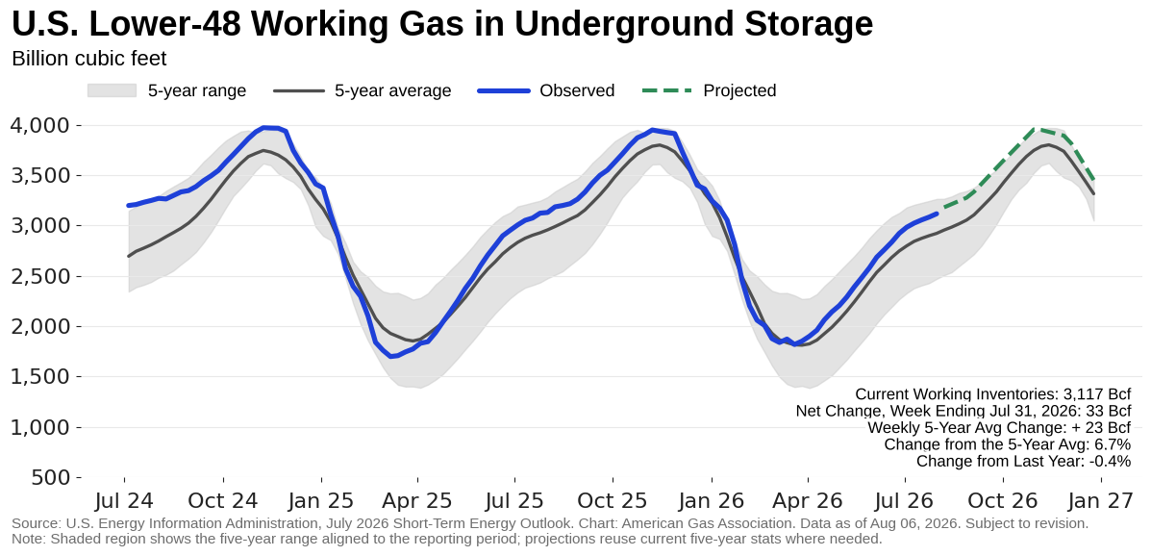
After adjusting for weather, July storage injections averaged 1.2 Bcf per day higher than normal, according to Rystad Energy’s July Market Report.
Cross-border pipeline flows showed mixed trends for the week ending August 5, according to preliminary data from Rystad Energy. Compared to last week, imports from Canada and exports to Mexico decreased, falling 2.1 percent and 5.0 percent, respectively. On a year-over-year basis, imports to Canada decreased by 8.1 percent while exports to Mexico rose 7.9 percent on higher cooling demand.
The EIA reports that the value of natural gas trade with Canada increased in 2025, as natural gas prices increased from 2024 all-time lows on an inflation adjusted basis. U.S. natural gas exports to Canada, made up primarily of pipeline exports, averaged 2.8 Bcf per day, up 4 percent year over year, and increased 77 percent in value to $2.6 billion. At the same time U.S. imports from Canada averaged 8.6 Bcf per day in 2025, 1 percent above 2024 levels, while the value of those imports increased by 52 percent.
U.S. drilling rig count increased by one for the week ending July 31, bringing the total count to 588, according to data from Baker Hughes. This increase was driven by oil-directed rigs, rising by one to 451, while natural gas-directed rigs and miscellaneous rigs remained unchanged at 127 and ten, respectively. Total U.S. rigs are up 48 from the same week last year, an increase of 8.9 percent. Natural gas-directed rigs increased by three for this period, a 2.4 percent increase, with oil rigs up 41, a 10 percent increase.
For questions please contact Juan Alvarado | jalvarado@aga.org, Liz Pardue | lpardue@aga.org, or Lauren Scott | lscott@aga.org
To be added to the distribution list for this report, please notify Lucy Castaneda-Land | lcastaneda-land@aga.org
Notice
In issuing and making this publication available, AGA is not undertaking to render professional or other services for or on behalf of any person or entity. Nor is AGA undertaking to perform any duty owed by any person or entity to someone else. Anyone using this document should rely on his or her own independent judgment or, as appropriate, seek the advice of a competent professional in determining the exercise of reasonable care in any given circumstances. The statements in this publication are for general information and represent an unaudited compilation of statistical information that could contain coding or processing errors. AGA makes no warranties, express or implied, nor representations about the accuracy of the information in the publication or its appropriateness for any given purpose or situation. This publication shall not be construed as including advice, guidance, or recommendations to take, or not to take, any actions or decisions regarding any matter, including, without limitation, relating to investments or the purchase or sale of any securities, shares or other assets of any kind. Should you take any such action or decision; you do so at your own risk. Information on the topics covered by this publication may be available from other sources, which the user may wish to consult for additional views or information not covered by this publication
Data Disclaimer Notice: S&P Global Energy
Reproduction of any information, data or material, including ratings (“Content”) in any form is prohibited except with the prior written permission of the relevant party. Such party, its affiliates and suppliers (“Content Providers”) do not guarantee the accuracy, adequacy, completeness, timeliness, or availability of any Content and are not responsible for any errors or omissions (negligent or otherwise), regardless of cause, or for the result obtained from the use of such Content. In no event shall Content Providers bed liable for any damages, costs, expenses, legal fees, or losses (including lost income or lost profit and opportunity costs) in connection with any use of the Content. A reference to a particular investment or security, a rating or any observation concerning an investment that is part of the Content is not a recommendation to buy, sell or hold such investment or security, does not address the suitability of an investment or security and should not be relied on as investment advice. Credit ratings are statements of opinions and are not statement of fact.
Copyright © 2026 American Gas Association. All rights reserved.Natural Gas Market Indicators – July 9, 2026
Every major industrial transition in modern history has been preceded by a period where the physical inputs required for that transition are systematically undervalued. The electrification of the twentieth century, the postwar manufacturing boom, the infrastructure buildout of emerging markets in the 2000s — each of these cycles began with commodities priced as mundane inputs and ended with them priced as strategic necessities. The question worth asking today is not whether copper is heading higher, but whether the magnitude of the move ahead has been genuinely absorbed by markets.
The answer, according to a growing number of commodity analysts and institutional market participants, appears to be no. The structural case for copper reaching extraordinary price levels over the next several years is not built on a single demand driver or a temporary supply shock. It is built on the convergence of multiple independent demand forces — AI infrastructure, energy transition electrification, and industrial reshoring — colliding simultaneously with a supply chain that requires a decade or more to meaningfully respond.
Understanding the scale of the copper price to $40,000 thesis requires grounding the conversation in current market data. As of May 2026, LME copper spot prices were tracking near $13,483 per tonne, according to FRED data series. The metal had already reached a record high of approximately $13,967 per tonne in January 2026, according to Reuters reporting at the time.
The $40,000 per tonne forecast, most prominently associated with commodities trader Pierre Andurand’s four-year projection framework, represents a fundamentally different price regime. To contextualise that number:
| Benchmark | Price | Context |
|---|---|---|
| LME Copper Spot (May 2026) | ~$13,483/tonne | FRED data series |
| LME Record High | ~$13,967/tonne | January 2026, Reuters |
| $40,000/tonne Target | ~$18.14/lb | Andurand four-year forecast |
| Implied Upside from Jan 2026 Record | ~+186% | If $40,000 target is reached |
A move of this magnitude would be classified, in commodity cycle terminology, as a classic boom-bust formation completing its final phase. It is precisely the kind of triple-digit percentage move that experienced commodity investors specifically watch for — and that, according to certain market participants, has not yet materialised for copper in the way it already has for gold and silver.
One market commentator with decades of experience tracking commodity cycles has noted that copper has not yet made the kind of explosive, parabolic move that characterises the final stage of a commodity supercycle. Gold and silver completed significant portions of that arc in recent years. Copper, by contrast, has been rising gradually — which from a contrarian, cycle-aware perspective, suggests the largest portion of the move may still lie ahead.
What distinguishes the current copper thesis from previous commodity bull narratives is that the demand drivers are not variations on a single theme. They are structurally independent, additive, and operating on different timescales. Furthermore, critical minerals demand across each of these sectors is accelerating simultaneously, compounding the pressure on available supply.
Renewable energy infrastructure is materially more copper-intensive per megawatt of generating capacity than fossil fuel systems. Wind turbines, solar installations, transmission upgrades, and battery storage infrastructure all require substantial copper at every layer. This is not a speculative demand driver — it is a function of physics and engineering.
This is the demand driver that most investors have been slowest to fully quantify. Physical AI infrastructure is copper-intensive at a scale that is easy to underestimate. Server farms, high-voltage cabling, power distribution systems, cooling infrastructure, and grid connections all consume copper in significant quantities.
One informed market perspective frames this dynamic clearly: America’s push to deploy AI at scale and compete with China’s technological ambitions represents an enormous capital demand that flows directly into copper-intensive physical infrastructure. Hyperscale computing companies are already absorbing disproportionate amounts of available capital in credit markets, which has a secondary effect of tightening liquidity for traditional industrial borrowers — a dynamic that constrains new supply development precisely when demand is accelerating.
The US-China industrial competition has moved beyond trade policy into a full-scale economic mobilisation. Rebuilding domestic manufacturing capacity, securing strategic supply chains, and developing the physical infrastructure required to compete at an industrial level all require significant copper inputs. This is an economy-of-war dynamic operating at a peacetime industrial scale. The base of the value pyramid — the raw material inputs that underpin everything from consumer electronics to defence systems — is being revalued from commodity-level pricing toward something closer to a strategic necessity.
The core insight here is that copper functions as an economic chokepoint. It is not merely an input — it is a bottleneck. And the scale of what is being built simultaneously across AI, energy, and reshoring means that bottleneck is tightening from multiple directions at once.
A critical distinction that often gets lost in copper market commentary is the difference between a supply shortage and a demand acceleration event. Current copper production and recycling volumes are substantial. There is not, at this moment, a dramatic shortfall in available copper. What is happening is something more structurally significant: an unprecedented acceleration in demand is colliding with a supply chain that simply cannot respond quickly enough.
Mine development timelines illustrate the problem precisely. The copper supply crunch stems not from a lack of geological resources, but from the structural inability of the industry to bring new capacity online quickly enough. Consequently:
This supply response lag is structural, not cyclical. It cannot be solved by a price signal alone, because even a dramatically higher copper price today would not produce meaningful new supply for most of this decade. The market is being asked to fund infrastructure-level demand growth using a supply chain that operates on geological timescales.
One of the more reliable indicators that institutional participants believe a commodity price move is imminent is large-scale merger and acquisition activity within that sector. Anglo American’s progression toward combining operations with Glencore in what would constitute a major copper mining entity is particularly instructive. When organisations of that scale are willing to restructure and take on the execution risk of a significant merger, it signals that the people with the deepest operational knowledge of the sector believe the upside justifies the risk.
Furthermore, majors and junior partnerships are increasingly forming as larger players seek to lock in future copper resources through strategic stakes in earlier-stage projects. This is not coincidental. Mining company executives and institutional shareholders with direct geological and operational visibility are making large bets on copper’s future price trajectory. That institutional behaviour is worth treating as a signal, not merely as background noise.
The intuitive response to a commodity bull thesis is to seek maximum leverage through small-cap explorers and junior developers. The logic appears straightforward: if copper triples, a small mining company with copper in the ground should multiply many times over. In practice, this reasoning consistently underestimates the structural risks that are specific to junior mining.
A principle that has been articulated by experienced commodity investors for generations holds that the fastest way to destroy value in mining is to start digging a hole. The Mark Twain observation that a mine is a hole in the ground with a liar at the top and a fool at the bottom remains more operationally relevant than most retail investors appreciate.
The specific failure modes in junior and mid-tier mining include:
Recognising management red flags early is therefore essential for anyone considering exposure through smaller operators, as the warning signs are often present long before the financial damage becomes apparent.
Margins not expanding despite rising spot prices is one of the clearest red flags available to investors in mining companies. If a company cannot convert a significant commodity price appreciation into proportional earnings growth, the question of where those economics are going deserves a direct answer.
The comparison table below illustrates the risk-adjusted tradeoffs across different copper investment vehicles:
| Investment Vehicle | Leverage to Copper Price | Key Risk Factors | Liquidity |
|---|---|---|---|
| Major diversified miners (BHP, Rio Tinto) | Moderate | Hedging, diversification dilutes exposure | High |
| Pure-play large-cap copper producers | High | Operational surprises, hedging disclosure | High |
| Mid-tier copper developers | Very High | Financing risk, execution risk | Moderate |
| Junior copper explorers | Extreme | Geological risk, management quality, dilution | Low |
| Copper ETFs / futures | Direct price exposure | Contango drag, no equity leverage | High |
Gold and silver have both undergone significant price appreciation over recent years, completing what experienced cycle observers describe as a classic boom-bust formation arc. The precious metals have reached levels where the incremental upside, while potentially real, is being measured in percentages rather than multiples.
Copper has not yet completed that formation. It has been rising, but without the parabolic blow-off phase that characterises the final stage of a commodity supercycle. For investors oriented toward return asymmetry, this is a materially different positioning opportunity.
The framing that some sophisticated market participants use is direct: achieving 25% annual returns through diversified, lower-risk positions is achievable without requiring significant commodity exposure. Choosing to take on commodity risk is only justified if the potential return is of a genuinely different order of magnitude. A triple-digit percentage move qualifies. An incremental 20-30% upside in a metal already trading near all-time highs does not, by that logic, justify the same level of conviction.
Understanding how different types of investors approach commodity markets helps explain why copper may still be underappreciated despite the structural case being relatively clear. Four distinct archetypes exist in resource markets:
The consistent insight from experienced commodity investors is that geological and quantitative analysis is the most durable edge available in this sector. Once an investor has been misled by a compelling narrative attached to a poor geological asset, the pattern recognition that develops from that experience is valuable. However, skilled promoters in junior mining are extraordinarily persuasive, and the stories rarely change — only the names of the projects and the people telling them do.
One underappreciated approach to capturing commodity exposure involves specifically seeking assets that are undervalued precisely because they are currently unfashionable. Large, well-capitalised commodity businesses trading at deep value multiples with reliable dividend yields present a fundamentally different risk profile than junior explorers with compelling narratives.
The contrarian logic is straightforward: when an asset is genuinely disliked by the market, the selling pressure has already been absorbed. When sentiment eventually turns — whether driven by earnings improvement, commodity price appreciation, or simply a rotation in market attention — the re-rating happens quickly and those who positioned early capture the majority of the move.
In addition, copper investment strategies that focus on contrarian value positioning rather than narrative-driven speculation tend to produce more consistent outcomes across commodity cycles. The commodity to watch is not the one generating the most headlines, but the one that has not yet attracted sufficient attention to have priced in the structural demand story quietly building beneath the surface.
The $40,000 per tonne forecast is based on the convergence of structural demand growth across AI infrastructure, energy transition electrification, and industrial reshoring, combined with a supply chain that requires 10 or more years to meaningfully expand capacity. It represents a scenario where demand acceleration significantly outpaces supply response over a multi-year period.
The $40,000 target is most prominently associated with commodities trader Pierre Andurand, who outlined a four-year forecast framework placing copper in a fundamentally different price regime driven by the demand dynamics described above.
Andurand’s framework operates on approximately a four-year timeline from the point of the forecast. This is consistent with the mine development lag that prevents new supply from responding quickly to price signals.
As of May 2026, LME copper spot was tracking near $13,483 per tonne. The January 2026 record high was approximately $13,967 per tonne.
The term shortage is somewhat misleading. Current production is substantial, and recycling adds meaningful volume. The more precise framing is that a supply tightening exists, and the primary driver of the bull thesis is a demand acceleration that the existing supply chain cannot match. The shortage, if it materialises, will be a future condition created by demand outpacing a structurally constrained supply response.
Large-cap pure-play copper producers carry the most direct earnings leverage to a sustained copper price increase. Diversified majors with significant copper operations also benefit, though the effect is diluted by other commodity exposures. Infrastructure and electrical equipment manufacturers would see input cost pressures, partially offsetting their operational tailwinds.
Options include large-cap copper producer equities, copper-focused ETFs, and commodity futures for sophisticated investors comfortable with contango dynamics. Each vehicle carries different risk-reward characteristics. Retail investors should conduct independent research and consider professional financial advice before taking positions in any commodity-linked investment. This article does not constitute financial advice.
The structural bull case for the copper price to $40,000 can be summarised concisely:
The commodity cycle framework that experienced investors have used for decades remains relevant: the time to establish meaningful exposure is before the parabolic phase, not during it. Once copper completes the boom-bust formation that gold and silver have already partly traced, the opportunity to position at current levels will have passed.
This article is intended for informational and educational purposes only. It does not constitute financial advice, investment recommendations, or an offer to buy or sell any financial product. Commodity markets are volatile and involve significant risk of loss. Past price cycles are not a reliable indicator of future outcomes. Readers should seek independent financial advice before making investment decisions.
Discovery Alert’s proprietary Discovery IQ model scans ASX announcements in real time, instantly identifying significant mineral discoveries — including copper — and translating complex geological data into actionable insights before the broader market has a chance to react. Explore historic examples of major discovery returns and begin your 14-day free trial at Discovery Alert to secure your market-leading edge.
Domestic coffee prices today
Coffee prices today in the domestic market turned down sharply after the previous increase session. According to giacaphe. com, the average coffee price on August 7 was 97,400 VND/kg, down 1,500 VND/kg compared to the previous day. The highest level in key regions of the Central Highlands was recorded at 97,500 VND/kg.
In Dak Lak, coffee prices were recorded at 97,300 VND/kg, down 1,500 VND/kg compared to the previous session.
In Lam Dong, coffee price today reached 96,800 VND/kg, down 1,500 VND/kg.
In Gia Lai, coffee prices are at 97,300 VND/kg, down 1,500 VND/kg compared to the previous day.
The old Dak Nong area recorded a level of 97,500 VND/kg, down 1,500 VND/kg.
After the increase brought prices close to 99,000 VND/kg, the domestic coffee price level has receded deeply to the 97,000 VND/kg zone. The decrease range of 1,500 VND/kg caused domestic prices to lose most of the increase of the previous session.
World coffee prices
In the world market, coffee prices fell on both the London and New York exchanges.
According to Barchart, the September 2026 Arabica futures contract closed down 5.25 US cents/lb, equivalent to 1.61%. The final price was recorded at 321.65 US cents/lb.
Robusta London also fell more sharply in percentage margin. Robusta contract for September 2026 delivery fell 93 USD/ton, equivalent to 2.39%, to 3,798 USD/ton.
This development creates clear pressure on domestic coffee prices, as Robusta London is an important reference for Vietnamese coffee.
Coffee price assessment
Coffee prices today decreased in the same direction as the world market. Robusta lost nearly 100 USD/ton in the most recent session, making it difficult for domestic purchasing prices to maintain the close range of 99,000 VND/kg.
According to Barchart, coffee prices fall as drier weather forecasts in Brazilian coffee growing areas may help coffee beans dry faster and support farmers to accelerate harvest progress. Barchart also quoted Somar Meteorologia as saying that the Minas Gerais region did not record rain in the week ending August 2.
On the supporting side, the progress of Arabica harvesting in Brazil is still slower than the same period. Barchart recorded that Cooxupe cooperative members harvested 67.3% of the expected output as of July 31, lower than 74.2% in the same period last year. However, this factor was not enough to stop the decline in the recent session.
Regarding domestic weather, the National Center for Hydro-Meteorological Forecasting said that on the day and night of August 7, the Central Highlands area will have showers and thunderstorms in some places; especially in the afternoon and evening, there will be scattered showers and thunderstorms, locally heavy rain. Lowest temperature 20-23 degrees C, highest temperature 27-30 degrees C.
This season’s thunderstorms need to be monitored in terms of garden care, pest and disease prevention, and goods preservation.
Coffee prices today decreased sharply domestically and in the same direction as Robusta and Arabica in the world. In the coming sessions, developments on the London exchange, New York exchange, USD/VND exchange rate and demand for export purchases will continue to dominate the domestic price level.
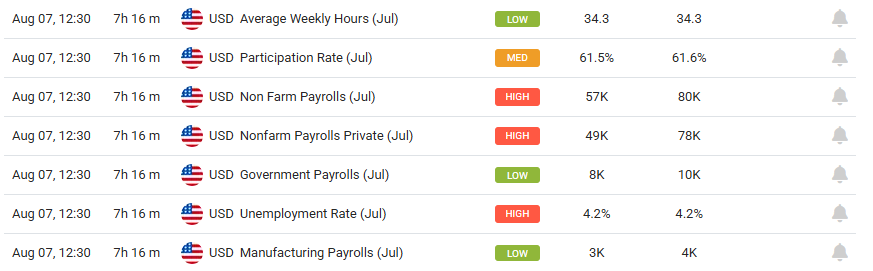
Gold (XAU/USD), trading around $4,254, is on pace for its most profitable weekly close since January after rising 5% this week. Falling oil prices, a weaker dollar, and declining Treasury yields have driven recent movement. In combination with weaker private-sector hiring, expectation for a September Fed rate hike has decreased. The key fundamental data will be today’s U.S. Non-Farm Payrolls, reported at 8:30 a.m. ET. According to the Reuters poll, private-sector payrolls are expected to add 80,000, while the unemployment rate remains unchanged at 4.2%.
Gold has shifted from consolidation to strong recovery. However, buyers will need to push the breakout further after Friday’s labor report. XAU/USD may find a floor near $4,200 in response to falling yields and soft payrolls. However, stronger payrolls and wages may predict Fed tightening and profit-taking.
As the most recent labor data sent mixed signals, the data clearly showed a decline in hiring momentum. ADP data showed that private-sector employers added 44,000 jobs in July, revised down from 95,000 in June and below expectations which were between 70,000-75,000. Limited job growth came from the services sector, while the goods-producing sector saw a decline.
The soft hiring data and falling yields and dollar support gold. Non-yielding bullion benefits from falling yields, as the opportunity cost for holding gold decreases.
Initial jobless claims slightly increased to 199,000 for the week ending August 1 and are still at low levels historically. Continuing claims increased to about 1.80 million, and layoffs decreased to a two-year low. Reuters noted the numbers point to a stable labor market with low hiring.
Traditionally, demand and supply in the labor market have created an environment of “slow-hire, slow-fire,” but no significant labor downturn has been observed.
Friday has been marked on the calendars for the official employment report, as it has become the most important short-term event. According to the latest Reuters poll, the Non-Farm Payroll numbers for the month of July should be around 80,000, up from 57,000 in June. The unemployment rate is projected to stay flat at 4.2%. Annual wage growth is expected to be around 3.5%.
The report should be out by 8:30 am EDT, so until then, any numbers are simply estimates. A significant shortfall in the payrolls (80,000) combined with lower wage growth or downward revisions to wage growth would likely push Treasury yields lower and increase support for gold, as it would give the Fed more reason to pause in September.
For a strong NFP report, the contrary would happen. Markets are indicating that the inflation outlook is unfettered and containment measures cannot yet be applied. Reuters is reporting a 55% chance of an increase in September, down from 63% the previous week. The Fed still has time to consider the data.
For the first time in months days, falling energy prices have helped drive the gold markets in the strongest direction. Gold has a inverse relation to the inflation cycle in that falling oil prices and inflation reduces the need for the Federal Reserve to raise interest rates, which have the most impact on gold in 2026.
The initial U.S.-Iran conflict created and sustained an environment of geopolitical uncertainty that did not impact gold because both oil and inflation, and yields and the dollar were high. Without the conflict, energy inflation and yields will improve for gold in 2026 as yields and inflation will trend lower.
On Friday, gold spot prices increased by 5 percent, which was an indication that gold’s strongest weekly return was about to be realized since January.
The continuous buying of gold to protect against potential geopolitical instability provides a foundation for the price of gold to increase in the long term despite downturns in the market.
The World Gold Council has shown that due to the liquidity and diversification that gold provides, gold is used by Central Banks for protection against geopolitically and financially risky investments and thus gold will retain its value for the longer term more so than other investments due to interest rates, dollar and geopolitical risk.
In 2026, the price of gold improved from the record low of $4,000 in June to $4,250. The macro status of gold and the improvement of the economy was reflected in its price, however, the jobs report from Friday was still able to negatively impact gold’s price.
Gold keeps its bullish sentiment by breaking through the descending trend line and the symmetrical triangle that lasted multiple weeks. Currently, the price stands at $4,254, just below Thursday’s seven-week high.
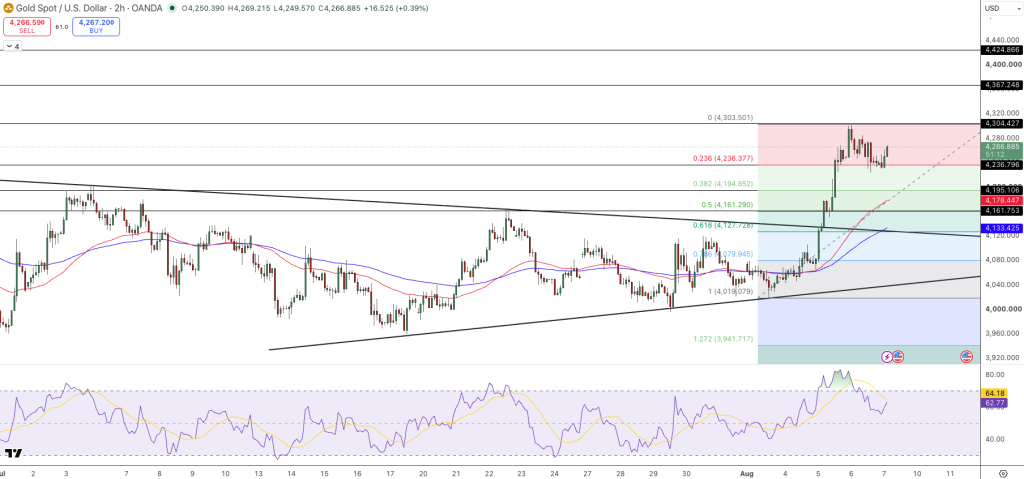
Gold remains above the 50-period EMA at $4,178 and the 100-period EMA at $4,133. After going into the overbought region, the RSI has retreated and the price has shown a lack of upward momentum.
Gold has maintained its bullish behavior as long as the price remains above the $4,236 support level. If the resistance of $4,280 is broken, price targets become $4,303 and $4,367, while a break of $4,195 would indicate the exhaustion of the post-breakout bullish momentum.
Gold is appreciating this week in conjunction with declining Oil prices, decreased U.S. hiring, diminished expectations for an additional Federal Reserve rate hike, declining Treasury yields, and a depreciating dollar.
The most recent economist projections by Reuters show an anticipated increase in employment by 80,000 with July’s Unemployment rate remaining unchanged at 4.2%.
The upcoming breakout level of XAU/USD is $4280 with a subsequent target of $4303 and $4367. Support of XAU/USD is found at $4236 and $4195.

Arslan Ali Butt
Lead Markets Analyst – Multi-Asset (FX, Commodities, Crypto)
Arslan Ali Butt serves as the Lead Commodities and Indices Analyst, bringing a wealth of expertise to the field. With an MBA in Behavioral Finance and active progress towards a Ph.D., Arslan possesses a deep understanding of market dynamics.
His professional journey includes a significant role as a senior analyst at a leading brokerage firm, complementing his extensive experience as a market analyst and day trader. Adept in educating others, Arslan has a commendable track record as an instructor and public speaker.
His incisive analyses, particularly within the realms of cryptocurrency and forex markets, are showcased across esteemed financial publications such as ForexCrunch, InsideBitcoins, and EconomyWatch, solidifying his reputation in the financial community.
Domestic coffee prices today
Coffee prices today in the domestic market increased compared to the previous day. According to giacaphe. com, coffee prices on August 6th averaged 98,900 VND/kg, up 600 VND/kg. The highest price in key Central Highlands regions was recorded at 99,000 VND/kg.
In Lam Dong, coffee prices today reached 98,300 VND/kg, an increase of 700 VND/kg compared to the previous day. This is the lowest level in the regions.
In Gia Lai, coffee prices were recorded at 98,800 VND/kg, an increase of 500 VND/kg compared to the previous session.
The old Dak Nong area recorded a level of 99,000 VND/kg, an increase of 700 VND/kg. This is the highest level among the surveyed areas.
After two consecutive increasing sessions, domestic coffee prices have approached the 110,000 VND/kg mark. Compared to the August 4 session, the average level has increased by about 2,400 VND/kg.
World coffee prices
In the world market, coffee prices increased in the most recent session. According to data from Barchart, the September 2026 Arabica contract closed the session up 2.80 US cents/lb, equivalent to 0.86%, to 326.90 US cents/lb.
Robusta London futures for September 2026 also increased by 37 USD/ton, equivalent to 0.96%. With this increase, Robusta futures for September 2026 contracts increased to 3,891 USD/ton.
This development shows that world coffee prices are clearly supporting the domestic market more. Robusta increasing by nearly 1% is a noteworthy sign for purchasing prices in Vietnam, as this is the main coffee group of the domestic market.
Coffee price assessment
Domestic coffee prices continued to increase as both Robusta and Arabica in the world went up. The increase of 600 VND/kg brought the average price close to 99,000 VND/kg, narrowing the gap with the region of 100,000 VND/kg.
According to Barchart, coffee prices increased in the most recent session due to global weather factors and slower Brazil harvest progress than the same period.
For the Vietnamese market, Robusta London is still a variable that needs to be closely monitored. If the September futures contract remains above the 3,800 USD/ton range, domestic coffee prices will have more support in the short term.
Regarding domestic weather, the National Center for Hydro-Meteorological Forecasting said that on the day and night of August 6, the Central Highlands area will be cloudy, with showers and thunderstorms in some places; especially in the afternoon and evening, there will be scattered showers and thunderstorms, locally heavy rain. The lowest temperature is 20-23 degrees Celsius, the highest is 26-29 degrees Celsius, in some places above 29 degrees Celsius. Rain and thunderstorms this season need to be monitored at the stages of garden care, pest and disease prevention and goods preservation.
Coffee prices today continue to increase domestically and in the same direction as the world market. In the coming sessions, the developments of Robusta London, USD/VND exchange rate, inventory and demand for export purchases will continue to dominate the domestic price level.
Silver price (XAG/USD) remains stronger for the fourth consecutive day, trading around $62.20 per troy ounce during the Asian hours on Thursday. The price of the non-yielding Silver gains momentum as news of a deal to partially reopen the Strait of Hormuz pushed oil prices lower, significantly easing broader market concerns surrounding inflation and the outlook for interest rates.
The shift comes as Iran and Oman reached an agreement on a temporary shipping route through the strategic waterway, boosting global expectations for increased Middle Eastern energy flows. A joint statement from both nations is currently in its final drafting stages. While the proposed route is slated to operate for two to four months, Tehran made it clear that this arrangement does not represent a complete reopening of the strait.
According to TD Securities, the current structure of the oil market suggests that recent price moves are being driven more by positioning than by any material shift in underlying supply-demand dynamics. Strategists there highlight that “this time around, timespreads remain much stronger, which is the clearest signal that spec flows chasing headlines are doing the heavy lifting as opposed to any loosening of the fundamentals.” In their view, the resilience of timespreads reinforces the message from physical flows that the crude market remains fundamentally tight, even as headline risk and speculative activity exert outsized influence on day-to-day price action.
Meanwhile, economic data in the US added to the market dynamics. ADP figures released on Wednesday revealed that US private-sector employment grew by just 44,000 jobs in July, a sharp deceleration from the 98,000 added in June that fell well short of the 70,000-market consensus. With labor market cooling in focus, traders are now closely watching Thursday’s US Initial Jobless Claims and Friday’s Nonfarm Payrolls (NFP) report.
Fed’s Cook speech scores 7.2/10 on the FXS Speechtracker, modestly above the 6.5/10 historical average, signaling a slightly more forceful tone relative to the established baseline. The remarks balance recognition of a sturdy job market and resilient expansion with a clear emphasis that inflation threats surpass job market concerns, underscoring a firm commitment to restoring price stability while keeping rate hikes conditional on the disinflation trend failing to reappear. Overall, the message leans hawkish on inflation risks but stops short of pre-committing to imminent tightening, which is supportive for the Dollar and broadly cautious for risk-sensitive assets.
The FXS Fed Sentiment Index fell by 1.93 points to 140.92, indicating a modest pullback in perceived hawkishness following the speech. Despite the decline, the index remains well above the neutral 100 threshold, showing that Fed communication is still firmly in hawkish territory even as the immediate tightening impulse eases slightly according to the FXS Fed Sentiment Index and FXS Speechtracker.
XAG/USD trades around $62.20. is holding a near-term bullish bias as it advances above the nine-day Exponential Moving Average (EMA) at $59.76 while still trading below the 50-day EMA at $62.69, which caps the topside for now. The 14-day Relative Strength Index (RSI) at 56.81 leans constructive, suggesting firm positive momentum, while the FXS Fed Sentiment Index at 140.92 hints that broader macro sentiment remains supportive rather than euphoric.
On the topside, immediate resistance is defined by the 50-day EMA at $62.69; a clear daily close above this barrier would open the door toward the next structural hurdles at $90.03 and $96.62, though these latter levels remain distant in the current trading context. On the downside, initial support is seen at the nine-day EMA at $59.76, ahead of the horizontal floor at $55.63.
(The technical analysis of this story was written with the help of an AI tool. Know more.)
Silver flirted with $63 on Wednesday, its highest in over a month amid renewed market optimism. Investors welcomed news hinting at a soon-to-come deal between the United States (US) and Iran.
XAU/USD traded as high as $62.78 early in the American session, following headlines indicating that the US Treasury lifted counter-terrorism sanctions imposed on three airlines and two aircraft linked to the Islamic Revolutionary Guard Corps (IRGC) and three airlines.
A Treasury official clarified that the decision was not related to US negotiations with Iran over a possible deal to end hostilities in the Gulf, according to Reuters, yet market players dropped the Greenback on hopes that a deal is closer. The encouraging headline was reinforced by reports suggesting that a deal between Oman and Iran is done, pending Tehran’s approval.
The USD was also pressured by local data, as the ADP Employment Change survey showed that the US private sector added measly 44K in July, missing expectations of 70K and below the 98K recorded in June. Also, the ISM Services Purchasing Managers’ Index printed at 54.1 in July, slightly better than the previous 54, although below the 54.5 expected.
Broad USD weakness keeps precious metals near recent highs, with XAU/USD now hovering around the $62 level.
In the 4-hour chart, XAG/USD trades at $62.00, extending its recovery above the critical $61 mark, a former relevant low now an immediate relevant support. The pair holds well above the 20-period Simple Moving Average (SMA) at $59.32 and the longer-term 100- and 200-period SMAs at $58.15 and $58.99, respectively, which now underpin the uptrend. The Momentum indicator gains modest upward traction above its midline, while the Relative Strength Index (RSI) indicator consolidates around 74, far from signaling exhaustion but instead reflecting the latest advance.
In the daily chart, Silver retains a constructive near-term bias as it trades well above the 20-day SMA at $58.30, while the 100-day and 200-day SMAs at $69.22 and $71.06, respectively, remain well overhead, signaling that the broader trend is still capped despite the latest rebound. Momentum has improved, with the 14-day Relative Strength Index around 56 and the 14-day Momentum indicator turning firmly positive, which suggests buyers currently have the upper hand.
On the downside, immediate support is seen at the short-term 20-period SMA at $59.32, followed by the 200-period SMA at $58.99 and the 100-period SMA at $58.15, where any dip would likely attract fresh demand while these levels hold. On the topside, initial resistance is seen at the 100-day SMA near $69.22, followed by the 200-day SMA at $71.06, a cluster that is likely to act as a tougher supply zone if the rally extends. Once beyond it, however, the path towards $100 will be much clearer.
(The technical analysis of this story was written with the help of an AI tool. Know more.)