The main tag of Gold Price Articles.
You can use the search box below to find what you need.
[wd_asp id=1]
The main tag of Gold Price Articles.
You can use the search box below to find what you need.
[wd_asp id=1]
Gold price (XAU/USD) struggles to break above the key level of $3,400.00 during the European trading session on Thursday. The precious metal hesitates to extend upside even as Federal Reserve (Fed) officials have shown support for interest rate cuts in the remainder of the year.
On Wednesday, Minneapolis Fed President Neel Kashkari, San Francisco Fed President Mary Daly and Fed Governor Lisa Cook argued in favor of reducing interest rates amid growing labor market concerns. “The economy is slowing and the Fed needs to respond to the slowing economy,” Kashkari said in an interview with CNBC. Kashkari added, “It may still be relevant in the near term to begin adjusting the policy rate, and two rate cuts this year still seem appropriate.”
The CME FedWatch tool showed that traders have almost fully priced in a 25 basis points (bps) interest rate reduction in the September policy meeting.
Theoretically, lower interest rates by the Fed bode well for non-yielding assets, such as Gold.
Meanwhile, resurfacing United States (US) President Donald Trump’s tariff fears are expected to improve the demand for safe-haven assets, such as Gold. On Wednesday, Trump stated that he could impose a penalty on China in the form of tariffs for buying Oil from Russia. The same day, Trump increased import duties on India by 25% for buying Russian Oil.
Gold price trades close to the upper boundary of the Symmetrical Triangle formation around $3,400, which is plotted from April’s high near $3,500. The lower boundary of the yellow metal is placed from the May’s low of $3,120.85.
The precious metal holds slightly above the 20-day Exponential Moving Average (EMA), which trades near $3,350, suggesting that the near-term trend is on the upside.
The 14-day Relative Strength Index (RSI) wobbles inside the 40.00-60.00, which indicates indecisiveness among market participants.
Looking down, the Gold price would fall towards the round-level support of $3,200 and the May 15 low at $3,121, if it breaks below the May 29 low of $3,245
Alternatively, the Gold price will enter uncharted territory if it breaks above the psychological level of $3,500 decisively. Potential resistances would be $3,550 and $3,600.
Gold has played a key role in human’s history as it has been widely used as a store of value and medium of exchange. Currently, apart from its shine and usage for jewelry, the precious metal is widely seen as a safe-haven asset, meaning that it is considered a good investment during turbulent times. Gold is also widely seen as a hedge against inflation and against depreciating currencies as it doesn’t rely on any specific issuer or government.
Central banks are the biggest Gold holders. In their aim to support their currencies in turbulent times, central banks tend to diversify their reserves and buy Gold to improve the perceived strength of the economy and the currency. High Gold reserves can be a source of trust for a country’s solvency. Central banks added 1,136 tonnes of Gold worth around $70 billion to their reserves in 2022, according to data from the World Gold Council. This is the highest yearly purchase since records began. Central banks from emerging economies such as China, India and Turkey are quickly increasing their Gold reserves.
Gold has an inverse correlation with the US Dollar and US Treasuries, which are both major reserve and safe-haven assets. When the Dollar depreciates, Gold tends to rise, enabling investors and central banks to diversify their assets in turbulent times. Gold is also inversely correlated with risk assets. A rally in the stock market tends to weaken Gold price, while sell-offs in riskier markets tend to favor the precious metal.
The price can move due to a wide range of factors. Geopolitical instability or fears of a deep recession can quickly make Gold price escalate due to its safe-haven status. As a yield-less asset, Gold tends to rise with lower interest rates, while higher cost of money usually weighs down on the yellow metal. Still, most moves depend on how the US Dollar (USD) behaves as the asset is priced in dollars (XAU/USD). A strong Dollar tends to keep the price of Gold controlled, whereas a weaker Dollar is likely to push Gold prices up.
The EURJPY pair leaned clearly above the extra support at 170.45, activating with the main indicators, achieving some gains by its fluctuation above the intraday barrier at 171.90.
Noting that the stability of the trading above 171.90 level is important, to reinforce the chances for resuming the bullish attack, to expect the extension of the trading towards 172.65, then targeting the bullish channel’s resistance at 173.80, while the return below 171.90 will force it to form new bearish correctional trading before resuming the suggested targets.
The expected trading range for today is between 171.45 and 172.65
Trend forecast: Bullish
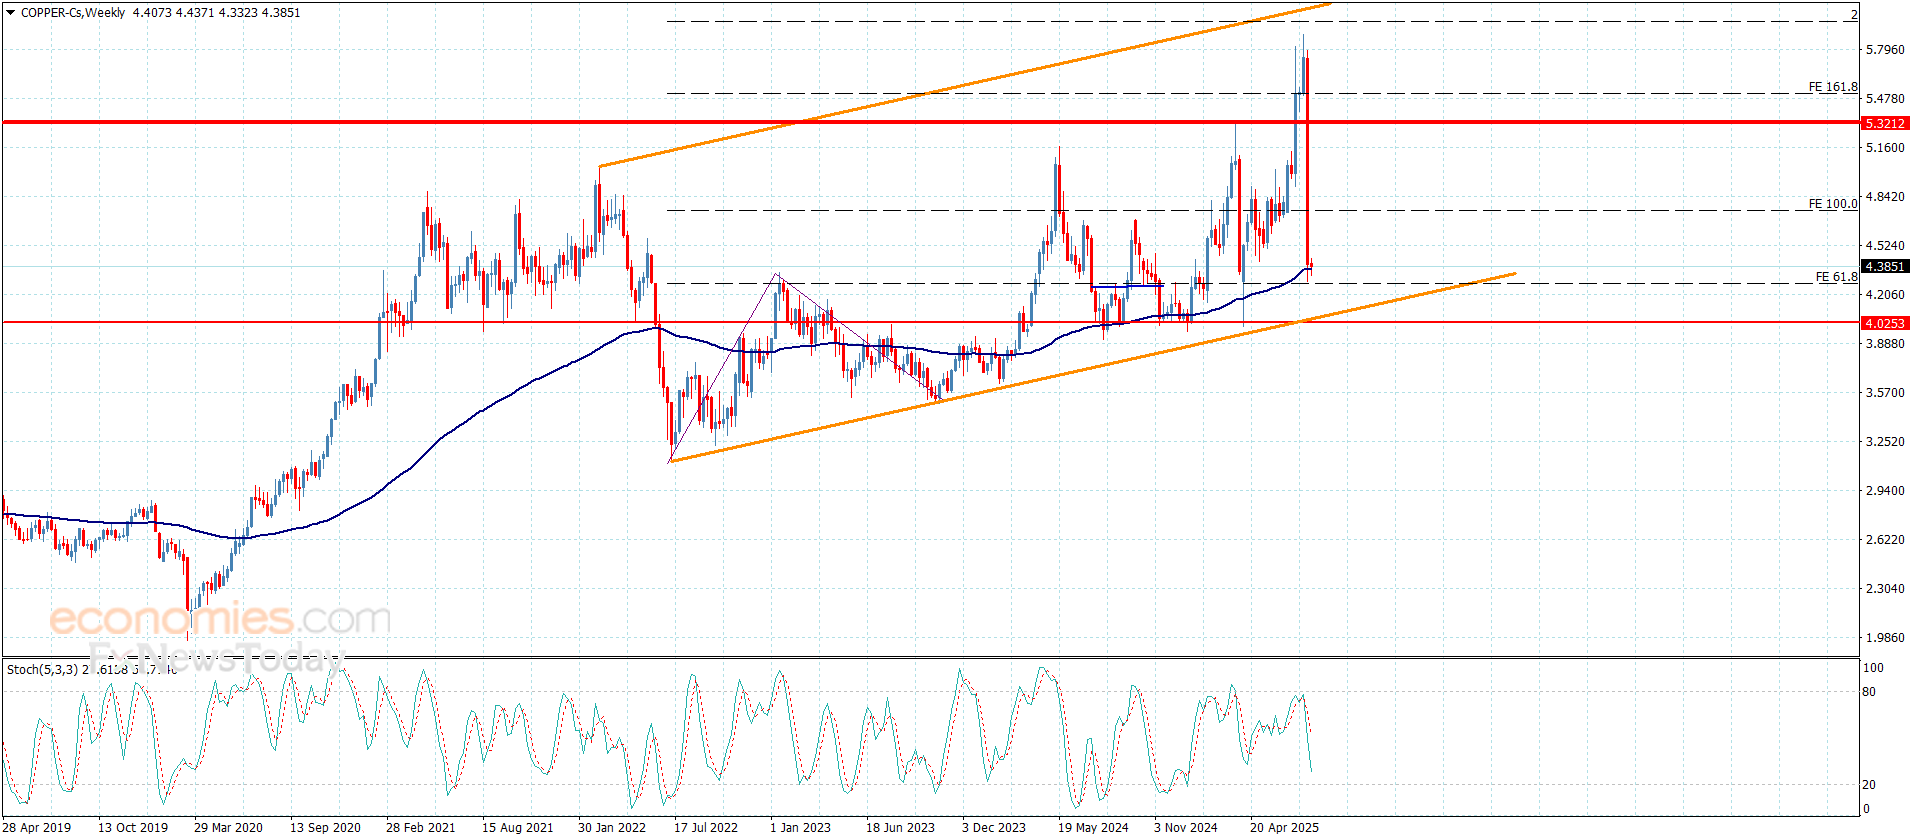
Copper price didn’t move any thing until this moment, announcing its surrender to the dominance of the sideways bias temporarily until ending the contradiction between the main indicators, reminding you that the bullish scenario will remain valid, depending on the stability of the bullish channel’s support at $4.0500, besides the continuation of forming extra support at $4.2600 level, reducing the chances for suffering any extra losses.
While the price success in gaining the positive momentum will provide chance to begin achieving some gains, to expect its rally to $4.6300 initially, attempting to step above 100%Fibonacci correction extension level at $4.7500, to open the way for recording more of the gains in the upcoming period trading.
The expected trading range for today is between $4.2600 and $4.6300
Trend forecast: Bullish
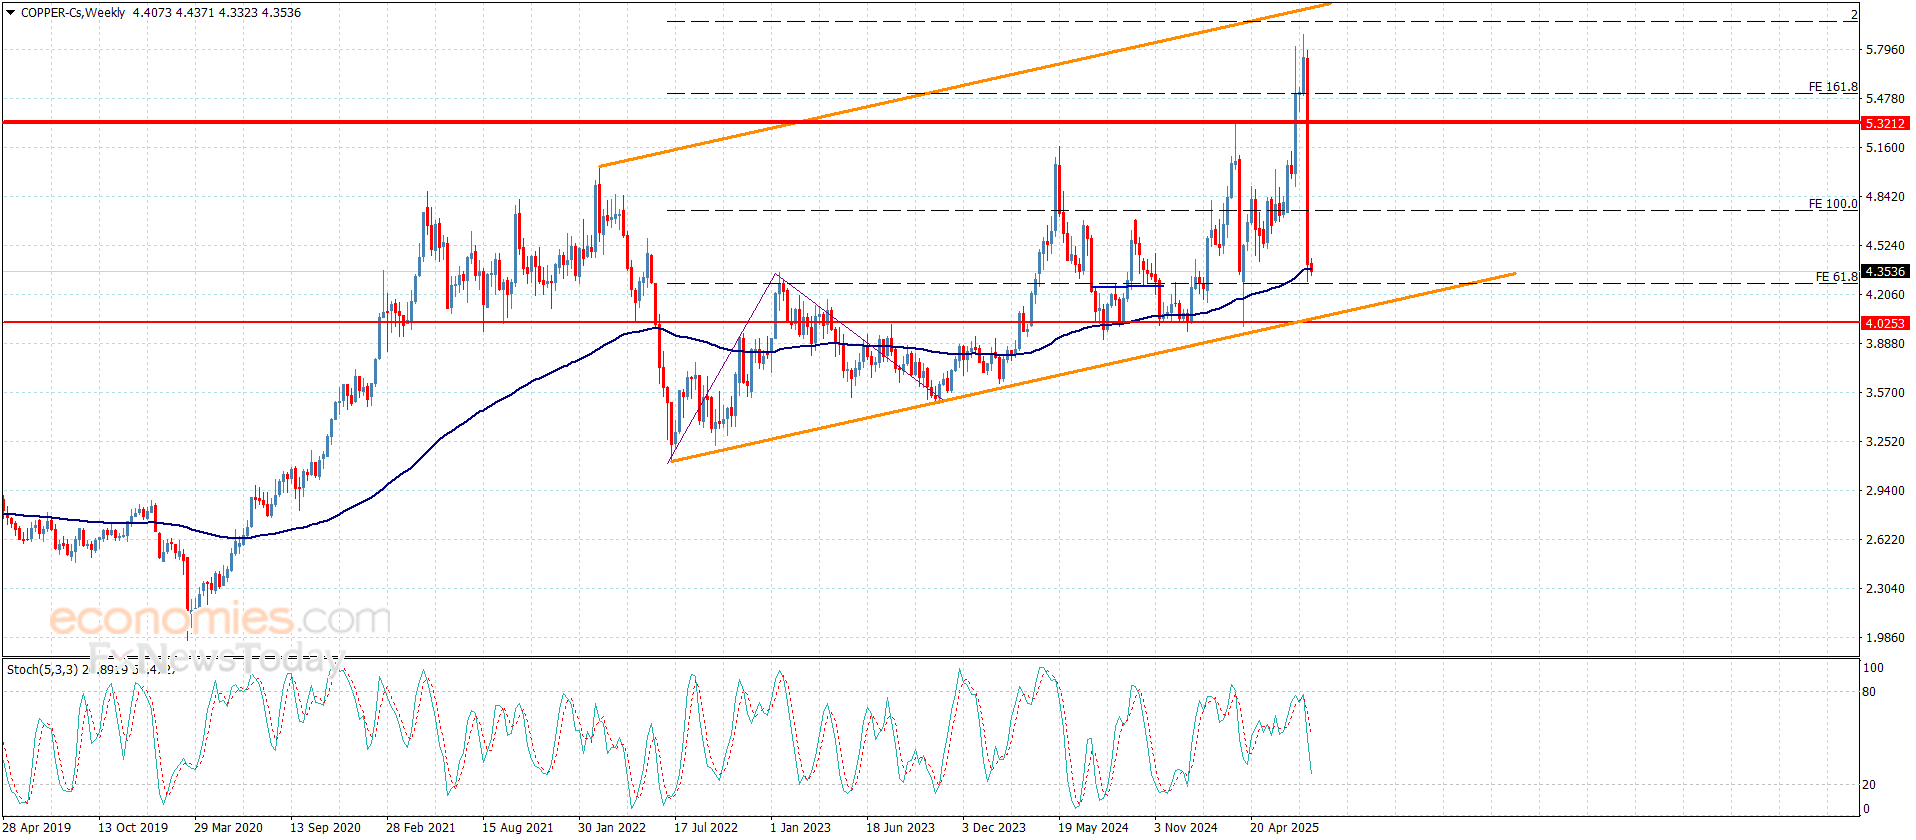
Copper price didn’t move any thing until this moment, announcing its surrender to the dominance of the sideways bias temporarily until ending the contradiction between the main indicators, reminding you that the bullish scenario will remain valid, depending on the stability of the bullish channel’s support at $4.0500, besides the continuation of forming extra support at $4.2600 level, reducing the chances for suffering any extra losses.
While the price success in gaining the positive momentum will provide chance to begin achieving some gains, to expect its rally to $4.6300 initially, attempting to step above 100%Fibonacci correction extension level at $4.7500, to open the way for recording more of the gains in the upcoming period trading.
The expected trading range for today is between $4.2600 and $4.6300
Trend forecast: Bullish
Silver Price advances during the North American session, up by 0.39% as the Greenback weakens more than 0.50%, as revealed by the US Dollar Index (DXY). At the time of writing, the XAG/USD trades at $37.88 after hitting a low of $37.31.
Sentiment improved due to earnings and Trump’s threat to impose 100% duties on chips. However, an exemption was made for companies producing items in the US, as Apple CEO and Trump announced a fresh $100 billion investment in the country.
From a technical perspective, the Silver price is neutral-biased, from a price action point of view, capped on the upside by the 20-day SMA at $38.04. However, sentiment turned slightly bullish, as seen by the Relative Strength Index (RSI), which cracked the index neutral line three days ago.
If XAG/USD ends daily above the 20-day SMA, look for a rally toward $39.00. Further resistance lies above, with the July 25 high of $39.19, followed by the YTD peak at $39.52.
Conversely, if XAG/USD finishes the session below $38.00, this could prompt sellers to drive the grey metal below he August 5 daily low of $37.31, sponsoring a slide towards $37.00. On further strength, the grey metal could reach the 50-day SMA at $36.73.
Silver is a precious metal highly traded among investors. It has been historically used as a store of value and a medium of exchange. Although less popular than Gold, traders may turn to Silver to diversify their investment portfolio, for its intrinsic value or as a potential hedge during high-inflation periods. Investors can buy physical Silver, in coins or in bars, or trade it through vehicles such as Exchange Traded Funds, which track its price on international markets.
Silver prices can move due to a wide range of factors. Geopolitical instability or fears of a deep recession can make Silver price escalate due to its safe-haven status, although to a lesser extent than Gold’s. As a yieldless asset, Silver tends to rise with lower interest rates. Its moves also depend on how the US Dollar (USD) behaves as the asset is priced in dollars (XAG/USD). A strong Dollar tends to keep the price of Silver at bay, whereas a weaker Dollar is likely to propel prices up. Other factors such as investment demand, mining supply – Silver is much more abundant than Gold – and recycling rates can also affect prices.
Silver is widely used in industry, particularly in sectors such as electronics or solar energy, as it has one of the highest electric conductivity of all metals – more than Copper and Gold. A surge in demand can increase prices, while a decline tends to lower them. Dynamics in the US, Chinese and Indian economies can also contribute to price swings: for the US and particularly China, their big industrial sectors use Silver in various processes; in India, consumers’ demand for the precious metal for jewellery also plays a key role in setting prices.
Silver prices tend to follow Gold’s moves. When Gold prices rise, Silver typically follows suit, as their status as safe-haven assets is similar. The Gold/Silver ratio, which shows the number of ounces of Silver needed to equal the value of one ounce of Gold, may help to determine the relative valuation between both metals. Some investors may consider a high ratio as an indicator that Silver is undervalued, or Gold is overvalued. On the contrary, a low ratio might suggest that Gold is undervalued relative to Silver.
Potential support is indicated around a long-term uptrend line and anchored volume weighted average price (AVWAP) line (light blue) begun from the 2024 trend low. The AVWAP line is now at $2.96, and it can be used like a moving average line. Notice that although natural gas dipped below the AVWAP briefly the past few days, it quickly recovered. There was only one daily close below that line, which was on Monday.
Given the long-term nature of the indicators marking support, a bottom may have been reached. Therefore, today’s upside breakout should be followed by additional signs of improving demand. If this scenario does not materialize and natural gas continues to test the support zone, a more substantial consolidation base may develop.
A sustained breakout above a recent interim swing high at $3.13 will provide the next sign of strength. But the more significant price level is around the lower swing high from July 29 at $3.19. That is also a weekly high. A sustained breakout above that level will trigger a bullish reversal as a lower swing high will be broken, and a weekly reversal will trigger as well. Today’s advance increases the chance that a higher swing low will be established but a rally above it will provide a stronger indication.
If the week ended today, a potentially weekly bull hammer would be established. That would provide another sign that the support zone may hold. Nonetheless, since there are only two more trading days to the week, the week may yet end with a bull hammer candlestick pattern. If it does, a breakout above the weekly high will provide a bullish reversal signal on the weekly chart starting next week.
For a look at all of today’s economic events, check out our economic calendar.
Gold price (XAU/USD) corrects to near $3,360.00 on Wednesday after a three-day winning streak. The precious metal retraces even as traders remain increasingly confident that the Federal Reserve (Fed) will resume its monetary-expansion cycle in the September policy meeting.
Lower interest rates by the Fed bode well for non-yielding assets, such as Gold.
Traders raised Fed dovish bets significantly as the United States (US) Nonfarm Payrolls (NFP) report for June has shown signs of a slowdown in the labor demand.
Meanwhile, US President Donald Trump has stated that he will announce Fed Governor Adriana Kugler’s replacement this week. Market experts believe that the entry of Trump’s candidate in the rate-setting committee will favor lower interest rates, given that Trump has criticized the Fed, especially Chairman Jerome Powel, a number of times for supporting a restrictive monetary policy stance.
Also, US President Trump has narrowed list of potential candidates as the successor of Jerome Powell. We’re also looking at the Fed chair, and that’s down to four people right now, Two Kevins and two other people,” Trump said in an interview with CNBC on Tuesday. His comments signal that White House economic adviser Kevin Hassett, former Fed Governor Kevin Warsh are potential candidates to step in place of Powell.
Gold price trades inside the Symmetrical Triangle formation, which indicates indecisiveness among market participants. The yellow metal oscillates around the 20-day Exponential Moving Average (EMA), which trades near $3,323, indicating a sideways trend.
The 14-day Relative Strength Index (RSI) wobbles inside the 40.00-60.00, suggesting a sharp volatility contraction.
Looking down, the Gold price would fall towards the round-level support of $3,200 and the May 15 low at $3,121, if it breaks below the May 29 low of $3,245
Alternatively, the Gold price will enter an uncharted territory if it breaks above the psychological level of $3,500 decisively. Potential resistances would be $3,550 and $3,600.
Gold has played a key role in human’s history as it has been widely used as a store of value and medium of exchange. Currently, apart from its shine and usage for jewelry, the precious metal is widely seen as a safe-haven asset, meaning that it is considered a good investment during turbulent times. Gold is also widely seen as a hedge against inflation and against depreciating currencies as it doesn’t rely on any specific issuer or government.
Central banks are the biggest Gold holders. In their aim to support their currencies in turbulent times, central banks tend to diversify their reserves and buy Gold to improve the perceived strength of the economy and the currency. High Gold reserves can be a source of trust for a country’s solvency. Central banks added 1,136 tonnes of Gold worth around $70 billion to their reserves in 2022, according to data from the World Gold Council. This is the highest yearly purchase since records began. Central banks from emerging economies such as China, India and Turkey are quickly increasing their Gold reserves.
Gold has an inverse correlation with the US Dollar and US Treasuries, which are both major reserve and safe-haven assets. When the Dollar depreciates, Gold tends to rise, enabling investors and central banks to diversify their assets in turbulent times. Gold is also inversely correlated with risk assets. A rally in the stock market tends to weaken Gold price, while sell-offs in riskier markets tend to favor the precious metal.
The price can move due to a wide range of factors. Geopolitical instability or fears of a deep recession can quickly make Gold price escalate due to its safe-haven status. As a yield-less asset, Gold tends to rise with lower interest rates, while higher cost of money usually weighs down on the yellow metal. Still, most moves depend on how the US Dollar (USD) behaves as the asset is priced in dollars (XAU/USD). A strong Dollar tends to keep the price of Gold controlled, whereas a weaker Dollar is likely to push Gold prices up.
The (Brent) price rose in its last intraday trading, due to the stability of the critical support level at $67.50, providing positive momentum that assisted it to achieve these gains, with the emergence of the positive signals on the (RSI), after reaching oversold levels.
This performance comes amid the price’s affection by breaking bullish trend line on the short-term basis, with the continuation of the negative pressure that comes from its trading below EMA50, forming dynamic resistance that prevents any recovery attempt on the near-term basis.
Get high-accuracy trading signals delivered directly to your Telegram. Subscribe to specialized packages tailored for the world’s top markets:
To view the full performance report for this week, visit the following link:
The (Brent) price rose in its last intraday trading, due to the stability of the critical support level at $67.50, providing positive momentum that assisted it to achieve these gains, with the emergence of the positive signals on the (RSI), after reaching oversold levels.
This performance comes amid the price’s affection by breaking bullish trend line on the short-term basis, with the continuation of the negative pressure that comes from its trading below EMA50, forming dynamic resistance that prevents any recovery attempt on the near-term basis.
Get high-accuracy trading signals delivered directly to your Telegram. Subscribe to specialized packages tailored for the world’s top markets:
To view the full performance report for this week, visit the following link:
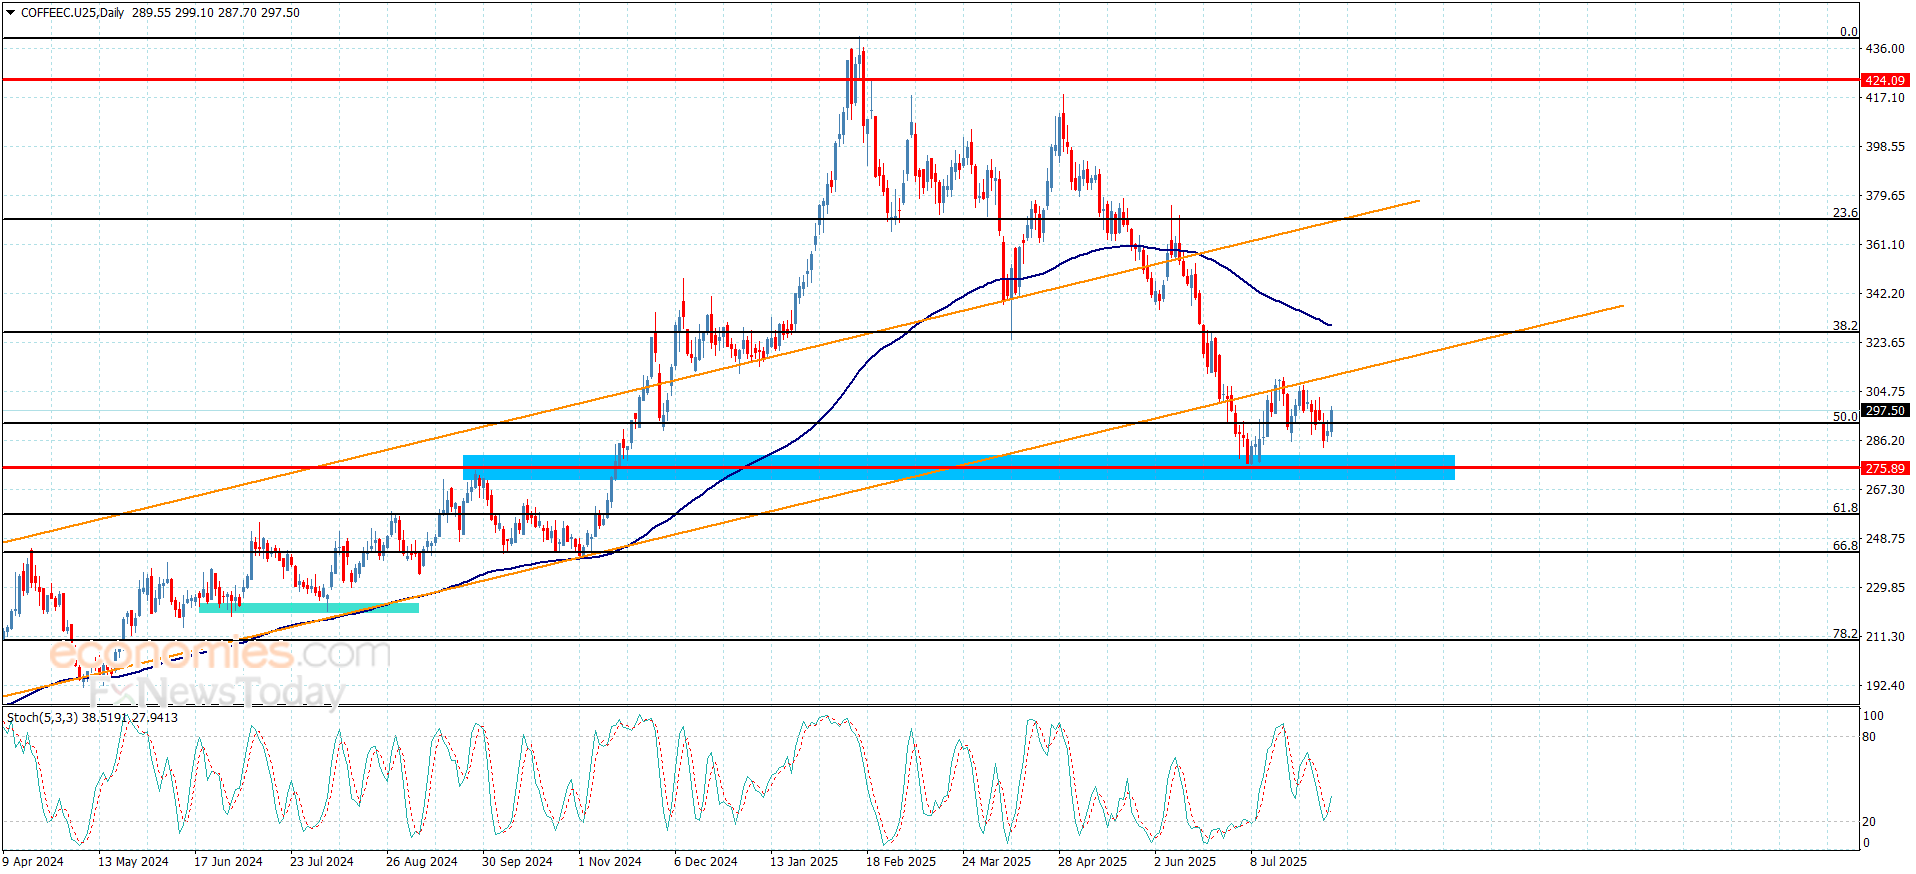
Despite the strong negative pressure on coffee prices due to its stability below the support of the broken minor channel’s support at 311.00 besides providing negative momentum by the main indicators, but its stability above the support base at 276.70 supports the chances for forming bullish waves, to fluctuate near 297.50.
Stochastic attempt to provide positive momentum that will increase the chances for targeting 311.00 level, surpassing it is important for regaining the bullish bias, then begin recording several gains by its rally to 328.00.
The expected trading range for today is between 284.00 and 311.00
Trend forecast: Bullish