The main tag of Gold Price Articles.
You can use the search box below to find what you need.
[wd_asp id=1]
The main tag of Gold Price Articles.
You can use the search box below to find what you need.
[wd_asp id=1]
Copper price continued to form bearish trading, to reach the target at $4.2600 forming an intraday support against the current trading, despite the main stability within the bullish channel’s levels, the attempt of providing negative momentum from the main indicators that might push the price to press on the current support, while breaking it will extend the losses to $4.1600 reaching the support of the bullish channel at $4.0550.
Reminding you that activating the bullish attack again requires forming several bullish waves, to settle above $4.7400 level, to ease the mission of recording several gains that might begin at $4.9800.
The expected trading range for today is between $4.1600 and $4.6200
Trend forecast: Bearish
This week’s drop confirmed a failure of a bull pennant pattern. Since it is a trend continuation pattern, a breakdown shows a weakening of the near-term uptrend and the potential for a correction greater than what was seen most recently. Gold is now below the 50-Day MA, with the 200-Day MA becoming a possibility. The 200-Day line is currently at $3,003.
The first pullback from the $3,500 record high reached in April was an approximate match with the 38.2% Fibonacci retracement and a successful test of support at the 50-Day MA. A falling ABCD pattern points to a possible minimum downside target of $3,072. That would exceed the 38.2% level at $3,139. Notice that the 50% retracement target is a little lower at $3,041. So, the $3,072 to $3,041 levels can be seen as a potential zone of support.
A sustained rally above $3,334 would be needed before there were signs of a potential failed breakdown. Moreover, moving averages are in the process of confirming bearish indications. Both the 20-Day and 50-Day MA have converged with the trendline at the bottom of the pennant and will be crossing below the line. They also show potentially strong resistance.
The weekly chart confirms the bearish potential for gold short-term as a bearish shooting star candlestick pattern triggered earlier in week and led to a four-week low of $3,268. A three-week lower close looks likely this week as the sellers remain in charge on a weekly basis. But on the weekly chart gold is at a potentially significant support level as the low for the week hit the 20-Week MA for the first time since it was reclaimed in January. This is one of the reasons to also consider a bullish scenario regardless of how clear the bearish side looks.
For a look at all of today’s economic events, check out our economic calendar.
A decisive rally above today’s high will trigger a one-day bullish reversal, confirmed by a daily close above it. But an advance above the recent lower swing high at $3.19 presents a more reliable level to indicate that demand is improving and may continue. An advance above $3.19 will trigger a bullish reversal of the short-term decline that began from the $3.63 swing high. If triggered, the 20-Day MA, now at $3.29 and falling, is the first upside target and it could easily be surpassed if demand continues to improve.
Subsequently, the area around the 200-Day MA, currently at $3.64, identifies the next upside target. Particularly, given that the 50-Day MA just converged with the 200-Day line and they identify a similar price level as possible resistance. An AVWAP line that began off the April swing low, also shows support around those two lines. Given the confluence of indicators, the price zone could potentially act like a magnet as price is drawn towards it. Nevertheless, it identifies a potentially significant pivot zone, as a decisive rally above it will signal a breakout and further confirm strength.
The establishment of support near the long-term trendline shows the possible completion of the bearish correction that began following the trend high of $4.90 in March. Notice that the volatility of the long-term uptrend has been contained within a large rising parallel trend channel (purple).
Resistance was successfully tested multiple times at the beginning of year, eventually leading to a sustained correction. Given the symmetrical nature of the channel, a bounce off one side points to the other side. Once the other side is reached, as happened today with a touch of the bottom of the channel, a move to the other side is possible.
For a look at all of today’s economic events, check out our economic calendar.
This ambiguity disappointed markets that had priced in a high probability of monetary easing in the third quarter. As expectations reset, the U.S. Dollar Index jumped over 0.5%, adding further headwinds to precious metals.
The ADP National Employment report showed private sector payrolls rose by 324,000 in July, far exceeding forecasts. While some indicators of labor softening linger, the data broadly suggests resilience in the job market.
This strength reinforces the Fed’s wait-and-see stance and weakens the investment case for non-yielding assets like gold.
“Powell is staying the course on inflation even as employment data shows mixed signals,” said Tai Wong, an independent metals trader. “Gold may retrace further, but long-term support remains intact due to macroeconomic uncertainty, rising U.S. debt levels, and de-dollarization trends.”
Silver plunged 3.2%, briefly touching a three-week low as traders digested the Fed’s tone and adjusted for reduced policy easing expectations. The metal, more volatile and industrially sensitive than gold, remains vulnerable to shifts in growth sentiment.
With real yields firming and the dollar gaining strength, both gold and silver face near-term headwinds. However, geopolitical uncertainties and fiscal imbalances continue to offer a supportive backdrop for long-term investors.
Important DisclaimersThe content provided on the website includes general news and publications, our personal analysis and opinions, and contents provided by third parties, which are intended for educational and research purposes only. It does not constitute, and should not be read as, any recommendation or advice to take any action whatsoever, including to make any investment or buy any product. When making any financial decision, you should perform your own due diligence checks, apply your own discretion and consult your competent advisors. The content of the website is not personally directed to you, and we does not take into account your financial situation or needs.The information contained in this website is not necessarily provided in real-time nor is it necessarily accurate. Prices provided herein may be provided by market makers and not by exchanges.Any trading or other financial decision you make shall be at your full responsibility, and you must not rely on any information provided through the website. FX Empire does not provide any warranty regarding any of the information contained in the website, and shall bear no responsibility for any trading losses you might incur as a result of using any information contained in the website.The website may include advertisements and other promotional contents, and FX Empire may receive compensation from third parties in connection with the content. FX Empire does not endorse any third party or recommends using any third party’s services, and does not assume responsibility for your use of any such third party’s website or services.FX Empire and its employees, officers, subsidiaries and associates, are not liable nor shall they be held liable for any loss or damage resulting from your use of the website or reliance on the information provided on this website.Risk DisclaimersThis website includes information about cryptocurrencies, contracts for difference (CFDs) and other financial instruments, and about brokers, exchanges and other entities trading in such instruments. Both cryptocurrencies and CFDs are complex instruments and come with a high risk of losing money. You should carefully consider whether you understand how these instruments work and whether you can afford to take the high risk of losing your money.FX Empire encourages you to perform your own research before making any investment decision, and to avoid investing in any financial instrument which you do not fully understand how it works and what are the risks involved.
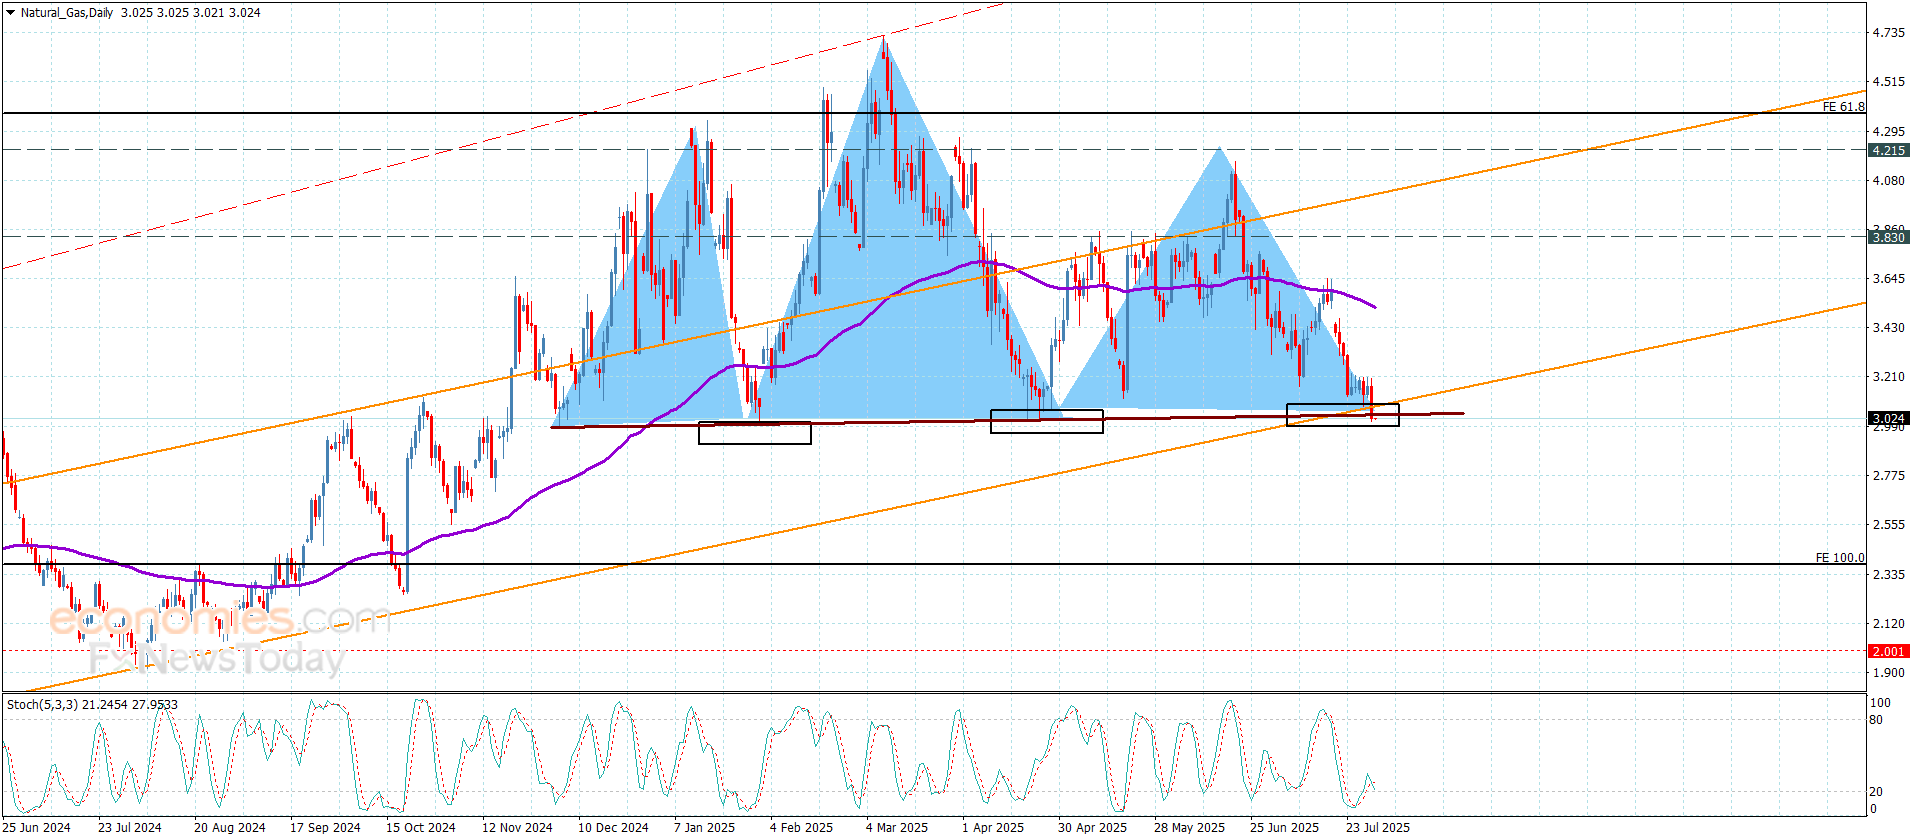
Natural gas price returned to form new negative trading affected by stochastic negativity, providing strong pressures on the critical support at $3.050, which represents the head and shoulders pattern.
Note that breaking the current support will confirm activating the negative pattern, to move to a new negative track, forcing it to suffer several losses by reaching $2.710 and $2.390, for regaining the bullish bias we recommend waiting for providing positive close above $3.320 to ease achieving several gains that might begin at $3.450 and $3.610.
The expected trading range for today is between $2.710 and $3.150.
Trend forecast: Bearish
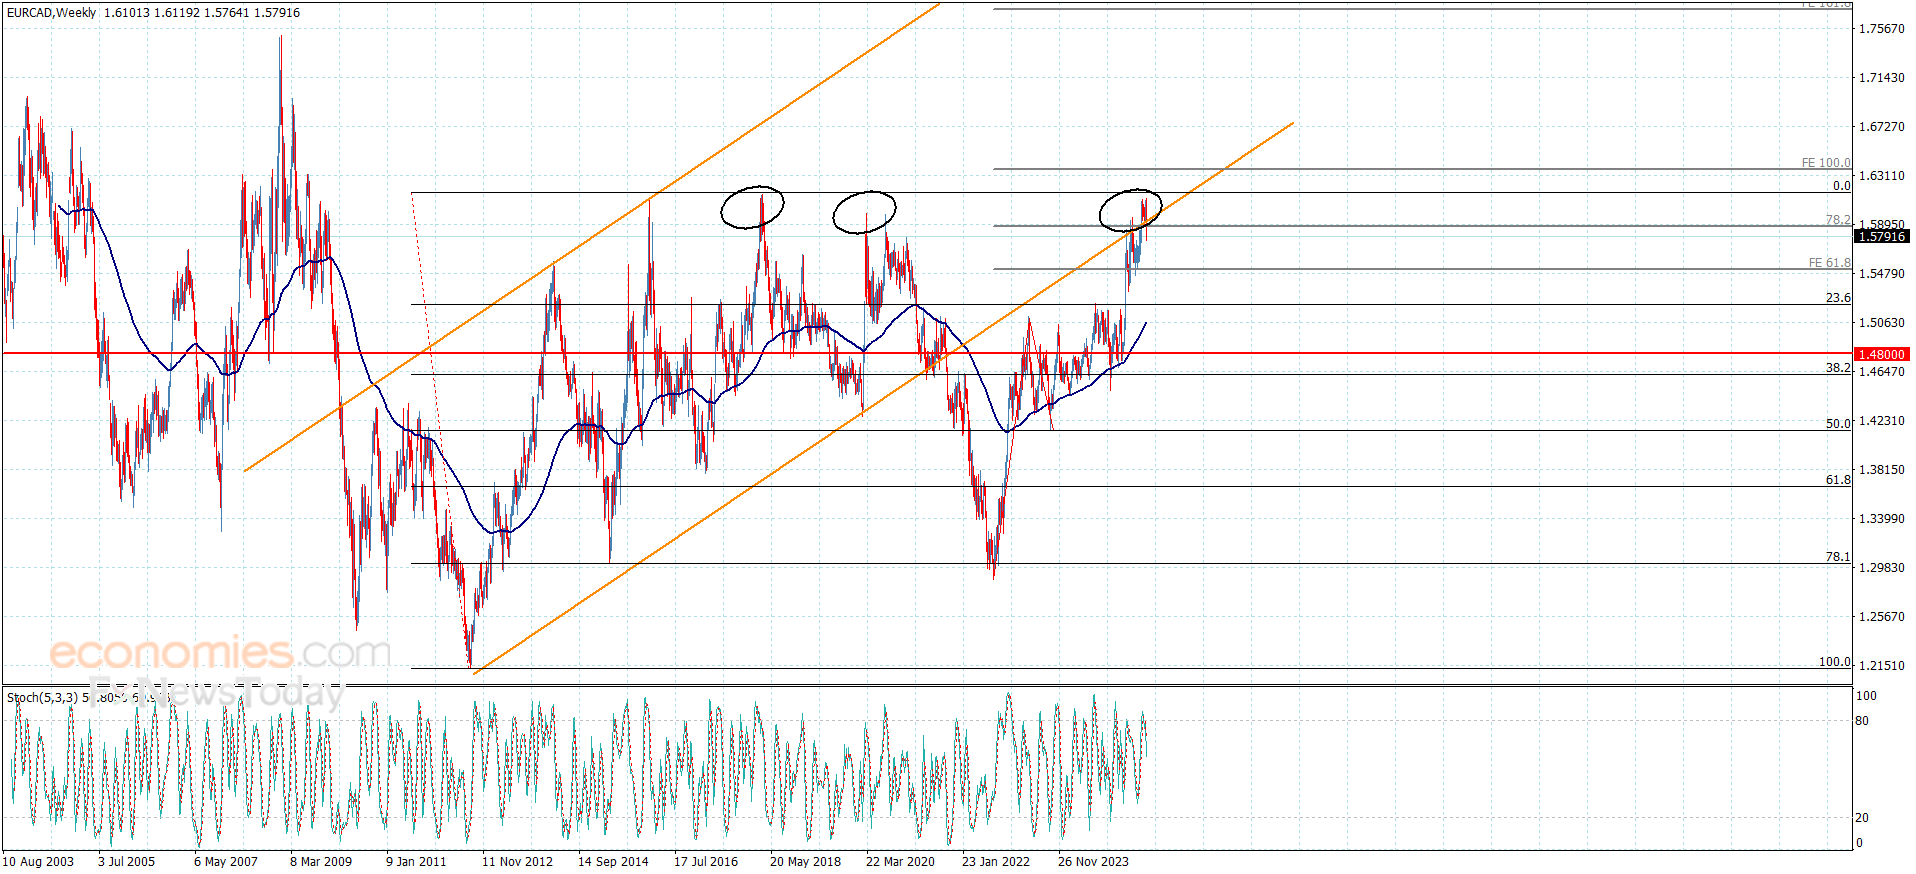
The EURCAD attempted to regain the bullish bias by its rally above the broken bullish channel’s support at 1.5945 level, achieving some of the gains by its rally to 1.1600, to face a strong rejection due to entering zones of high liquidity absorption, to rebound to the downside strongly towards 1.5775, confirming its exit from the bullish track again.
Forming a strong resistance at 1.5930 level against the current trading and providing negative momentum by stochastic, these factors make us prefer the bearish bias dominance, which might target 1.5660 level, reaching the extra support at 1.5530 level.
The expected trading range for today is between 1.5660 and 1.5860
Trend forecast: Bearish
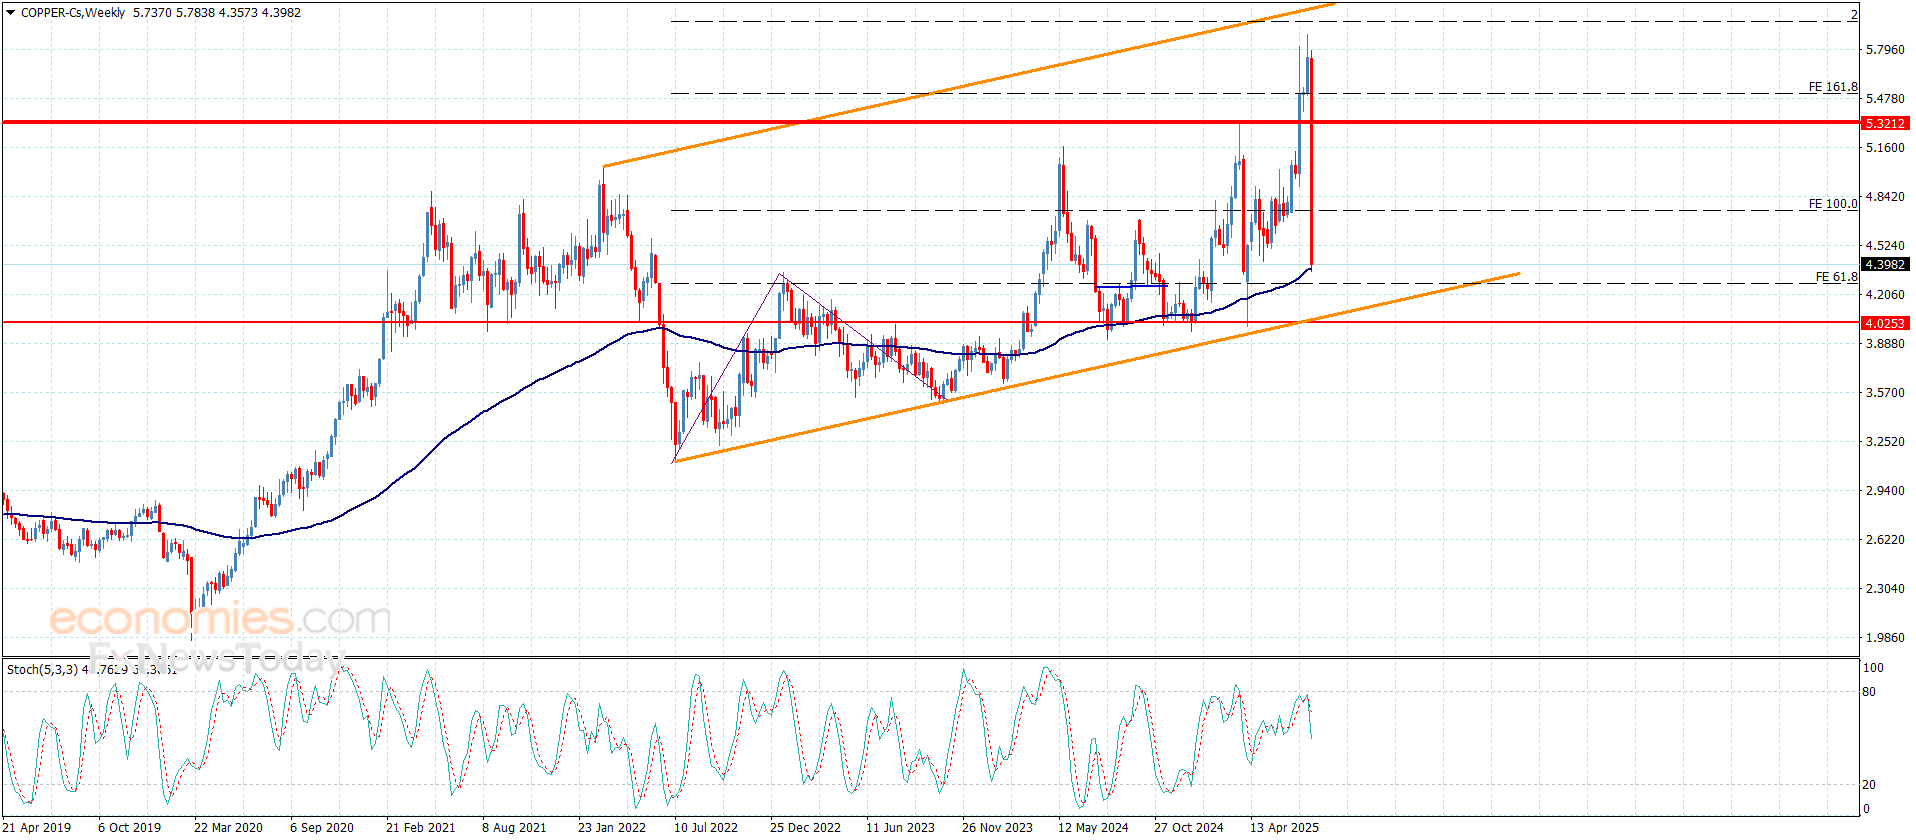
Copper price is under strong bearish pressure to push it to decline below the support at $5.3200, to lose most of its previous gains to reach $4.3900, to face the moving average of 55.
Despite the main stability within the main bullish channel’s levels, the contradiction between the main indicators may increase the chances for suffering extra losses by targeting 161%Fibonacci extension level at $4.2650, while renewing the bullish attempts requires stepping above $4.7400 level, providing chance for recording gains again.
The expected trading range for today is between $4.2600 and $4.5200
Trend forecast: Fluctuated within the bullish track
Copper price is under strong bearish pressure to push it to decline below the support at $5.3200, to lose most of its previous gains to reach $4.3900, to face the moving average of 55.
Despite the main stability within the main bullish channel’s levels, the contradiction between the main indicators may increase the chances for suffering extra losses by targeting 161%Fibonacci extension level at $4.2650, while renewing the bullish attempts requires stepping above $4.7400 level, providing chance for recording gains again.
The expected trading range for today is between $4.2600 and $4.5200
Trend forecast: Fluctuated within the bullish track
The decisive breakdown from a consolidation top puts the near-term bull trend in gold at risk of a deeper correction. Unless there is a relatively quick recovery it looks like gold is heading next towards the higher swing low of $3,247 from late-June. If that fails as support, the higher swing low at $3,121 becomes a potential target.
Since the initial pullback from the April record high of $3,500 completed a 38.2% Fibonacci retracement before another advance began, there is a good chance a deeper retracement may be completed in the current correction, given today’s bearish price action. A 50% retracement will be completed at $3,041 and a 61.8% Fibonacci retracement is at $2,933.
Given the clear failure of the 50-Day MA as support for today, the 200-Day MA, now at $3,000, becomes a potential downside target. Since it is rising it will eventually converge and surpass the 50% retracement area. There is also a falling ABCD pattern that has been added to the chart to help assess potential lower targets. It shows an initial downside target of $3,072, a little below the last retracement low (B) and near the 50% level. That is where the decline in price for the falling CD leg matches the decline in the first AB downswing. Once that happens, a potential pivot level is identified.
For a look at all of today’s economic events, check out our economic calendar.