The main tag of Gold Price Articles.
You can use the search box below to find what you need.
[wd_asp id=1]
The main tag of Gold Price Articles.
You can use the search box below to find what you need.
[wd_asp id=1]
Gold price hovers around $3,340, recovering from a fresh weekly low of $3,309.96. The FX board is all about United States (US) headlines and sentiment. The US Dollar (USD) traded with a firmer tone throughout the day, partially backed by comments from US President Donald Trump, hinting at trade deals with India and the Eurozone, and partially supported by upbeat macroeconomic figures.
Retail Sales in the US surged my more than anticipated in June, up 0.6% after falling by 0.9% in May and much better than the 0.1% advance anticipated. Additionally, Initial Jobless Claims in the week ended July 12 rose by 221K, beating the 235K expected. Finally, the Philadelphia Fed Manufacturing Survey improved to 15.9 in July from the -4 posted in June, much better than the -1 anticipated by market’s analysts.
The upbeat figures boosted Wall Street, with the three major indexes rallying, limiting USD demand in the second half of the day. At the same time, the XAU/USD pair got to bounce from the aforementioned low, amid speculative interest betting on higher highs ahead for the bright metal.
Meanwhile, speculative interest has set aside concerns about the Federal Reserve (Fed) autonomy, after US President Donald Trump poured could water on speculation he may replace Fed’s Chair, Jerome Powell, before the end of his term in May 2026.
Friday will bring the preliminary estimate of the July Michigan Consumer Sentiment Index, expected to have improved to 61.5 from the 60.7 posted in June.
The quick bounce in Gold despite the better mood suggests buyers are still willing to add on dip. The daily chart for the XAU/USD pair temporarily fell below the 38.2% retracement of the $3,452.51 – $3,247.83 decline at around $3,325, while sellers contained advances around the 50% retracement of the same decline at around $3,350. The same chart shows that the pair is currently a handful of bucks above a flat 20 Simple Moving Average (SMA), while the 100 and 200 SMAs extended their advances far below the current level. Technical indicators, in the meantime, diverge within neutral levels, failing to provide clear directional clues.
The near term picture shows the bullish potential is limited, as the pair would need to run past the next Fibonacci resistance, the 61.8% retracement at $3,374.56, to turn positive. The 4-hour chart shows a mildly bearish 20 SMA extends its slide below a flat 200 SMA, while technical indicators recovered from their early lows near oversold readings, but remain within negative levels.
Support levels: 3,325.00 3,311.70 3,295.50
Resistance levels: 3,350.18 3,374.56 3,390.10
Despite the neediness of the EURJPY pair to positive momentum since yesterday, its positive stability above 171.75 confirms the stability of the bullish track, to increase the chances of reaching the initial main target at 173.40 and surpassing it will reinforce the chances for recording extra gains that might extend towards 173.85 and 174.40.
Notet that the price decline below 171.75 and providing bearish closes will increase the chances for activating the attempts of gathering the gains by forming bearish correctional waves, to expect targeting 171.10 level, reaching the support near 170.45.
The expected trading range for today is between 172.00 and 173.80
Trend forecast: Bullish
Gold (XAU/USD) is trading lower on Thursday, weighed by a stronger US Dollar, with risk appetite subdued amid ongoing uncertainty about global trade and rumours about the resignation of the Fed Chair Jerome Powell.
The precious metal retreats from Monday’s highs at $3,375, but price action remains contained within previous ranges. Later today, the release of the US June Retail Sales data and weekly Jobless Claims might give further clues about the impact of Trump’s tariffs on consumption and employment, and give more guidance for the pair.
The XAU/USD technical picture remains messy. The daily chart shows a lack of clear bias, with the RSI wavering back and forth around the 50 level, and price action halfway through the last few months’ trading range.
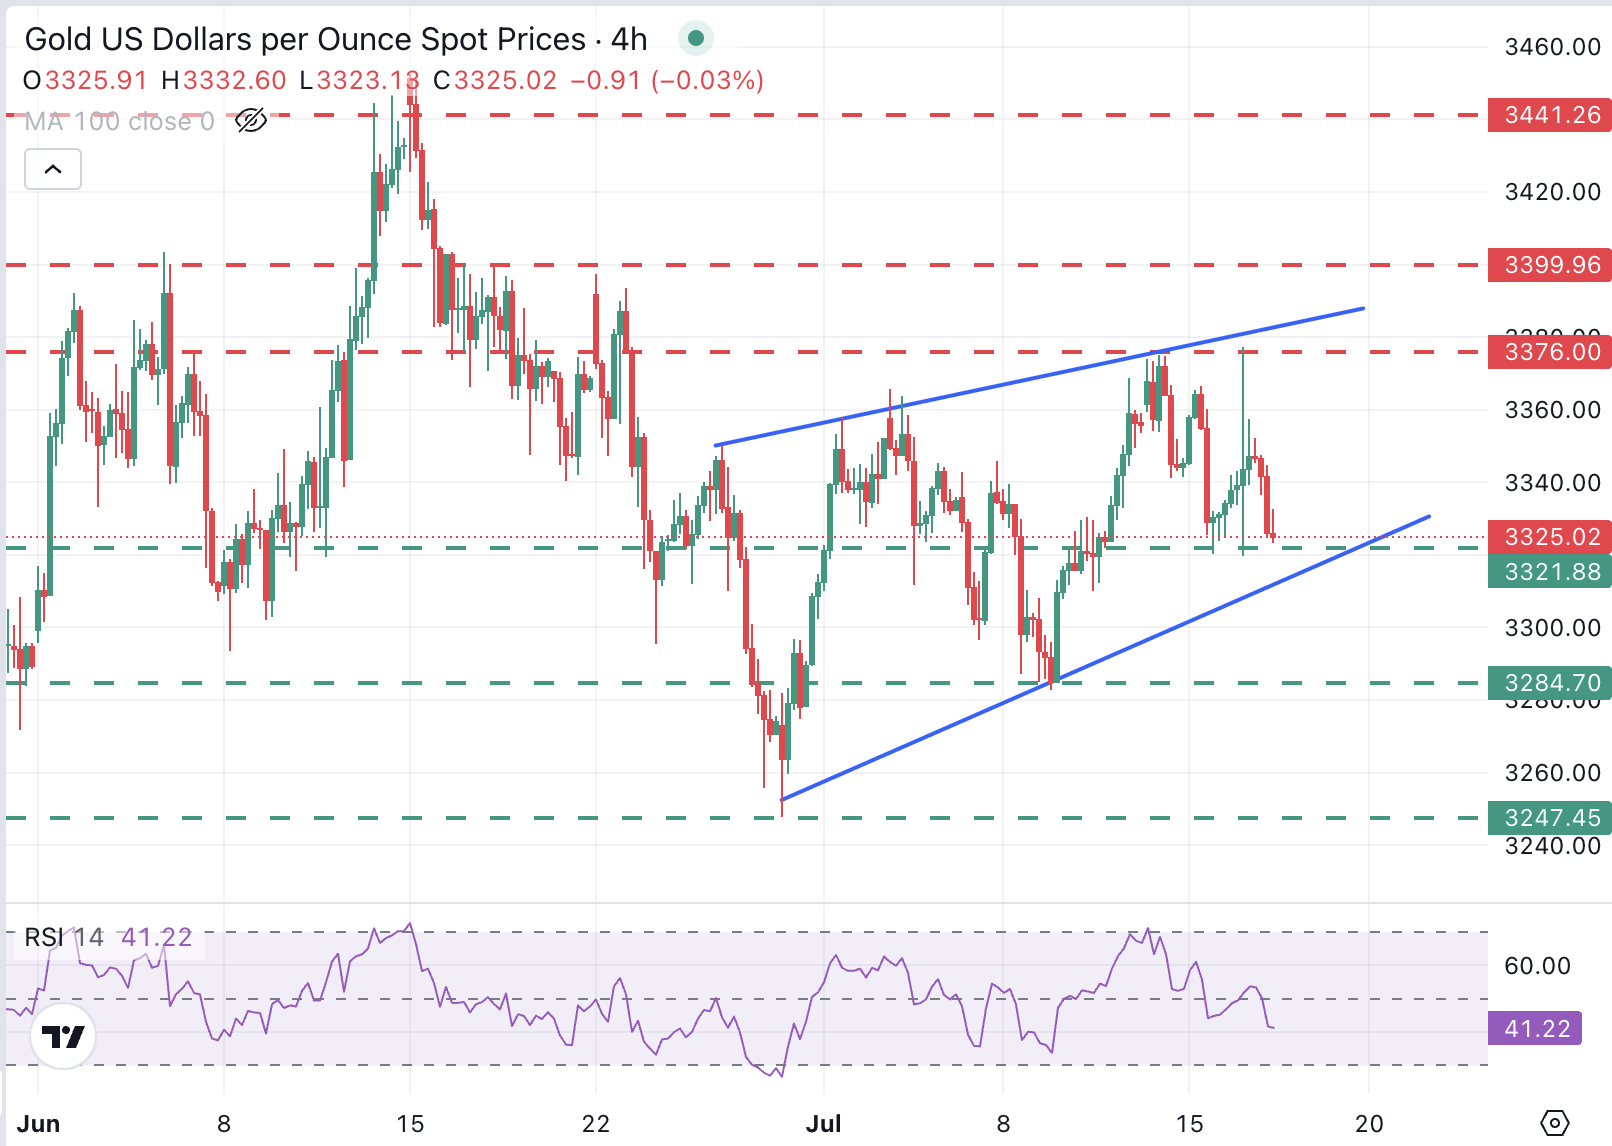
A look at the 4-hour chart, however, reveals increasing downside pressure, although the pair remains above the support area at $3,310-$3,320, which contains the neckline of a double top at $3,375 and the bottom of the ascending wedge. A confirmation below here would increase pressure towards the July 9 low at $3,285 ahead of the June 29 low, at $3,245
On the flip side, a rebound from current levels would find resistance at the mentioned $3,375 July 14, 16 highs, and the wedge top, at 3,380, ahead of the June 18 and 23 highs, at the $3,400 area.
Gold has played a key role in human’s history as it has been widely used as a store of value and medium of exchange. Currently, apart from its shine and usage for jewelry, the precious metal is widely seen as a safe-haven asset, meaning that it is considered a good investment during turbulent times. Gold is also widely seen as a hedge against inflation and against depreciating currencies as it doesn’t rely on any specific issuer or government.
Central banks are the biggest Gold holders. In their aim to support their currencies in turbulent times, central banks tend to diversify their reserves and buy Gold to improve the perceived strength of the economy and the currency. High Gold reserves can be a source of trust for a country’s solvency. Central banks added 1,136 tonnes of Gold worth around $70 billion to their reserves in 2022, according to data from the World Gold Council. This is the highest yearly purchase since records began. Central banks from emerging economies such as China, India and Turkey are quickly increasing their Gold reserves.
Gold has an inverse correlation with the US Dollar and US Treasuries, which are both major reserve and safe-haven assets. When the Dollar depreciates, Gold tends to rise, enabling investors and central banks to diversify their assets in turbulent times. Gold is also inversely correlated with risk assets. A rally in the stock market tends to weaken Gold price, while sell-offs in riskier markets tend to favor the precious metal.
The price can move due to a wide range of factors. Geopolitical instability or fears of a deep recession can quickly make Gold price escalate due to its safe-haven status. As a yield-less asset, Gold tends to rise with lower interest rates, while higher cost of money usually weighs down on the yellow metal. Still, most moves depend on how the US Dollar (USD) behaves as the asset is priced in dollars (XAU/USD). A strong Dollar tends to keep the price of Gold controlled, whereas a weaker Dollar is likely to push Gold prices up.
Disclaimer: For information purposes only. Past performance is not indicative of future results.
The GBPJPY pair lost the positive momentum by stochastic fluctuation near 50 level, which forces it to delay the bullish rally and forming intraday bearish wave, to test the extra support near 197.90 then begin this morning trading with a new positive action, due to its fluctuation near the barrier at 198.80.
We recommend waiting for confirming breaching the current obstacle to confirm its readiness to renew the bullish attempts, which might target 200.35 level, while the failure to breach might help renewing the bearish correctional attempts, forcing it to suffer some losses by reaching 197.45, then attempting to press on the bullish channel’s support at 197.15.
The expected trading range for today is between 198.00 and 200.35
Trend forecast: Bullish
No news for copper price, it remains confined between $5.3200 support and $5.5100 level which represents an extra barrier against the bullish attempts, and the contradiction between the main indicators confirming delaying the bullish attempts, to recommend neutrality and wait for surpassing these levels to detect the expected targets in the near trading.
Trading success in surpassing the barrier and holding above it will reinforce the dominance of the bullish bias, which might target $5.6700, while breaking the support will force it to form bearish correctional waves, to expect reaching $5.1500 and $4.9800.
The expected trading range for today is between $5.3100 and $5.5100
Trend forecast: Neutral
Spot Gold spent the first half of the day under pressure, bottoming at $3,319.75 early in the American session. The US Dollar (USD) remained strong amid a risk-averse environment, directly linked to stubbornly high United States (US) inflation and US President Donald Trump’s attacks on Federal Reserve Chairman Jerome Powell.
The US Dollar suffered a major set back across the FX board and the XAU/USD pair jumped to $3,377.32 following headlines indicating Trump is analyzing firing Powell.
CBS reported that Trump asked a group of House Republicans whether he should fire the Fed’s Chair in a meeting that took place in the Oval Office on Tuesday night. Additionally, The New York Times reported that Trump had already drafted a letter to fire the Fed Chair.
Just a few minutes afterwards, Reuters reported that Trump said he is not planning on doing anything, and that any change will be in the next eight months. It is worth remembering that Powell’s term ends in May 2026. The XAU/USD pair retreated towards the current $3,350 region. Stocks plummeted with the initial headlines but trimmed all the news-inspired losses, while the USD remains in the red.
Meanwhile, the US June Producer Price Index (PPI) data was better than anticipated. The index rose 2.3% on an annual basis in June, easing from the 2.6% previous and below the 2.5% anticipated by market players. The core annual reading printed at 2.6%, down from the 3% posted in May and below the 2.7% expected.
The XAU/USD pair keep trading between Fibonacci levels, recovering from around the 38.2% retracement of the $3,452.51 – $3,247.83 slump while topping around the 61.8% retracement of the same decline at $3,374.56. At the same time, the daily chart shows XAU/USD is currently above a mildly bearish 20 Simple Moving Average (SMA), while the 100 and 200 SMAs head firmly north, far below the current level. Technical indicators, in the meantime, keep seesawing around their midlines, lacking clear directional strength.
In the near term, and according to the 4-hour chart, the pair is currently trading above all its moving averages, which, anyway, remain flat. At the same time, technical indicators aim marginally higher at around their midlines, yet lack momentum enough to confirm additional gains ahead.
Support levels: 3.325.00 3,311.70 3,295.50
Resistance levels: 3,350.18 3,374.56 3,390.10
West Texas Intermediate (WTI) Crude Oil is staging a mild rebound on Tuesday, as traders continue to monitor supply and demand dynamics.
WTI Crude Oil is trading near $65.00, with intraday gains nearing 1% at the time of writing.
As the US Oil benchmark continues to trade within a well-defined range between $64.00 and $65.00, focus turns to the upcoming American Petroleum Institute (API) report.
The API will release its weekly Statistical Bulletin (WBS), providing insight into US crude oil stockpiles. According to FXStreet data, Tuesday’s report is expected to show Oil stockpiles declining by 2.26 M barrels, after a 4.277 M barrel drawdown last week.
Over the past five weeks, the report has revealed that Crude Oil stockpiles have continued to decline, reflecting rising demand. However, the Israel-Iran conflict, which ignited fears over potential disruptions to the Strait of Hormuz, had been a major contributor to depleting stockpiles.
With easing tensions in the Middle East, the Organization of the Petroleum Exporting Countries and its allies (OPEC+) continue to increase supply, limiting the upside move.
However, even with OPEC+ gradually adding supply, sentiment appears to be stabilizing after last week’s steep 12% slide.
If Tuesday’s data points to a deeper-than-forecast draw, it could signal stronger domestic consumption and offer short-term support as the third quarter begins.
With WTI currently testing the $65.00 psychological level, the 100-day Simple Moving Average (SMA) is providing resistance near $65.31. A move above this level could see the price retest the next round number of $66.00, opening the door for the 50% Fibonacci level of the January-April decline at $67.00.
The Relative Strength Index (RSI) is pointing higher, but remains slightly bearish near 47.
WTI (US Crude) Oil daily chart
If prices fail to hold above $65.00, prices could fall to the 38.2% Fibo level, providing support at $64.18. The June low at $63.73 lies below, a break of which brings the 50-day SMA into play at $63.41.
API’s Weekly Statistical Bulletin (WSB) has reported total U.S. and regional data relating to refinery operations and the production of the four major petroleum products: motor gasoline, kerosene jet fuel, distillate (by sulfur content), and residual fuel oil. These products represent more than 85% of total petroleum industry.
WTI Oil is a type of Crude Oil sold on international markets. The WTI stands for West Texas Intermediate, one of three major types including Brent and Dubai Crude. WTI is also referred to as “light” and “sweet” because of its relatively low gravity and sulfur content respectively. It is considered a high quality Oil that is easily refined. It is sourced in the United States and distributed via the Cushing hub, which is considered “The Pipeline Crossroads of the World”. It is a benchmark for the Oil market and WTI price is frequently quoted in the media.
Like all assets, supply and demand are the key drivers of WTI Oil price. As such, global growth can be a driver of increased demand and vice versa for weak global growth. Political instability, wars, and sanctions can disrupt supply and impact prices. The decisions of OPEC, a group of major Oil-producing countries, is another key driver of price. The value of the US Dollar influences the price of WTI Crude Oil, since Oil is predominantly traded in US Dollars, thus a weaker US Dollar can make Oil more affordable and vice versa.
The weekly Oil inventory reports published by the American Petroleum Institute (API) and the Energy Information Agency (EIA) impact the price of WTI Oil. Changes in inventories reflect fluctuating supply and demand. If the data shows a drop in inventories it can indicate increased demand, pushing up Oil price. Higher inventories can reflect increased supply, pushing down prices. API’s report is published every Tuesday and EIA’s the day after. Their results are usually similar, falling within 1% of each other 75% of the time. The EIA data is considered more reliable, since it is a government agency.
OPEC (Organization of the Petroleum Exporting Countries) is a group of 12 Oil-producing nations who collectively decide production quotas for member countries at twice-yearly meetings. Their decisions often impact WTI Oil prices. When OPEC decides to lower quotas, it can tighten supply, pushing up Oil prices. When OPEC increases production, it has the opposite effect. OPEC+ refers to an expanded group that includes ten extra non-OPEC members, the most notable of which is Russia.
The bulls remain in charge at the time of this writing, with trading continuing in the upper half of the day’s trading range. A daily close above yesterday’s high of $3.54 to a new trend high and the 20-Day line, while a daily close above $3.57 confirms the swing breakout. Nevertheless, this is bullish behavior, and it establishes additional confirmation that the bearish correction is most likely complete.
If the price of natural gas keeps rising before a pullback, it heads towards the next pivot zone from the lower swing high at $3.75. A breakout above that level will trigger another bullish reversal signal. It is interesting to note that the convergence of the 20-Day MA, the 50-Day MA, and an AVWAP line from the April low, converged as price broke through. In addition, the prior uptrend line (dashed) was also part of the resistance zone. This makes today’s breakout potentially significant, and it increases the chance for a relatively shallow pullback, when it does occur.
Since the $3.53 price zone remains nearby, the 200-Day MA, now at $3.44, is a key potential support area. If natural gas continues to trade above the line, a bullish posture remains. In addition, a weekly bull breakout occurred this week, and it looks likely that the week will end above last week’s high of $3.47. That would confirm the breakout on a weekly basis.
A key potential resistance zone shows from around the interim swing high at $3.75 to a prior swing high of $3.84 from May. The 61.8% Fibonacci retracement is within that range at $3.77. Given the likelihood that a bottom is complete, the supply and demand dynamics in a pullback should provide clues. In the short-term, the next potential resistance zone above today’s high is around the 50% retracement at $3.65.
For a look at all of today’s economic events, check out our economic calendar.
Silver (XAG/USD) is holding firm near the $38.00 level on Wednesday, drawing support after US Producer Price Index (PPI) data for June came in softer than expected. At the time of writing, the metal is trading around $37.90 per ounce.
Silver showed little reaction after the release of the latest US PPI data, which came in softer than expected. Headline PPI was flat in June, showing no monthly growth, compared to the 0.2% increase markets had expected, and down from a 0.3% rise in May. On an annual basis, PPI slowed to 2.3%, also below the 2.5% forecast and the 2.6% reading from the previous month.
Core PPI, which excludes food and energy, was also weaker than expected. It came in at 0.0% MoM, missing the 0.2% forecast and down from 0.1% in May. On a yearly basis, Core PPI eased to 2.6%, compared to 2.7% expected and 3.0% in the previous month.
This follows Tuesday’s US Consumer Price Index (CPI) data, which showed headline inflation in line with expectations, but core inflation came in slightly softer. The mix of inflation data has reduced the urgency for rate cuts, keeping the US Dollar under modest pressure while non-yielding assets, such as silver, remain supported.
The metal touched a fresh 14-year high of $39.13 on Monday before retreating slightly as investors booked profits. However, the broader technical setup remains bullish, with buyers still in control amid lingering safe-haven demand and cautious risk sentiment.
On the daily chart, Silver (XAG/USD) is trading just above the midline of a rising parallel channel that has guided price action since early April. The recent move higher followed a breakout from a multi-week consolidation range between $35.50 and $37.00, which had kept the metal in check through much of June and early July.
The breakout was confirmed by a strong bullish daily candle, propelling Silver toward the channel’s upper boundary near $39.00. Following a modest round of profit-taking, the metal has stabilized near the midpoint of the channel, which now serves as dynamic support, suggesting that the uptrend remains intact and well-supported.
The 21-day Exponential Moving Average (EMA) at $36.82 continues to offer key dynamic support and has been consistently respected throughout the current uptrend, reinforcing the underlying bullish structure.
Immediate resistance is seen at the 14-year high of $39.13. A decisive daily close above this level would confirm the next leg of the uptrend and open the door toward the psychological $40.00 mark. If bulls manage to sustain momentum above $40.00, the upper boundary of the rising channel around $40.50 could act as the next upside target.
On the downside, initial support is located at $37.50, which marks the upper boundary of the previous consolidation zone. A break below this level would put focus back on the 21-day EMA at $36.82. Deeper losses may target stronger support near $36.00, aligning with the lower edge of the rising channel.
Momentum indicators continue to favor the bullish scenario. The Relative Strength Index (RSI) has eased slightly from overbought conditions, and now stands near 63.50. This pullback in the RSI indicates a healthy consolidation phase rather than a trend reversal.
At the same time, the Moving Average Convergence Divergence (MACD) remains firmly in positive territory with a steady histogram and no signs of bearish divergence, signaling that upward momentum remains intact.
Nonetheless, the bulls remain in charge but within a pennant consolidation pattern. This week’s minor pullback reached a low of $3,320, which was a successful test of support around the 50-Day MA and a short downtrend line. Today was the second day in a row that support was retained. Whether there is a slightly deeper pullback before a new rally attempt remains to be seen.
But an overall bullish outlook would not start to change until there was a decline below an interim swing low at $2,283. And the lower boundary line for a bullish pennant pattern may be significant as a drop below it gives a bearish signal and the possibility of a failure of the bull pennant.
Volatility in gold will likely remain muted until there is a breakout of the pennant consolidation range. Look at the monthly chart (not shown) for a clearer view of the contraction in volatility over the past few months. These areas of trend, where the trading range contracts over time, can often lead to fast-moving markets. Gold’s monthly chart is interesting as May through June (to date) are inside months relative to April and July is inside the range of June. A pennant breakout triggers above the top pattern boundary line, but a more convincing signal occurs above the swing high at $3,451 (B).
For a look at all of today’s economic events, check out our economic calendar.