The main tag of Gold Price Articles.
You can use the search box below to find what you need.
[wd_asp id=1]
The main tag of Gold Price Articles.
You can use the search box below to find what you need.
[wd_asp id=1]
Gold surged during US trading hours on Tuesday, hitting a one-week high of $3,285.84 and trading nearby at the time of writing. Financial markets were cautiously optimistic throughout the first half of the day, but the mood soured after Wall Street’s opening, with US indexes trading in the red.
The US Dollar (USD) came under selling pressure amid renewed concerns about United States (US) President Donald Trump’s protectionism measures and the out-of-control government’s debt. Concerns arose ahead of Trump’s tax bill, which will be discussed in Congress today. The bill would add between $3 trillion and $5 trillion to the debt, according to nonpartisan analysts, Reuters reported.
The discussion takes place after Moody Ratings downgraded the government’s credit rating, citing concerns over the nation’s growing $36.2 trillion debt pile. Trump even said that the alternative to not passing the tax bill is massive tax hikes, which adds to the dismal mood.
Meanwhile, trade talks between the US and major counterparts continue. The focus is now on negotiations with Japan, with mounting tensions between the two countries amid US demands. There are no fresh headlines on US-China talks, which also weigh the sentiment lower.
Data-wise, there’s little in the macroeconomic calendar in the US side, but there worth noting that the People’s Bank of China (PBoC) cut its Loan Prime Rates (LPRs) early on Tuesday, while the Reserve Bank of Australia (RBA) also delivered an interest rate cut, lowering the Official Cash Rate (OCR) to 3.85% from 4.1%. RBA officials stated the escalation of the global trade conflict was a key downside risk to the economy.
From a technical point of view, the daily chart for the XAU/USD pair shows it reached resistance at around a mildly bearish 20 Simple Moving Average (SMA) currently at $3,287.80, while the 100 and 200 SMAs maintain their firmly bullish slopes far below the current level. Technical indicators, in the meantime, gain upward traction but remain around their midlines. The bright metal would need to extend its rally beyond the $3,300 threshold to confirm a sustained leg higher.
The near-term picture is bullish, yet could. The 4-hour chart shows the pair broke above its 200 SMA, while the 20 SMA gains upward traction below the longer one. At the same time, the pair is battling a mildly bearish 100 SMA. Finally, technical indicators advanced well above their midlines, although the Relative Strength Index (RSI) stabilized around 60, hinting at a consolidative stage before a new leg north.
Support levels: 3,265.40 3,252.10 3,235.70
Resistance levels: 3,287.60 3,300.00 3,312.90
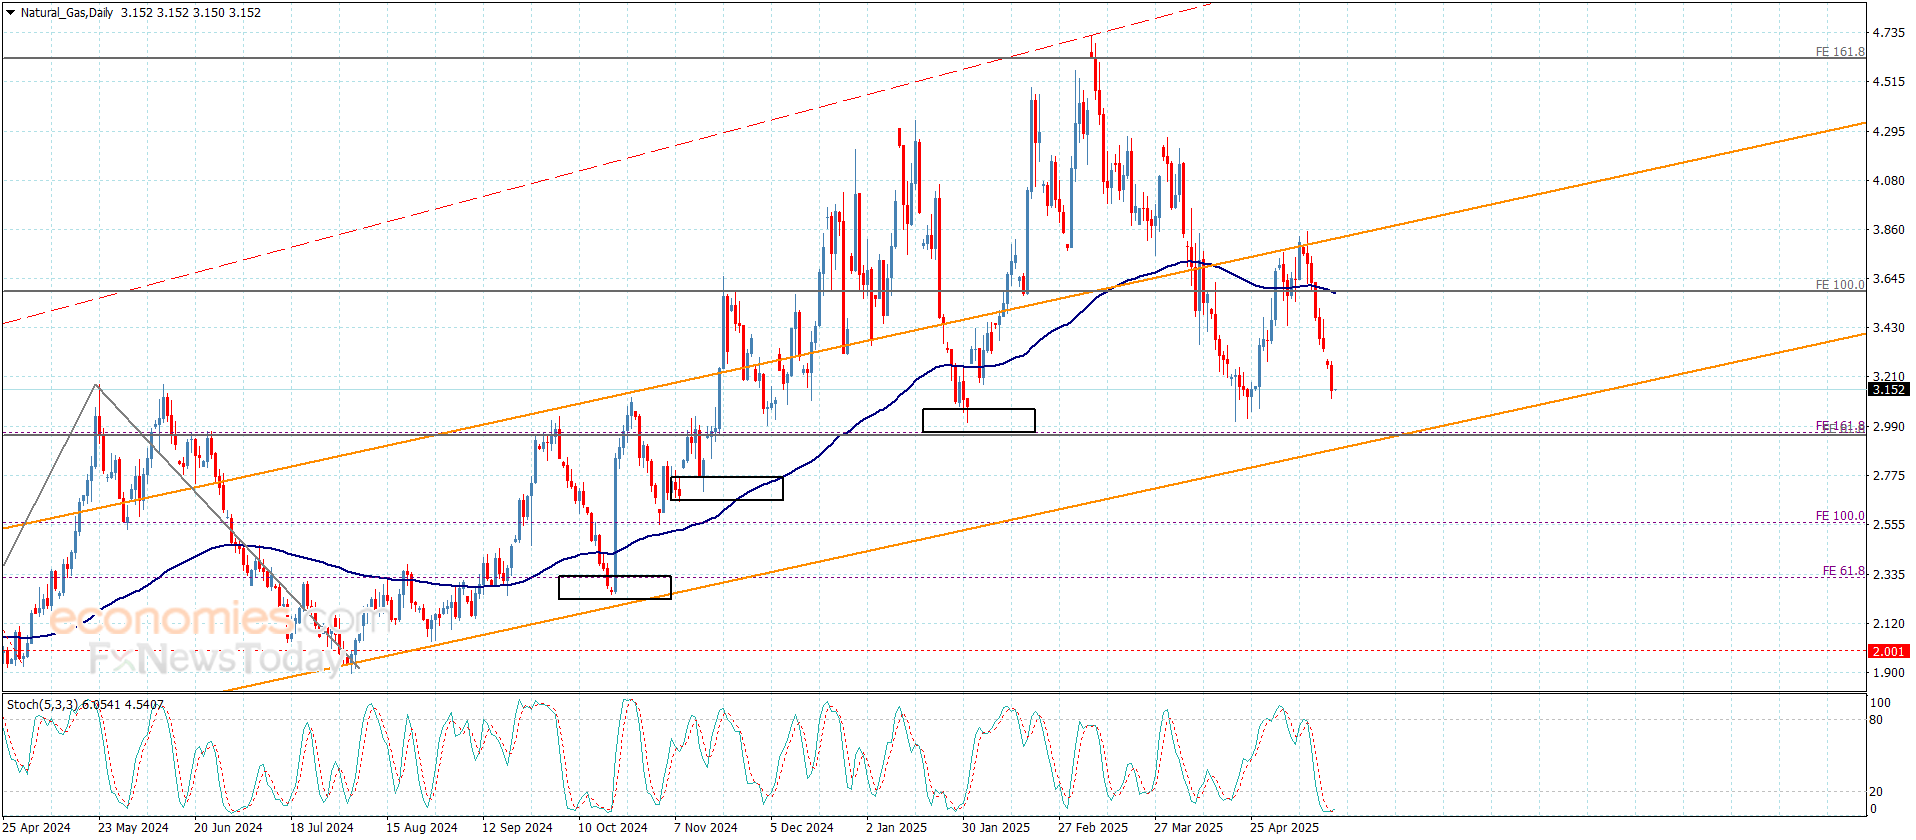
Natural gas price continues to form bearish trading, reaching to the extra negative target near $3.310, to decelerate the attempts to resume the decline in the current trading, which forces it to form weak sideways trading in the current period.
Note that the continuation of forming a strong support at $3.340 level against the current trading, by the unionism of providing negative momentum by the main indicators, these factors will increase the sharpness on the bearish track, to keep waiting for providing negative close below $3.130 level, to confirm targeting new negative stations that might begin at $2.950 and $2.730.
The expected trading range for today is between $3.000 and $3.230
Trend forecast: Bearish
Do you need help in trading decisions? Do you want to learn how to start trading?
Join Economies.com VIP Club and benefit from over 15 years of market analysis expertise and get:
Special Offer: Subscribe to the Economies.com VIP channel and get also a free subscription to a trusted trading signals channel provided by Best Trading Signal.
Silver price (XAG/USD) continues its decline for the third consecutive session, trading near $32.20 per troy ounce during Tuesday’s Asian session. The metal’s weakness comes as optimism over a potential ceasefire between Russia and Ukraine reduces demand for safe-haven assets.
Reuters reported that US President Donald Trump stated on Monday that following a call with Russian President Vladimir Putin, Ukraine and Russia are set to begin immediate ceasefire negotiations, potentially without US involvement. This development has pressured precious metals, including Silver, which typically benefit from geopolitical uncertainty.
Despite the downtrend, Silver’s losses on Monday were somewhat cushioned after Moody’s downgraded the US sovereign credit rating from “Aaa” to “Aa1” last Friday, citing rising debt levels and interest burdens significantly higher than those of similarly rated peers. This move follows similar downgrades by Fitch in 2023 and S&P in 2011.
Recent US economic data—including softer Consumer Price Index (CPI) and Producer Price Index (PPI) readings—indicate cooling inflation, bolstering expectations for Federal Reserve rate cuts in 2025. Additionally, disappointing US Retail Sales figures have heightened concerns about sustained economic weakness, which could lend support to non-yielding assets like Silver.
According to the CME FedWatch Tool, markets now anticipate two Fed rate cuts this year, likely beginning in September. Investors will closely monitor upcoming speeches from Federal Reserve (Fed) officials for further insight into the central bank’s policy direction and the broader economic outlook.
Silver is a precious metal highly traded among investors. It has been historically used as a store of value and a medium of exchange. Although less popular than Gold, traders may turn to Silver to diversify their investment portfolio, for its intrinsic value or as a potential hedge during high-inflation periods. Investors can buy physical Silver, in coins or in bars, or trade it through vehicles such as Exchange Traded Funds, which track its price on international markets.
Silver prices can move due to a wide range of factors. Geopolitical instability or fears of a deep recession can make Silver price escalate due to its safe-haven status, although to a lesser extent than Gold’s. As a yieldless asset, Silver tends to rise with lower interest rates. Its moves also depend on how the US Dollar (USD) behaves as the asset is priced in dollars (XAG/USD). A strong Dollar tends to keep the price of Silver at bay, whereas a weaker Dollar is likely to propel prices up. Other factors such as investment demand, mining supply – Silver is much more abundant than Gold – and recycling rates can also affect prices.
Silver is widely used in industry, particularly in sectors such as electronics or solar energy, as it has one of the highest electric conductivity of all metals – more than Copper and Gold. A surge in demand can increase prices, while a decline tends to lower them. Dynamics in the US, Chinese and Indian economies can also contribute to price swings: for the US and particularly China, their big industrial sectors use Silver in various processes; in India, consumers’ demand for the precious metal for jewellery also plays a key role in setting prices.
Silver prices tend to follow Gold’s moves. When Gold prices rise, Silver typically follows suit, as their status as safe-haven assets is similar. The Gold/Silver ratio, which shows the number of ounces of Silver needed to equal the value of one ounce of Gold, may help to determine the relative valuation between both metals. Some investors may consider a high ratio as an indicator that Silver is undervalued, or Gold is overvalued. On the contrary, a low ratio might suggest that Gold is undervalued relative to Silver.
· Gold price keeps range play intact below $3,250 early Tuesday.
· The US Dollar draws support from US trade deals optimism but upside appears limited.
· Gold price remains stuck between 21-day SMA and 50-day SMA amid bearish RSI.
Gold price has returned to red early Tuesday, having failed to take out the $3,250 barrier once again. The downtick in Gold price could be linked to a tepid US Dollar (USD) recovery as traders await US trade talks and Fedspeak for a fresh directional impetus.
The USD is looking to stabilize following the previous decline, led by the revival of the ‘Sell America’ theme, which triggered a big sell-off in the US assets across the financial markets. Moody’s downgraded the US sovereign credit rating on Friday by one notch from its pristine “Aaa” rating to “Aa1”, withering the ‘Brand USA’.
Investors remained wary about the long-term fiscal picture for the United States (US). “Analysts say Trump’s sweeping tax-cut bill would add $3 trillion to $5 trillion to the nation’s $36.2 trillion in debt over the next decade,” per Reuters.
In response, risk-off flows dominated on Monday and lifted the traditional safe-haven Gold price.
In Tuesday’s trading so far, the Greenback is holding the overnight bounce on renewed optimism over the potential US trade deals with India, South Korea and Japan.
South Korea and the US will meet over a second round of technical discussions on Tuesday in Washington over the latter’s reciprocal tariff measures. The talks will span over three days. Meanwhile, Bloomberg reported that India is discussing the US trade deal structured in three tranches, with an interim agreement likely before July.
Increased hopes of a ceasefire between Russia and Ukraine also act as a headwind to the traditional store of value, Gold. US President Donald Trump spoke with President Vladimir Putin on Monday and said Russia and Ukraine would immediately start negotiations toward a ceasefire, but the Kremlin said reaching an agreement would take time, while Trump indicated he was not ready to join Europe with fresh sanctions to pressure Moscow.
However, the Greenback stalled its recovery, tracking the sharp decline in the Japanese Yen (JPY) after Japan’s Finance Minister Katsunobu Kato hinted at holding FX talks with US Treasury Secretary Scott Bessent this week.
This has helped the bright metal limit its downside. Looking ahead, it remains to be seen if Gold price holds firm to bearish pressures. Speeches from a bunch of Federal Reserve (Fed) policymakers and trade talks will continue to drive the USD’s performance and the Gold price action, in the absence of high-impact US data releases.
Technically, Gold price remains confined in a range, with the upside capped by the 21-day Simple Moving Average (SMA) at $3,289 while buyers continue to find support at the 50-day SMA at $3,175.
The 14-day Relative Strength Index (RSI) sits beneath the midline, near 47.50, maintaining the downside risks.
So long as the price stays above the throwback support of the 50-day SMA, a brief recovery toward the 21-day SMA remains in the offing.
However, Gold buyers need to take out the immediate resistance at the $3,250 psychological level to march toward the 21-day SMA.
The next topside target is at the falling trendline resistance at $3,386.
On the downside, if sellers manage to crack the 50-day SMA on a daily closing basis, a fresh sell-off could be fuelled toward the $3,100 mark.
The April 10 low of $3,072 would then come to the rescue of buyers.
Gold has played a key role in human’s history as it has been widely used as a store of value and medium of exchange. Currently, apart from its shine and usage for jewelry, the precious metal is widely seen as a safe-haven asset, meaning that it is considered a good investment during turbulent times. Gold is also widely seen as a hedge against inflation and against depreciating currencies as it doesn’t rely on any specific issuer or government.
Central banks are the biggest Gold holders. In their aim to support their currencies in turbulent times, central banks tend to diversify their reserves and buy Gold to improve the perceived strength of the economy and the currency. High Gold reserves can be a source of trust for a country’s solvency. Central banks added 1,136 tonnes of Gold worth around $70 billion to their reserves in 2022, according to data from the World Gold Council. This is the highest yearly purchase since records began. Central banks from emerging economies such as China, India and Turkey are quickly increasing their Gold reserves.
Gold has an inverse correlation with the US Dollar and US Treasuries, which are both major reserve and safe-haven assets. When the Dollar depreciates, Gold tends to rise, enabling investors and central banks to diversify their assets in turbulent times. Gold is also inversely correlated with risk assets. A rally in the stock market tends to weaken Gold price, while sell-offs in riskier markets tend to favor the precious metal.
The price can move due to a wide range of factors. Geopolitical instability or fears of a deep recession can quickly make Gold price escalate due to its safe-haven status. As a yield-less asset, Gold tends to rise with lower interest rates, while higher cost of money usually weighs down on the yellow metal. Still, most moves depend on how the US Dollar (USD) behaves as the asset is priced in dollars (XAU/USD). A strong Dollar tends to keep the price of Gold controlled, whereas a weaker Dollar is likely to push Gold prices up.
Platinum price neediness to the negative momentum led to form some of the bullish waves by its stability above $983.00, approaching from the resistance at $1005.00, note that the continuation of providing positive momentum by the main indicators will confirm delaying the negative attack, to increase the chances of the trading rally towards 61.8%Fibonacci correction level, which forms the dividing line between confirming the main trend in the upcoming trading.
Therefore, we expect the continuation of the price’s fluctuation within tight range, to keep waiting for its decline below $983.00, which allows it activate the negative attack and reach towards the negative stations near $966.00 and $950.00.
The expected trading range for today is between $983.00 and $1010.00
Trend forecast: Fluctuated
Do you need help in trading decisions? Do you want to learn how to start trading?
Join Economies.com VIP Club and benefit from over 15 years of market analysis expertise and get:
Special Offer: Subscribe to the Economies.com VIP channel and get also a free subscription to a trusted trading signals channel provided by Best Trading Signal.
Platinum price neediness to the negative momentum led to form some of the bullish waves by its stability above $983.00, approaching from the resistance at $1005.00, note that the continuation of providing positive momentum by the main indicators will confirm delaying the negative attack, to increase the chances of the trading rally towards 61.8%Fibonacci correction level, which forms the dividing line between confirming the main trend in the upcoming trading.
Therefore, we expect the continuation of the price’s fluctuation within tight range, to keep waiting for its decline below $983.00, which allows it activate the negative attack and reach towards the negative stations near $966.00 and $950.00.
The expected trading range for today is between $983.00 and $1010.00
Trend forecast: Fluctuated
Do you need help in trading decisions? Do you want to learn how to start trading?
Join Economies.com VIP Club and benefit from over 15 years of market analysis expertise and get:
Special Offer: Subscribe to the Economies.com VIP channel and get also a free subscription to a trusted trading signals channel provided by Best Trading Signal.
The Gold price (XAU/USD) edges lower to around $3,230 during the early Asian session on Tuesday, pressured by a modest US Dollar (USD) rebound. However, the concerns over the US economic health after Moody’s downgrades the US national credit rating might cap its downside.
The Greenback recovers on Tuesday, capping the upside for the USD-denominated commodity price. Nonetheless, the economic uncertainties could boost the safe-haven flows. Moody’s cut the US rating to “Aa1” from “Aaa” on Friday, citing rising debt and interest “that are significantly higher than similarly rated sovereigns”. The economic uncertainties provide some support to the safe asset like Gold.
“Overall, over the next few months, I think gold is a good safe bet considering the downgrade on the United States. It’s still to me a buy-and-hold market,” said Bob Haberkorn, senior market strategist at RJO Futures.
Financial markets were also shaken when US Treasury Secretary Scott Bessent said on Sunday that US President Donald Trump would slap tariffs at the rate he threatened on April 2 if trade partners do not engage in “good faith.”
Gold has played a key role in human’s history as it has been widely used as a store of value and medium of exchange. Currently, apart from its shine and usage for jewelry, the precious metal is widely seen as a safe-haven asset, meaning that it is considered a good investment during turbulent times. Gold is also widely seen as a hedge against inflation and against depreciating currencies as it doesn’t rely on any specific issuer or government.
Central banks are the biggest Gold holders. In their aim to support their currencies in turbulent times, central banks tend to diversify their reserves and buy Gold to improve the perceived strength of the economy and the currency. High Gold reserves can be a source of trust for a country’s solvency. Central banks added 1,136 tonnes of Gold worth around $70 billion to their reserves in 2022, according to data from the World Gold Council. This is the highest yearly purchase since records began. Central banks from emerging economies such as China, India and Turkey are quickly increasing their Gold reserves.
Gold has an inverse correlation with the US Dollar and US Treasuries, which are both major reserve and safe-haven assets. When the Dollar depreciates, Gold tends to rise, enabling investors and central banks to diversify their assets in turbulent times. Gold is also inversely correlated with risk assets. A rally in the stock market tends to weaken Gold price, while sell-offs in riskier markets tend to favor the precious metal.
The price can move due to a wide range of factors. Geopolitical instability or fears of a deep recession can quickly make Gold price escalate due to its safe-haven status. As a yield-less asset, Gold tends to rise with lower interest rates, while higher cost of money usually weighs down on the yellow metal. Still, most moves depend on how the US Dollar (USD) behaves as the asset is priced in dollars (XAU/USD). A strong Dollar tends to keep the price of Gold controlled, whereas a weaker Dollar is likely to push Gold prices up.
Since the market seemed to recognize the 61.8% retracement zone, the next lower Fibonacci level at $3.07 seems destined to be tested as support before the bearish correction completes. And given the degree of bearish momentum exhibited in the wide range red candle for the day, the next uptrend line may also be tested as support before the bearish correction completes.
The scenario unfolding fits with the larger pattern discussed earlier. A breakdown from a head and shoulders top triggered on April 7 and it led to a sharp decline. Eventually support was found at what is now a swing low of $2.86. That support area was marked by the light blue anchored volume weighted average price line (AVWAP) from the 2024 trend lows. In other words, a potentially significant price level given that it incorporates the full uptrend.
So far, that has been the case. Given its potentially long-term significance, it would be the maximum estimated low for the current decline. The more likely scenario seems to be that support is found at or above the uptrend line and that leads to a bullish reversal. A higher swing low would then be established.
Not mentioned yet is the 200-Day MA. It is now at $3.19, and it failed to hold as support during Monday’s decline. That is fine if natural gas doesn’t stay below the 200-Day line for long. Notice that the 200-Day MA was breached during the prior drop that triggered the head and shoulders top pattern. The subsequent recovery quickly rallied above the 200-Day MA, and the bulls stayed in the chart until the recent trend high at $3.84.
For a look at all of today’s economic events, check out our economic calendar.
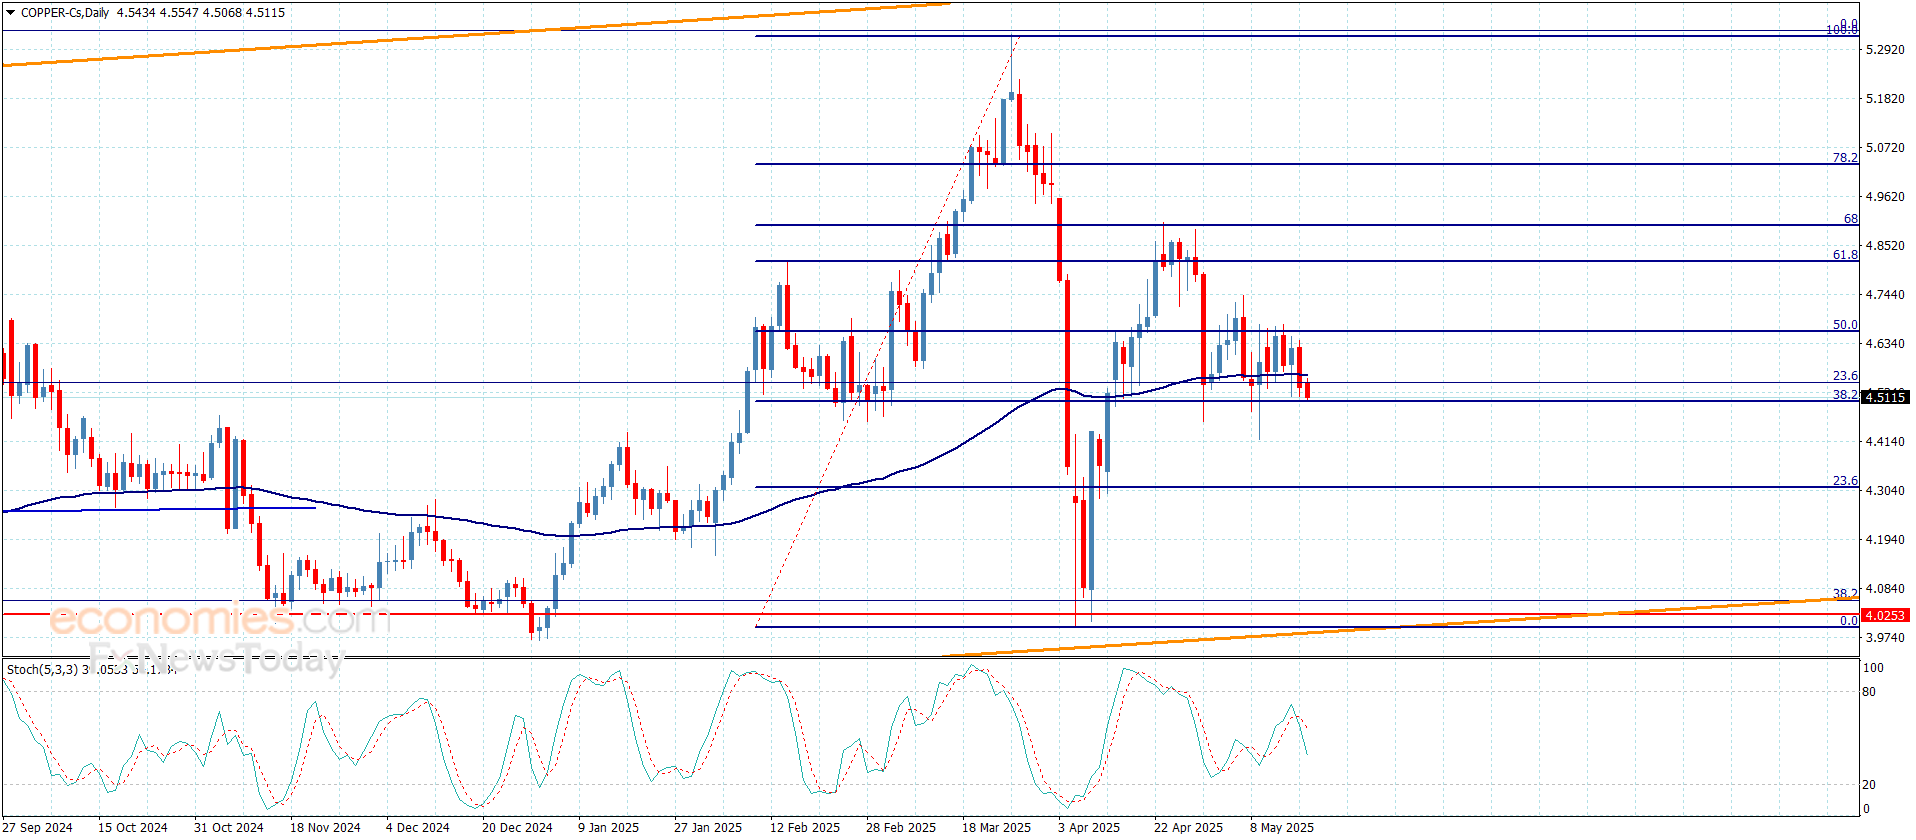
Copper price began forming a negative move, activating with the negativity of the main indicators, to settle near the extra support at $4.5000, facing negative pressures will increase the chances for breaking the current support, to open the way towards targeting extra negative stations, which might begin at $4.4500 reaching $4.3100.
The failure to break the current support might push the price to form mixed trading, and there is a new chance for targeting 50%Fibonacci correction level near $4.6600.
The expected trading range for today is between $4.4500 and $4.5600
Trend forecast: Bearish
Do you need help in trading decisions? Do you want to learn how to start trading?
Join Economies.com VIP Club and benefit from over 15 years of market analysis expertise and get:
Special Offer: Subscribe to the Economies.com VIP channel and get also a free subscription to a trusted trading signals channel provided by Best Trading Signal.
Gold price is up on Monday, with the bright metal peaking at $3,249.84 during Asian trading hours amid broad US Dollar (USD) weakness. The Greenback fell throughout the first half of the day amid discouraging United States (US) news. Moody’s downgraded the US government’s credit rating from Aaa to Aa1 due to concerns about the country´s growing debt.
Asian shares tumbled, further weighed by mixed Chinese data. April Retail Sales were up 5.1% YoY in April, missing expectations, while Industrial Production in the same period was up 6.1%, better than the 5.5% anticipated, although below the previous 7.7%
The USD found some near-term demand after Wall Street’s opening, as US indexes partially shrugged off the downbeat mood and trade mixed. As a result, the XAU/USD pair retreated towards the current $3,230 price zone.
Several US Federal Reserve (Fed) speakers hit the wires at the beginning of the week, but their remarks failed to impress, holding on to their cautiously optimistic stance, still concerned about the impact of tariffs on inflation.
The Reserve Bank of Australia (RBA) will announce its decision on monetary policy in the upcoming Asian session. The RBA is widely anticipated to cut the Official Cash Rate (OCR) by 25 basis points (bps) to 3.85% from the current 4.1%.
The daily chart for the XAU/USD pair shows it trades at the upper end of Friday’s range, with little bullish impulse. Technical indicators turned marginally higher, but remain within negative levels, while a bearish 20 Simple Moving Average (SMA) stands well above the current level, providing resistance at around $3,293. The 100 and 200 SMAs keep advancing far below the current level, suggesting sellers are out of the picture at the time being.
In the near term, and according to the 4-hour chart, XAU/USD is neutral. The pair trades between directionless moving averages, with a flat 20 SMA providing intraday support at $3,204.70. At the same time, the Momentum indicator turned lower while holding above its 100 level, while the Relative Strength Index (RSI) indicator heads nowhere at around 51.
Support levels: 3,215.90 3,204.70 3,187.10
Resistance levels: 3,250.00 3,265.80 3,288.70