The main tag of Gold Price Articles.
You can use the search box below to find what you need.
[wd_asp id=1]
The main tag of Gold Price Articles.
You can use the search box below to find what you need.
[wd_asp id=1]
Silver (XAG/USD) struggles to capitalize on its modest intraday uptick and retreats slightly after touching a fresh weekly high, around the $31.30 region during the early European session on Thursday. The intraday selling picks up pace in the last hour and drags the white metal back below the $31.00 mark as traders now look forward to the US consumer inflation figures before placing fresh directional bets.
From a technical perspective, the XAG/USD now seems to have found acceptance above the 38.2% Fibonacci retracement level of the recent slump from the March swing high to a fresh year-to-date low touched earlier this week. The subsequent move up, however, stalls ahead of the 50% Fibo. level. Moreover, oscillators on the daily chart – though they have been recovering from lower levels – are holding in negative territory. This, in turn, warrants some caution before positioning for an extension of the weekly uptrend from the $28.25 region, or the lowest level since September 2024.
In the meantime, any further slide below the 38.2% Fibo. level is likely to find some support near the $30.55 region. Some follow-through selling, however, could make the XAG/USD vulnerable to accelerate the fall towards the $30.00 psychological mark en route to the 23.6% Fibo. level, around the $29.80-$29.75 zone. Failure to defend the said support levels would shift the near-term bias back in favor of bearish traders. The white metal might then decline to the $29.35-$29.30 zone en route to the $29.00 mark and eventually aim towards retesting the multi-month low, around the $28.25 region.
On the flip side, bulls might now wait for a sustained strength beyond the daily swing high, around the $31.30 region, which nears the 50% Fibo. level, before placing fresh bets. The subsequent move-up should allow the XAG/USD to reclaim the $32.00 mark and climb further towards the 61.8% Fibo. level, around the $32.15-$32.20 zone. The latter should act as a key pivotal point, which if cleared decisively will be seen as a fresh trigger for bullish traders and lift the white metal beyond the $32.65 intermediate barrier, towards the $33.00 round figure.
Silver is a precious metal highly traded among investors. It has been historically used as a store of value and a medium of exchange. Although less popular than Gold, traders may turn to Silver to diversify their investment portfolio, for its intrinsic value or as a potential hedge during high-inflation periods. Investors can buy physical Silver, in coins or in bars, or trade it through vehicles such as Exchange Traded Funds, which track its price on international markets.
Silver prices can move due to a wide range of factors. Geopolitical instability or fears of a deep recession can make Silver price escalate due to its safe-haven status, although to a lesser extent than Gold’s. As a yieldless asset, Silver tends to rise with lower interest rates. Its moves also depend on how the US Dollar (USD) behaves as the asset is priced in dollars (XAG/USD). A strong Dollar tends to keep the price of Silver at bay, whereas a weaker Dollar is likely to propel prices up. Other factors such as investment demand, mining supply – Silver is much more abundant than Gold – and recycling rates can also affect prices.
Silver is widely used in industry, particularly in sectors such as electronics or solar energy, as it has one of the highest electric conductivity of all metals – more than Copper and Gold. A surge in demand can increase prices, while a decline tends to lower them. Dynamics in the US, Chinese and Indian economies can also contribute to price swings: for the US and particularly China, their big industrial sectors use Silver in various processes; in India, consumers’ demand for the precious metal for jewellery also plays a key role in setting prices.
Silver prices tend to follow Gold’s moves. When Gold prices rise, Silver typically follows suit, as their status as safe-haven assets is similar. The Gold/Silver ratio, which shows the number of ounces of Silver needed to equal the value of one ounce of Gold, may help to determine the relative valuation between both metals. Some investors may consider a high ratio as an indicator that Silver is undervalued, or Gold is overvalued. On the contrary, a low ratio might suggest that Gold is undervalued relative to Silver.
The EURUSD price continues the rise during its recent intraday trading, amid the strong dominance of the main upward trend. The pair’s recent rise came despite the emergence of negative signals on the Relative Strength Index (RSI) indicators, after reaching highly overbought levels, which highlights the strength of this positive trend.
To get our more detailed analysis and 100% accurate signals provided by Best Trading Signal, subscribe to Economies.com VIP Club through the link below!
The reprieve that we got during the trading session on Thursday, quite frankly, I think was a bit of a short covering rally and I think a lot of traders are starting to look at this and go, well, has anything actually changed? Maybe things aren’t as bad as they could be, but the real trade tariff issue right now between the United States and China is going to cause a lot of major problems.

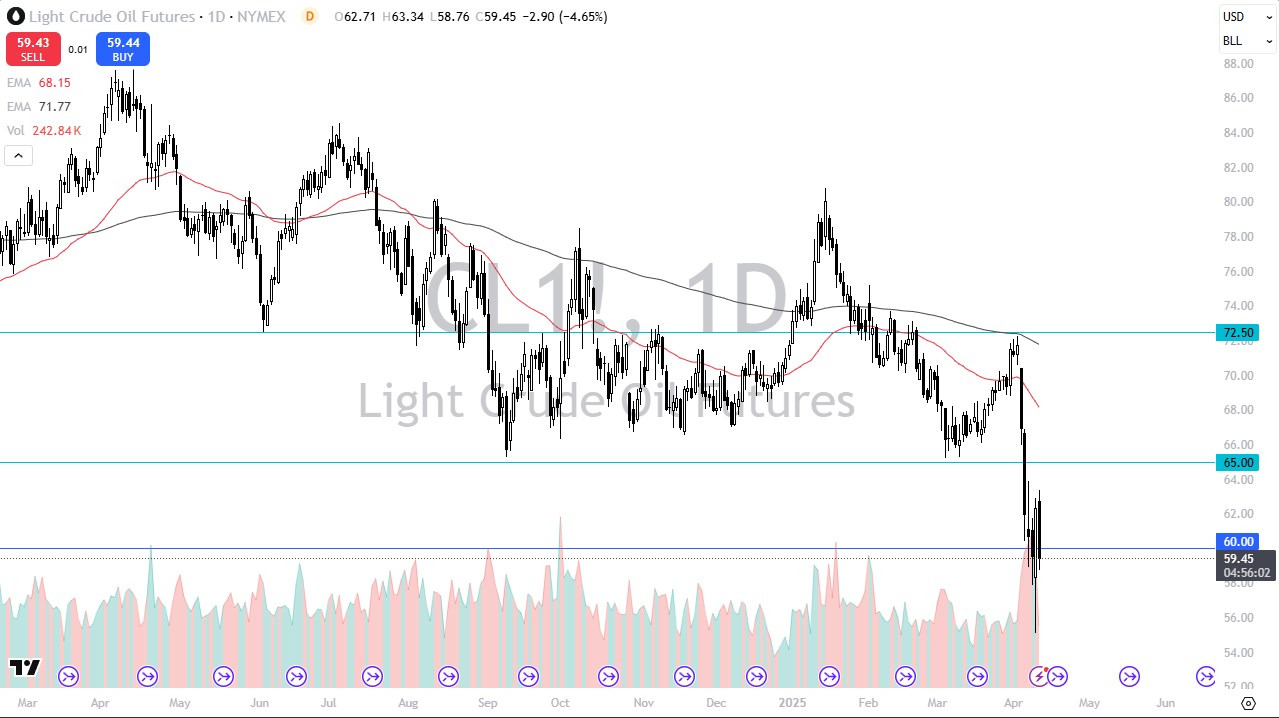
The market bouncing from here should be thought of as a gift for sellers to get involved in, but I really don’t like the idea of trying to catch a falling knife here. The best case scenario for crude oil at the moment is going to be spending a lot of time around the $60 level. For what it is worth, I was watching the futures market earlier and there was definitely some type of bid right around the $60 level. So, we’ll have to watch that closely. As I record this video, we are down about 50 cents below that level, but we have also bounced from the lows of the day. So, all things being equal, this is a market that I think is in transition and we will have to pay close attention to whether or not it can pick itself up off the floor. Job one for the bulls will be to go sideways for a while. If we break down below the $55 level, look out below. Crude oil, probably just craters.
Ready to trade daily crude oil price analysis? We’ve shortlisted the best Forex Oil trading brokers in the industry for you.
Gold price (XAU/USD) keeps its range close to fresh all-time highs near $3,220 in early Europe on Friday. The US Dollar (USD) downward spiral and escalating trade war between the United States (US) and China continue to underpin the safe-haven appeal of Gold price.
Data released by the US Bureau of Labor Statistics (BLS) on Thursday revealed that US consumer prices unexpectedly fell in March, but inflation risks are tilted to the upside after US President Donald Trump doubled down on China tariffs. The US CPI inflation eased to 2.4% YoY in March from 2.8% in February. This reading came in below the market expectation of 2.6%.
The core CPI, which excludes volatile food and energy prices, increased 2.8% YoY in March, compared to a rise of 3.1% seen in February and came in below the consensus of 3.0%. On a monthly basis, the headline CPI declined 0.1%, while the core CPI rose 0.1%.
Trump said on Wednesday he would temporarily lower duties on dozens of countries. However, Trump also raised tariffs on China to 125%, effective immediately, after Beijing announced plans to retaliate with 84% duties. The worries over the global economy and the renewed trade tensions between the world’s two biggest economies keep investors in safe-haven assets, supporting the Gold price.
“Gold regains its safe-haven appeal and gets back on track for new all-time highs,” said Nikos Tzabouras, Senior Market Analyst at Tradu.com.
Additionally, increased dovish bets surrounding Federal Reserve (Fed) rate cuts this year exacerbate the Greenback’s pain, strengthening the USD-denominated commodity price. Traders continue pricing three or four rate cuts this year.
The daily chart shows that the 14-day Relative Strength Index (RSI) is prodding the overbought region at 70, suggesting more room for upside before the buyers’ exhaustion sets in.
The immediate resistance is seen at the $3,250 psychological level, above which a fresh uptrend toward the $3,300 threshold would be in the offing.
On the downside, the initial demand area is seen at $3,200, below which the 21-day Simple Moving Average (SMA) resistance-turned-support at $3,061 could come into play.
If the correction extends, the $3,000 mark will be the last line of defense for buyers.
The table below shows the percentage change of US Dollar (USD) against listed major currencies this week. US Dollar was the weakest against the Swiss Franc.
| USD | EUR | GBP | JPY | CAD | AUD | NZD | CHF | |
|---|---|---|---|---|---|---|---|---|
| USD | -2.99% | -0.98% | -1.45% | -2.07% | -2.61% | -3.42% | -4.02% | |
| EUR | 2.99% | 2.36% | 2.20% | 1.58% | 0.32% | 0.18% | -0.45% | |
| GBP | 0.98% | -2.36% | -1.42% | -0.77% | -1.99% | -2.13% | -2.74% | |
| JPY | 1.45% | -2.20% | 1.42% | -0.59% | -0.21% | -0.76% | -2.25% | |
| CAD | 2.07% | -1.58% | 0.77% | 0.59% | -0.90% | -1.38% | -2.25% | |
| AUD | 2.61% | -0.32% | 1.99% | 0.21% | 0.90% | -0.15% | -0.77% | |
| NZD | 3.42% | -0.18% | 2.13% | 0.76% | 1.38% | 0.15% | -0.62% | |
| CHF | 4.02% | 0.45% | 2.74% | 2.25% | 2.25% | 0.77% | 0.62% |
The heat map shows percentage changes of major currencies against each other. The base currency is picked from the left column, while the quote currency is picked from the top row. For example, if you pick the US Dollar from the left column and move along the horizontal line to the Japanese Yen, the percentage change displayed in the box will represent USD (base)/JPY (quote).
Gold has played a key role in human’s history as it has been widely used as a store of value and medium of exchange. Currently, apart from its shine and usage for jewelry, the precious metal is widely seen as a safe-haven asset, meaning that it is considered a good investment during turbulent times. Gold is also widely seen as a hedge against inflation and against depreciating currencies as it doesn’t rely on any specific issuer or government.
Central banks are the biggest Gold holders. In their aim to support their currencies in turbulent times, central banks tend to diversify their reserves and buy Gold to improve the perceived strength of the economy and the currency. High Gold reserves can be a source of trust for a country’s solvency. Central banks added 1,136 tonnes of Gold worth around $70 billion to their reserves in 2022, according to data from the World Gold Council. This is the highest yearly purchase since records began. Central banks from emerging economies such as China, India and Turkey are quickly increasing their Gold reserves.
Gold has an inverse correlation with the US Dollar and US Treasuries, which are both major reserve and safe-haven assets. When the Dollar depreciates, Gold tends to rise, enabling investors and central banks to diversify their assets in turbulent times. Gold is also inversely correlated with risk assets. A rally in the stock market tends to weaken Gold price, while sell-offs in riskier markets tend to favor the precious metal.
The price can move due to a wide range of factors. Geopolitical instability or fears of a deep recession can quickly make Gold price escalate due to its safe-haven status. As a yield-less asset, Gold tends to rise with lower interest rates, while higher cost of money usually weighs down on the yellow metal. Still, most moves depend on how the US Dollar (USD) behaves as the asset is priced in dollars (XAU/USD). A strong Dollar tends to keep the price of Gold controlled, whereas a weaker Dollar is likely to push Gold prices up.
The likely daily close below the uptrend line is bearish, and more so since it follows a decline after finding resistance around a key short-term price zone. Wednesday’s high of $3.83 found resistance a little below the 50-Day MA, which had previously denoted as trend support. That is potentially bearish by itself as the progression of a bear trend typically rises to test prior support as resistance before it continues lower.
Also, notice that resistance was seen both yesterday and today around the middle line within the falling channel (red). There are also two prior interim price swing lows at $3.73 and $3.74, that now mark potential resistance. Finally, potential resistance around the 20-Week MA is at $3.71.
In other words, since a close below the trendline is bearish, and resistance was seen over several days in an area of confluence, there remains the potential for a bearish continuation of the corrective decline that followed the recent peak of $4.90. Moreover, a declining channel remains in place and natural gas continues to trade below both the 20-Day and 50-Day MAs.
Therefore, although a rise above today’s would be a sign of strength given that the uptrend line and middle channel line would have been reclaimed, natural gas would be heading into prior consolidation and potential resistance around the 50-Day MA, now at $3.88, and the 20-Day MA, at $3.92 currently. Moreover, the relative strength index (RSI) remains in a downtrend and may establish a lower swing high.
One or a few days more of price action should begin to clarify the developing patterns. A 78.6% retracement was completed yesterday on the way to support at $3.34. Since a sharp rally followed, it showed buyers back in charge. Therefore, new bullish signs, starting with a rally above today’s high, should be seen as follow-through to renewed strength. If not, indicated by a drop below $3.46 and $3.34, then further downside becomes likely.
For a look at all of today’s economic events, check out our economic calendar.
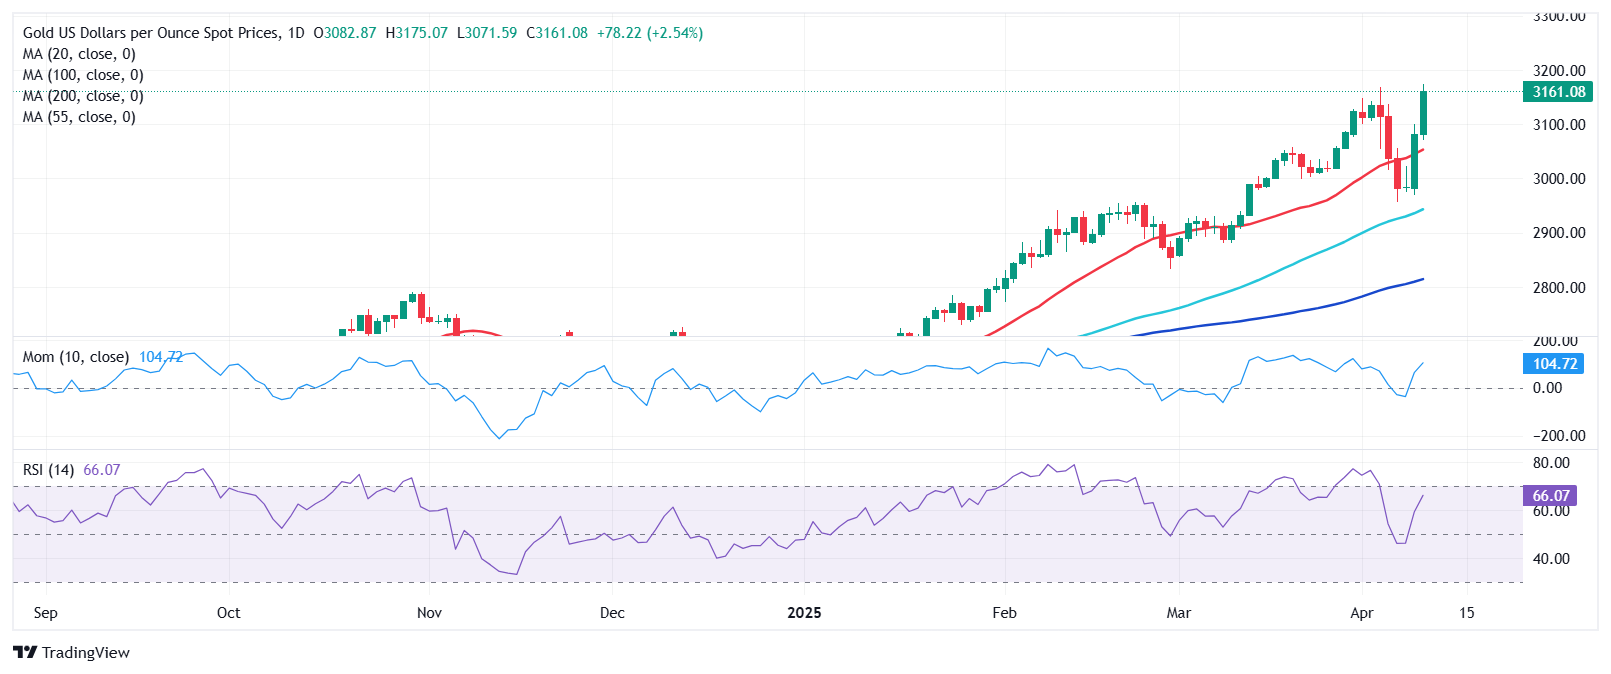
The bright metal soared on Thursday, hitting a fresh all-time high of $3,175.00 a troy ounce during American trading hours. The US Dollar (USD) plummeted on headlines indicating the trade war unleashed by US President Donald Trump is far from over.
Trump announced massive retaliatory tariffs last week, only to pause most of them on Wednesday. Stock markets collapsed with the original news, recovering with the more optimistic pause. However, the good mood was short-lived. The White House confirmed on Thursday that levies on China account for 145%, the original 20% plus an additional 125%, which followed Beijing’s announcement of retaliatory 84% levies.
Tensions between the two countries revived concerns about a potential United States (US) recession around the corner. Even further, the US March Consumer Price Index (CPI) released earlier in the day showed inflationary pressures eased by more than anticipated, which will help the Federal Reserve (Fed) extend its wait-and-see stance on monetary policy. With easing inflation and fears of an economic setback, it’s not crazy to think the Fed could even hike interest rates in the future.
Wall Street plummeted with the news, falling alongside the USD. At the time of writing, the Dow Jones Industrial Average is down roughly 4%, while the Nasdaq Composite and the S&P 500 shed over 5% each.
From a technical perspective, Valeria Bednarik, FXStreet Chief Analyst, notes: “The XAU/USD pair daily chart shows that additional gains are likely, given the strong upward momentum. Technical indicators head north almost vertically while still far from overbought levels. At the same time, the bright metal extended its advance beyond a now bullish 20 Simple Moving Average (SMA), currently at $3,052. Finally, the 100 and 200 SMAs also aim north, but far below the shorter one.”
Bednarik foresees XAU/USD reaching the $3,200 region in the upcoming sessions.
Generally speaking, a trade war is an economic conflict between two or more countries due to extreme protectionism on one end. It implies the creation of trade barriers, such as tariffs, which result in counter-barriers, escalating import costs, and hence the cost of living.
An economic conflict between the United States (US) and China began early in 2018, when President Donald Trump set trade barriers on China, claiming unfair commercial practices and intellectual property theft from the Asian giant. China took retaliatory action, imposing tariffs on multiple US goods, such as automobiles and soybeans. Tensions escalated until the two countries signed the US-China Phase One trade deal in January 2020. The agreement required structural reforms and other changes to China’s economic and trade regime and pretended to restore stability and trust between the two nations. However, the Coronavirus pandemic took the focus out of the conflict. Yet, it is worth mentioning that President Joe Biden, who took office after Trump, kept tariffs in place and even added some additional levies.
The return of Donald Trump to the White House as the 47th US President has sparked a fresh wave of tensions between the two countries. During the 2024 election campaign, Trump pledged to impose 60% tariffs on China once he returned to office, which he did on January 20, 2025. With Trump back, the US-China trade war is meant to resume where it was left, with tit-for-tat policies affecting the global economic landscape amid disruptions in global supply chains, resulting in a reduction in spending, particularly investment, and directly feeding into the Consumer Price Index inflation.
Today is the second sequential strong up day for gold as represented with the wide range green candles. Might a similar third day of gains be possible or will potential resistance lead to a pullback before gold attempts to go higher? Since three strong moves following a bearish pullback would provide a three white soldiers candlestick pattern, the possibility of a third strong up day needs to be considered. But, of course, a decisive breakout above today’s high would need to occur to signal that possibility. Otherwise, today’s high, which reached a potential significant resistance area, may lead to a pullback into Thursday’s trading range.
The next higher target above the prior record high was $3,170 and it slightly exceeded today. That price target is noted given how close it is to the top rising trend channel (blue) covering the advance from the December lows. A more significant potential target is up around $3,199 to $3,205. Since the market seems to be recognizing that top channel line, it can be watched along with the higher target zone. Following the $3,205 target are higher targets of $3,232 and 3,250.
In addition to signs of strength noted above, today’s advance triggered a second breakout attempt from a larger long-term rising parallel trend channel (purple). The first breakout last week failed but this second attempt may have greater success. If the breakout is sustained, then bullish continuation within the smaller trend channel parameters becomes more likely.
Therefore, the top purple channel line is potential support and is currently around $3,126 but since the line is rising the price will change. There are also prior weekly highs at $3,087 and $3,058 where support could be seen. Since this week established a wide trading range, a bearish pullback could result in volatility being higher than normal pullbacks.
For a look at all of today’s economic events, check out our economic calendar.
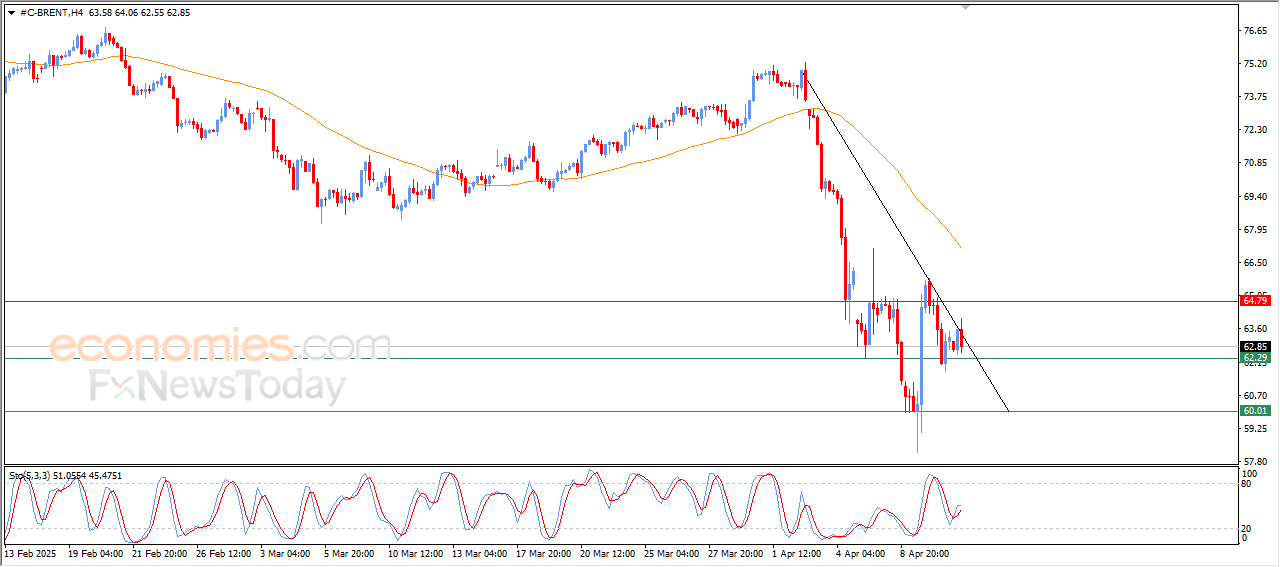
Brent crude oil price declined in its recent intraday trading, attempting to gain positive momentum that may help the price breach the current resistance at $64.80. At the same time, it is working to relieve the clear overbought conditions indicated by the Relative Strength Index (RSI), supported by the strong rally seen in yesterday’s session, announcing the start of a bullish corrective wave.
To get our more detailed analysis and 100% accurate signals provided by Best Trading Signal, subscribe to Economies.com VIP Club through the link below!
There’s quite a few countries out there that have been tariffing the United States 20, 30, 40 % for decades. So really it does more or less kind of just somewhat even the playing field. It’s not aggressive. It’s something that producers of various goods around the world can absorb.
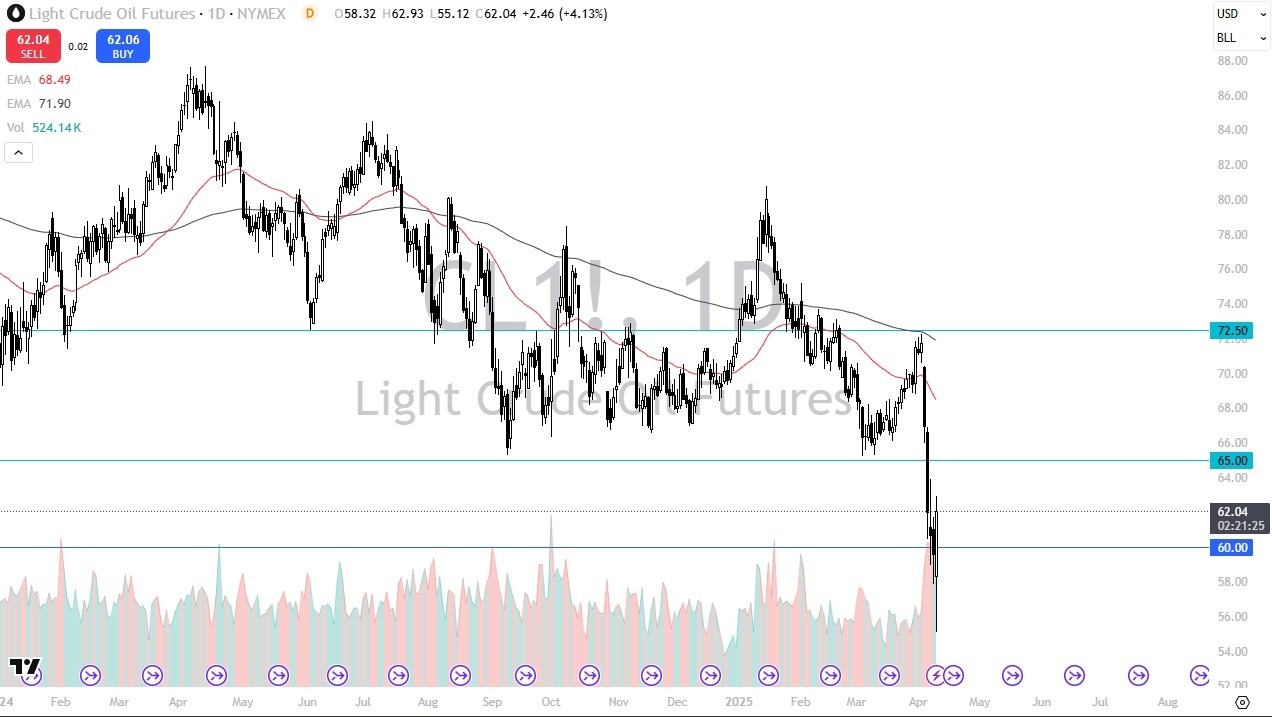
That being said, it’s worth noting that we are above the $60 level, but we are giving back some of the gains. And I think the process here is going to be extraordinarily noisy. The $65 level above is a massive barrier. If we could break that, it would be a huge win for the bulls. But right now, I don’t think we’re anywhere near that. I think we’re probably closer to a situation where we’re trying to form some type of basing pattern that is higher than we hit overnight. But we also have to worry about China and their reaction to the now 125 % tariffs on their goods, because during the day Amazon, and I’m starting to hear a little bit of chatter from Walmart as well, are canceling orders from China. This is a big deal. This means things just got a little uglier. Chinese banks have been ordered not to buy US dollars. Good luck with that. There’s no way to pay international debts without them. So, things are going to get very interesting very quick.
With that being said, there is a certain amount of concern about the overall global demand. If China slips into a recession and the US slips into a recession, everybody feels it. So, I think this is still a market that you would want to at least think about being bearish on, but you might want to get out of the way of trying to short it. A range between $60 and $65 does make a certain amount of sense, but you need stability before you start putting money to work.
Ready to trade daily crude oil price analysis? We’ve shortlisted the best Forex Oil trading brokers in the industry for you.
The bright metal soared on Thursday, hitting a fresh all-time high of $3,175.00 a troy ounce during American trading hours. The US Dollar (USD) plummeted on headlines indicating the trade war unleashed by US President Donald Trump is far from over.
Trump announced massive retaliatory tariffs last week, only to pause most of them on Wednesday. Stock markets collapsed with the original news, recovering with the more optimistic pause. However, the good mood was short-lived. The White House confirmed on Thursday that levies on China account for 145%, the original 20% plus an additional 125%, which followed Beijing’s announcement of retaliatory 84% levies.
Tensions between the two countries revived concerns about a potential United States (US) recession around the corner. Even further, the US March Consumer Price Index (CPI) released earlier in the day showed inflationary pressures eased by more than anticipated, which will help the Federal Reserve (Fed) extend its wait-and-see stance on monetary policy. With easing inflation and fears of an economic setback, it’s not crazy to think the Fed could even hike interest rates in the future.
Wall Street plummeted with the news, falling alongside the USD. At the time of writing, the Dow Jones Industrial Average is down roughly 4%, while the Nasdaq Composite and the S&P 500 shed over 5% each.
From a technical perspective, Valeria Bednarik, FXStreet Chief Analyst, notes: “The XAU/USD pair daily chart shows that additional gains are likely, given the strong upward momentum. Technical indicators head north almost vertically, while still far from overbought levels. At the same time, the bright metal extended its advance beyond a now bullish 20 Simple Moving Average (SMA), currently at $3,052. Finally, the 100 and 200 SMAs also aim north, but far below the shorter one.”
Bednarik foresees XAU/USD reaching the $3,200 region in the upcoming sessions.
Generally speaking, a trade war is an economic conflict between two or more countries due to extreme protectionism on one end. It implies the creation of trade barriers, such as tariffs, which result in counter-barriers, escalating import costs, and hence the cost of living.
An economic conflict between the United States (US) and China began early in 2018, when President Donald Trump set trade barriers on China, claiming unfair commercial practices and intellectual property theft from the Asian giant. China took retaliatory action, imposing tariffs on multiple US goods, such as automobiles and soybeans. Tensions escalated until the two countries signed the US-China Phase One trade deal in January 2020. The agreement required structural reforms and other changes to China’s economic and trade regime and pretended to restore stability and trust between the two nations. However, the Coronavirus pandemic took the focus out of the conflict. Yet, it is worth mentioning that President Joe Biden, who took office after Trump, kept tariffs in place and even added some additional levies.
The return of Donald Trump to the White House as the 47th US President has sparked a fresh wave of tensions between the two countries. During the 2024 election campaign, Trump pledged to impose 60% tariffs on China once he returned to office, which he did on January 20, 2025. With Trump back, the US-China trade war is meant to resume where it was left, with tit-for-tat policies affecting the global economic landscape amid disruptions in global supply chains, resulting in a reduction in spending, particularly investment, and directly feeding into the Consumer Price Index inflation.
Disclaimer: For information purposes only. Past performance is not indicative of future results.