The main tag of Gold Price Articles.
You can use the search box below to find what you need.
[wd_asp id=1]
The main tag of Gold Price Articles.
You can use the search box below to find what you need.
[wd_asp id=1]
Coffee price began gathering its gains by activating the bearish correctional track after breaking 370.65, to notice its decline towards 338.20, to settle below the moving average 55.
Stochastic reach to the oversold level will increase the negative pressures, which makes us prefer targeting extra negative stations that might begin at 332.00 and 326.30 before any attempt to regain the bullish track.
The expected trading range for today is between 332.00 and 355.10
Trend forecast: Bearish
To get our more detailed analysis and 100% accurate signals provided by Best Trading Signal, subscribe to Economies.com VIP Club through the link below!
The price of Ethereum (ETHUSD) has risen during its recent intraday trading, following the stability of the support level at $1,404, which has provided some positive momentum. This momentum aims to recover part of the previous losses and get rid of its clear oversold conditions indicated by the Relative Strength Index (RSI), especially that positive signals begin to emerge, accompanied with the domination of the main bearish trend.
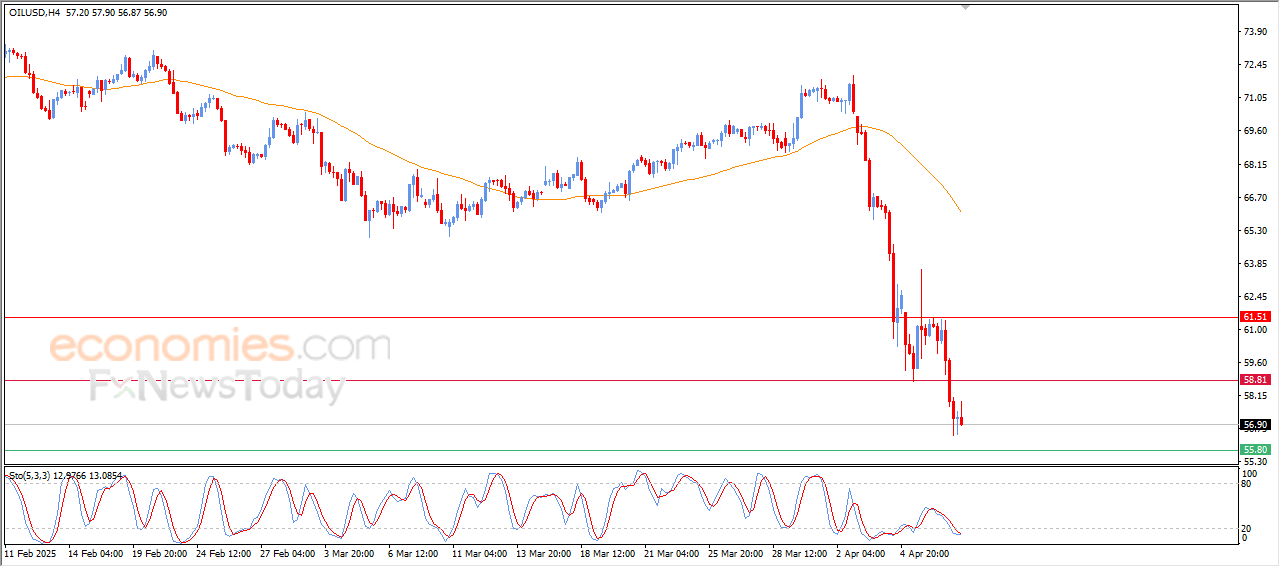
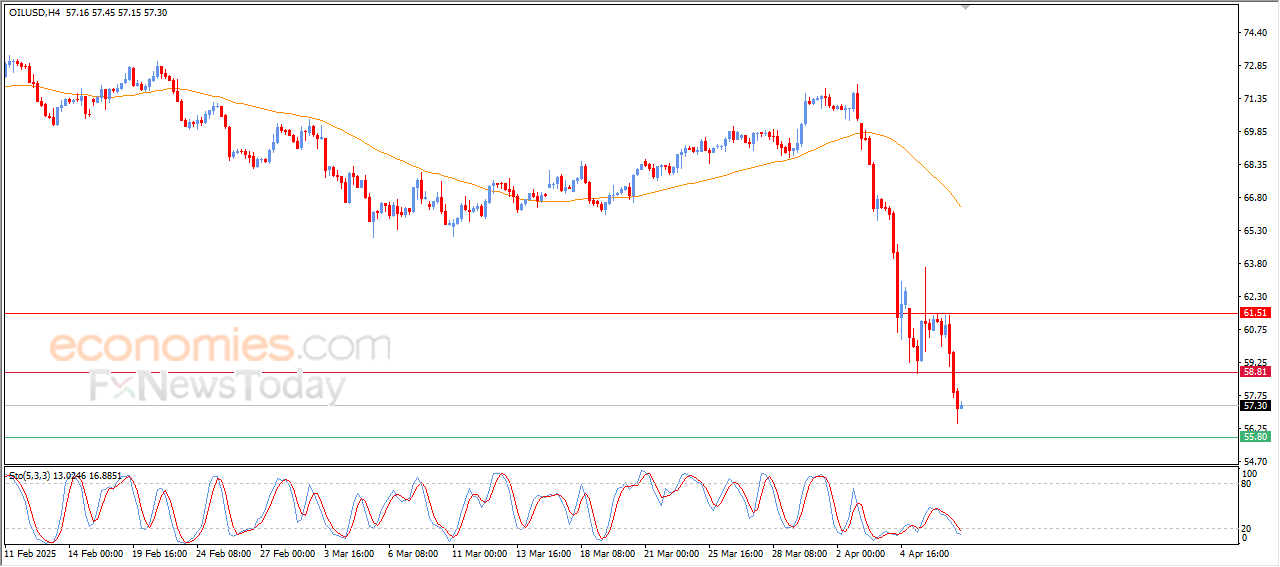
Crude oil prices: Following Donald Trump’s tariffs uncertainty and Saudi Arabia’s rate cuts, crude oil prices dropped to more than four years low on Wednesday. WTI crude oil price oscillates around the $57.70 mark, logging an intraday loss of nearly 3.20% during early morning deals in the Asian stock market. Brent futures lost $2.13, or 3.39%, to $60.69 a barrel as of 0108 GMT. US West Texas Intermediate crude futures fell $2.36, or 3.96%, to $57.22. Brent reached its lowest point in March 2021, and WTI reached its lowest in February 2021. Crude oil futures contract for April expiry on the Multi Commodity Exchange (MCX) crashed 1.78% or ₹94 per barrel on Tuesday and closed at ₹5,199 per barrel.
Both benchmarks have tumbled over the five consecutive sessions since US President Donald Trump announced sweeping tariffs on most imports, sparking concerns that a global trade war would dent economic growth and hit fuel demand. The US will impose a 104% tariff on China from 12:01 a.m. EDT (0401 GMT) on Wednesday, a White House official said in a Tuesday briefing. The tariffs will increase by 50% after Beijing failed to lift its retaliatory tariffs on US goods by a noon deadline on Tuesday set by Trump.
According to commodity market experts, crude oil prices have crashed due to demand concerns fuelled by an escalating tariff war between the US and China and rate cuts announced by Saudi Arabia. They said that crude oil prices might continue to trade red and touch the $52 per barrel mark, whereas, in the domestic market, crude oil prices may test the ₹5,025 per barrel mark on MCX.
Speaking on the reasons that are dragging crude oil prices across bourses, Anuj Gupta, Head — Commodity & Currency at HDFC Securities, said, “Oil prices fell sharply to an over four-year low in Asian trade on Wednesday as signs of a rapidly escalating US-China trade war sparked heightened concerns over a recession and weaker demand.” He said Saudi Arabia’s announcement to increase output and decrease oil prices is also a significant reason for nosediving crude oil prices.
“China’s aggressive retaliation diminishes the chances of a quick deal between the world’s two biggest economies, triggering mounting fears of global economic recession,” said Ye Lin, vice president of oil commodity markets at Rystad Energy.
“China’s 50,000 bpd to 100,000 bpd of oil demand growth is at risk if the trade war continues for longer. However, a stronger stimulus to boost domestic consumption could mitigate the losses,” she said.
Exacerbating oil’s decline was OPEC’s decision last week, which groups together the Organization of the Petroleum Exporting Countries and allies, including Russia, to hike output in May by 411,000 barrels per day. Analysts say this move is likely to push the market into surplus.
Goldman Sachs now forecasts that Brent and WTI could edge down to $62 and $58 per barrel by December 2025 and to $55 and $51 per barrel by December 2026.
Anuj Gupta of HDFC Securities said, “Crude oil prices are expected to remain under pressure. They may touch $52 per barrel in the international market, whereas they may test the ₹5,025 per barrel mark on the MCX. One should look at short positions on every rise as oil prices face hurdles at $62 per barrel in the international market and ₹5,380 per barrel on the MCX.”
(With inputs from Reuters)
Disclaimer: The views and recommendations made above are those of individual analysts or broking companies, and not of Mint. We advise investors to check with certified experts before making any investment decisions.
Gold price is looking to finally end its corrective downside early Wednesday, finding demand once again near the $2,970 region. A sustained upside in Gold price hinges on the market reaction to the reciprocal tariffs and the Minutes of the US Federal Reserve (Fed) March policy meeting.
Gold price is capitalizing on deteriorating investors’ confidence as US President Donald Trump’s global reciprocal tariffs come into effect. Markets are spooked mainly due to the whopping 104% tariffs on Chinese goods, which took effect, heightening US-China trade tensions.
The White House confirmed late Tuesday that 104% duties on imports from China would take effect after midnight on Wednesday.
Amidst looming tariff uncertainty and the increased odds of a US recession, the US Dollar (USD) sticks to its bearish momentum, allowing Gold price to find its feet. However, if the Fed Minutes indicate prudence due to risks of higher inflation, the Greenback could see a temporary relief rally. USD sellers will likely jump in in no time due to the reciprocal tariffs coming into effect.
All in all, Gold price is likely to emerge as a clear winner even if the Fed Minutes are perceived as cautious, in the wake of the US-China trade war escalation. Late Tuesday, President Trump accused China of manipulating the currency to protect against tariffs, but he remained hopeful that China would make a deal at some point.
Meanwhile, the ongoing recovery in the US Treasury bond yields could threaten the upswing in the non-yielding Gold price. But the impact could be limited amid increased dovish bets surrounding the Fed interest rate cuts.
The jump in the US Treasury bond yields could be linked to investors selling the safe-haven asset to cover losses elsewhere. Therefore, the increased bets for aggressive Fed rate cuts could soon check the yield surge.
Gold buyers are fighting back control as the 14-day Relative Strength Index (RSI) pierces the 50 level from below.
Gold price needs acceptance above the 21-day Simple Moving Average (SMA) at $3,036 on a daily closing basis for resuming the record rally.
Buyers will then look to the weekly high of $3,056, above which $3,100 will be tested.
On the flip side, a sustained break below the 50-day SMA at $2,952 will negate the near-term bullish bias, opening the door toward the $2,900 round figure.
The next relevant support levels are seen at the March 10 and 11 lows, at $2,880, and the 100-day SMA, at $2,809.
Tariffs are customs duties levied on certain merchandise imports or a category of products. Tariffs are designed to help local producers and manufacturers be more competitive in the market by providing a price advantage over similar goods that can be imported. Tariffs are widely used as tools of protectionism, along with trade barriers and import quotas.
Although tariffs and taxes both generate government revenue to fund public goods and services, they have several distinctions. Tariffs are prepaid at the port of entry, while taxes are paid at the time of purchase. Taxes are imposed on individual taxpayers and businesses, while tariffs are paid by importers.
There are two schools of thought among economists regarding the usage of tariffs. While some argue that tariffs are necessary to protect domestic industries and address trade imbalances, others see them as a harmful tool that could potentially drive prices higher over the long term and lead to a damaging trade war by encouraging tit-for-tat tariffs.
During the run-up to the presidential election in November 2024, Donald Trump made it clear that he intends to use tariffs to support the US economy and American producers. In 2024, Mexico, China and Canada accounted for 42% of total US imports. In this period, Mexico stood out as the top exporter with $466.6 billion, according to the US Census Bureau. Hence, Trump wants to focus on these three nations when imposing tariffs. He also plans to use the revenue generated through tariffs to lower personal income taxes.
The next lower target is the 78.6% retracement at $3.40. However, there is a better-defined potential support zone from $3.08 to $2.98, consisting of the initial 100% target for a falling ABCD pattern and the 61.8% Fibonacci retracement of the upswing beginning in August 2024. Also, within that price zone is the next lower trend indicator, the 200-Day MA, now at $3.04, and a prior swing high and symmetrical triangle breakout level of $3.02.
The monthly chart (not shown) is supportive of further downside as a one-month bearish reversal triggered this month. Support from March is at $3.16 and there could be some signs of support around the price level. Moreover, another bearish monthly signal would be generated on a drop below March. A bearish monthly signal especially increases the chance that the lower potential support level noted above may be reached before the current bearish correction is complete.
If natural gas ends up falling below $2.98 and staying below it, sellers may remain in charge down to the $2.77 price zone or lower. That is the 127.2% extended target for the falling ABCD pattern. A daily close below $2.98 would signal a bearish reversal of the advance that began from the August 2024 interim swing low.
The late-January higher swing low at $2.99 is part of the price structure of that trend therefore a drop below that price level would violate the integrity of the uptrend. Additionally, there appears to be potential support around a long-term uptrend line (purple) originating from the April 2024 swing low. It identifies the next lower trend support area below the 200-Day MA. In general, once one trendline is broken, the next lower line becomes a potential target.
For a look at all of today’s economic events, check out our economic calendar.
Platinum price provided a new positive close above the support base at $895.00, increasing the chances for activating the bullish rally, especially, that stochastic is attempting to provide positive momentum by surpassing the oversold level.
We expect platinum price’s rally toward $935.00, and the continuation of the positivity will reinforce the chances for attacking the extra barrier at $950.00, while reaching below the mentioned support and holding below it will cancel the bullish suggestion, to begin forming strong bearish waves that might push it to decline toward $880.00 and $858.00.
The expected trading range for today is between $905.00 and $950.00
Trend forecast: Bullish
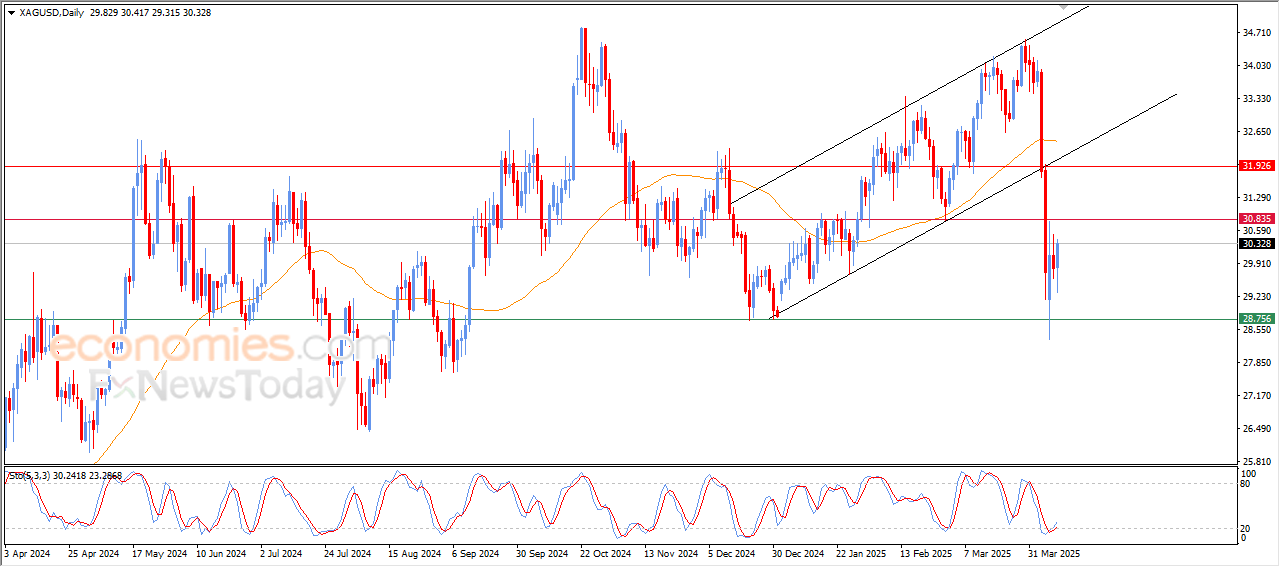
The Silver price (XAG/USD) recovers some lost ground to around $29.85 during the Asian trading hours on Wednesday. Analysts believe the recent correction could be a setup for a strong rebound amid rising trade tensions and recession fears. Traders brace for the FOMC Minutes, which are due later on Wednesday.
US President Donald Trump said late Tuesday that he wasn’t considering a pause on his plan to impose sweeping additional tariffs on dozens of countries despite contact from trade partners seeking to avoid the levies. However, he hinted that he could be open to some negotiations.
Trump’s remarks came after his top officials sent signals about the administration’s willingness to engage with trade partners, with a 10% tariff already in place and targeted retaliatory import tariffs scheduled for Wednesday. This uncertainty has spurred global market volatility and boosted the safe-haven demand, supporting the Silver price.
Additionally, industrial demand, especially from new-age industries like EVs and solar energy, provides some support to the white metal. Gains are also expected in the consumer electronics market, as the development of artificial intelligence systems will continue to boost product offerings.
Traders will keep an eye on the FOMC Meeting Minutes on Wednesday. This report could offer insight into the Federal Reserve’s (Fed) stance on monetary policy. Any hawkish remarks from the Fed officials could lift the Greenback and weigh on the USD-denominated commodity price in the near term.
Silver is a precious metal highly traded among investors. It has been historically used as a store of value and a medium of exchange. Although less popular than Gold, traders may turn to Silver to diversify their investment portfolio, for its intrinsic value or as a potential hedge during high-inflation periods. Investors can buy physical Silver, in coins or in bars, or trade it through vehicles such as Exchange Traded Funds, which track its price on international markets.
Silver prices can move due to a wide range of factors. Geopolitical instability or fears of a deep recession can make Silver price escalate due to its safe-haven status, although to a lesser extent than Gold’s. As a yieldless asset, Silver tends to rise with lower interest rates. Its moves also depend on how the US Dollar (USD) behaves as the asset is priced in dollars (XAG/USD). A strong Dollar tends to keep the price of Silver at bay, whereas a weaker Dollar is likely to propel prices up. Other factors such as investment demand, mining supply – Silver is much more abundant than Gold – and recycling rates can also affect prices.
Silver is widely used in industry, particularly in sectors such as electronics or solar energy, as it has one of the highest electric conductivity of all metals – more than Copper and Gold. A surge in demand can increase prices, while a decline tends to lower them. Dynamics in the US, Chinese and Indian economies can also contribute to price swings: for the US and particularly China, their big industrial sectors use Silver in various processes; in India, consumers’ demand for the precious metal for jewellery also plays a key role in setting prices.
Silver prices tend to follow Gold’s moves. When Gold prices rise, Silver typically follows suit, as their status as safe-haven assets is similar. The Gold/Silver ratio, which shows the number of ounces of Silver needed to equal the value of one ounce of Gold, may help to determine the relative valuation between both metals. Some investors may consider a high ratio as an indicator that Silver is undervalued, or Gold is overvalued. On the contrary, a low ratio might suggest that Gold is undervalued relative to Silver.
Traders will keep an eye on the FOMC Meeting Minutes on Wednesday. This report could offer insight into the Federal Reserve’s (Fed) stance on monetary policy. Any hawkish remarks from the Fed officials could lift the Greenback and weigh on the USD-denominated commodity price in the near term.
The price of Bitcoin (BTCUSD) continued to decline in its recent intraday trading, settling below the key support level of $77,000, confirming its break. This increases the possibility of further price decline, especially as it trades near a descending minor trendline within the main bearish trend in the short term, with additional confirming signals from the Relative Strength Index indicators (RSI), despite reaching excessive oversold areas.
To get our more detailed analysis and 100% accurate signals provided by Best Trading Signal, subscribe to Economies.com VIP Club through the link below!
As shown on the chart, there have been two previous large downswings since the 2023 peak of $95.50. The first (A) found a bottom after a 29% price correction and the second ended after a 25.3% decline. As of this week’s low, the current bearish correction has crude oil down by 28%. Once there is symmetry between the swings, there is a chance for signs of support and the completion of the correction. It is another piece of technical evidence identifying a potential short-term low in crude oil.
The relative strength index (RSI) has fallen to oversold levels and the test of support near the lower end of the trend channel is also a sign that the price of crude may be oversold. Nonetheless, selling pressure remains as the closing price today will be a new low for the bearish correction.
I decisive advance above Tuesday’s high of $61.88 would be needed for signs of strength that may continue. Once the lower blue channel line is exceeded to the upside the 38.2% Fibonacci retracement at $63.57 becomes a target. Also, Monday’s high at $64.05 is close by. If strength can be maintained above that level, the next higher target zone is around previous price support and the 50% retracement level at $65.41 to $65.27, respectively.
Since that price zone may have greater significance given the previous long-term support level (now resistance), it looks like there is a good chance it is reached if there is a bullish reversal before new lows. Then, after the 50% level, the 61.8% Fibonacci retracement at $67.37 and the 20-Day MA, now at $67.69, become the next upside target.
On the downside, the next lower price zone identified for potential support is from $57.21 to $56.37. Crude is well on its way to reaching the price zone and therefore it may do so, and it may be soon.
The inside day pattern may complete as a bearish doji shooting start candlestick pattern. Although that pattern is typically more reliable at market tops, it still reflects sellers being in control for the day, as the day’s closing price is set to be near the lows of the day. Therefore, a decline below $2,975 will trigger a breakdown of the inside day shooting star pattern.
Gold has held up better than many assets during recent global market volatility as it has only fallen by 6.7% and it remains above the 50-Day MA. Although dropping below the rising trendline and 20-Day MA are signs of weakness, the relationship to the 50-Day line is now key support. If gold remains above the 50-Day MA, it has a chance for the advance to continue. But a decisive decline below the 50-Day line could change that.
Lower potential support levels that are below the 50-Day line, include a 78.6% retracement level at $2,904, a 50% retracement of a larger swing at $2,875, and a prior interim swing low at $2,833. Those price areas can be watched for possible support along with the next lower long-term uptrend line (purple). If the 50-Day MA fails as support, the next trend indicator is the purple uptrend line, and therefore it has a good chance of being reached if gold drops below and then stays below the 50-Day MA.
On the upside, a one-day bullish reversal above today’s high of $3,023 may lead to a test of resistance around the 20-Day MA at $3,036. Then there is Monday’s high of $3,055. Gold would need to trade above and stay above $2,023 before it has a chance to challenge recent highs.
For a look at all of today’s economic events, check out our economic calendar.