The main tag of Gold Price Articles.
You can use the search box below to find what you need.
[wd_asp id=1]
The main tag of Gold Price Articles.
You can use the search box below to find what you need.
[wd_asp id=1]
Despite a drop in the U.S. natural gas rig count—down seven last week to just 96—output remains strong. Lower-48 dry gas production averaged 106.4 Bcf/d on Friday, up over 4% from a year ago. This persistent output is meeting softening demand head-on. Industrial and residential usage remains subdued, and power burn, while stable, has yet to show the typical seasonal ramp-up. The result is a market with more supply than it currently needs, particularly in the absence of weather-related demand spikes.
Yes. The EIA reported a 29 Bcf injection into storage for the week ending March 28, well above the five-year average draw for that period. While inventories are still 21.5% lower than last year and 4.3% below the five-year norm, the size of the early injection signaled that mild weather and excess supply are beginning to rebuild stockpiles earlier than expected. This has added to the near-term bearish tone, especially as traders focus on the potential for larger-than-usual builds in the coming weeks.
LNG exports remain a bright spot, with flows to U.S. export terminals holding near 15.5 Bcf/d. While down slightly from the prior week, they continue to support baseline demand. Longer term, President Trump’s move to lift restrictions on LNG export project approvals has reactivated a backlog of infrastructure proposals. If even a portion of these projects moves forward, it would meaningfully increase export capacity and help balance domestic oversupply. For now, however, the export story is more supportive for long-term pricing than for the current supply-demand mismatch.
The short-term outlook for natural gas remains bearish. Weaker weather-driven demand, strong production, and early-season storage builds are tilting the market toward oversupply. Unless colder weather unexpectedly returns or LNG demand accelerates, prices may continue to face downward pressure in the week ahead.
Spence copper mine in the North of Chile. (Credit: Consejo Minero)
Chile, the world’s largest producer of copper, is preparing to slash its official price estimate for 2025, the Wall Street Journal reported on Saturday.
The Chilean government will cut the estimated average price to $3.90 to $4 a pound from a current projection for the year of $4.25 a pound, the WSJ said, citing a person familiar with the preliminary calculations.
Chile will publish the revised price estimate at the end of April, the newspaper said.
In February, Chile’s state copper commission, Cochilco, held its 2025 price forecast steady at $4.25 after raising it from $3.85 in May 2024.
The commission also extended the $4.25 forecast for 2026 and said it expected copper prices to remain over $4.00 a pound for the next decade.
Commodities prices including oil and other goods fell this week after new US tariffs fueled fears of a global recession.
(By Rishabh Jaiswal; Editing by Cynthia Osterman)
However, this type of pressure is viewed as mechanical rather than sentiment-driven. Gold remains up over 15% this year, supported by record central bank buying, strong institutional interest, and ETF inflows. The pullback may prove temporary unless supported by fresh macro shifts.
The underlying drivers of the rally are unchanged. Allianz’s Mohamed El-Erian now puts U.S. recession odds at 50%, while Goldman Sachs raised its estimate to 35%. Fed Chair Jerome Powell warned that Trump’s tariffs are “larger than expected,” with fallout likely to include both slower growth and elevated inflation. With global supply chains under renewed stress, gold’s role as a hedge remains central.
Traders will be glued to Wednesday’s FOMC minutes and Thursday’s CPI report. If the Fed minutes show internal debate or reluctance to ease aggressively, that could temper some of the rate-cut enthusiasm priced into markets. Conversely, if CPI surprises to the upside, it would reinforce inflation risks and justify gold’s safe-haven appeal—even if policy remains cautious. On Friday, consumer sentiment data could further illuminate how recent market stress is filtering through to inflation expectations.
President Trump’s announcement of sweeping reciprocal tariffs and targeted measures against China triggered a reassessment of global trade flows and manufacturing prospects. Semiconductor tariffs are particularly bearish for silver, given its widespread industrial applications. China’s response—slapping a 34% levy on all American goods—adds to fears of a drawn-out trade war. The result has been a sharp drop in global demand expectations, particularly in Asia and Europe, two major industrial buyers of silver.
A violent decline in equities—highlighted by a 2,000+ point drop in Dow futures—unleashed margin call selling across the board. Silver was hit especially hard as investors were forced to exit positions to cover losses elsewhere. While gold also saw liquidation, its safe-haven bid helped cushion losses. For silver, with weaker monetary demand and no central bank support, the impact was deeper and more sustained.
Silver’s weakness was compounded by a rising U.S. dollar and an uptick in real yields. Treasury markets stabilized after strong jobs data, pushing the 10-year yield back near 3.88%. The dollar gained as expectations for aggressive Fed cuts were scaled back. Traders now turn their attention to this week’s Fed minutes and Thursday’s CPI report, both of which could reshape policy expectations. If the minutes signal hesitation to ease, or if CPI comes in hot, silver could face further headwinds from tighter financial conditions and a stronger dollar.
Goldman Sachs lowered its forecast for Brent crude oil‘s average price this year by 5.5 per cent to $69 per barrel and for US West Texas Intermediate (WTI) prices by 4.3 per cent to $66 per barrel, citing the risks of higher supply by the Organisation of Petroleum Exporting Countries and its allies (OPEC+) and the global tariff-led trade war, likely triggering a recession.
The Wall Street brokerage cut its 2026 average price forecast for Brent by nine per cent to $62 and WTI by 6.3 per cent to $59. It warned that the new estimates could be lowered. “The risks to our reduced oil price forecast are to the downside, especially for 2026, given growing risks of recession and to a lesser extent of higher OPEC+ supply,” said Goldman analysts.
Brent crude was priced at $69.59 a barrel on Friday, while WTI was at $66.39. Crude prices posted their biggest percentage drops since 2022 on Thursday after US President Donald Trump slapped reciprocal tariffs on many countries and eight OPEC+ members unexpectedly advanced their plan to phase out production cuts by boosting output in May.
The latter, said Goldman, showed OPEC’s flexibility to rapidly implement large output hikes, diminishing the likelihood of a short-term price boost from lower supply. The brokerage said it now expects oil demand to grow by only 600,000 barrels per day (bpd) this year, down from its previous forecast of 900,000 bpd, and to increase by 700,000 bpd in 2026.
Crude oil prices crashed seven per cent on Friday to settle at their lowest in over three years as China ramped up tariffs on US goods, escalating a trade war that has led investors to price in a higher probability of recession.
China, the world’s top oil importer, announced it will impose additional tariffs of 34 per cent on all US goods from April 10. Nations have readied retaliation after Trump raised tariff to their highest in more than a century.
Commodities, including natural gas, soybeans and gold, also dived while global stock markets tumbled. Investment bank JPMorgan said it now sees a 60 per cent chance of a global economic recession by year-end, up from 40 per cent.
Global benchmark Brent futures settled $4.56, or 6.5 per cent, lower at $65.58 a barrel, while US WTI crude futures lost $4.96, or 7.4 per cent, to end at $61.99. At the session low, Brent fell to $64.03, and WTI hit $60.45, its lowest in four years. For the week, Brent crude was down 10.9 per cent, its biggest weekly loss in percentage terms in a year and a half, while WTI posted its biggest decline in two years with a drop of 10.6 per cent.
“Donald Trump has also threatened to impose secondary tariffs on Russian oil, and he toughened sanctions on Iran as part of his administration’s “maximum pressure” campaign to cut its exports,” said Prathamesh Mallya, DVP- Research, Non-Agri Commodities and Currencies, Angel One Ltd
Adding to the complex global supply picture, Russia, the world’s second-largest oil exporter, imposed restrictions on another major oil export route, suspending a mooring at the Black Sea port of Novorossiisk a day after restricting loadings from a key Caspian pipeline.
“Russia produces about nine million barrels of oil a day, or just under a tenth of global production. Its ports also ship oil from neighbouring Kazakhstan. Crude prices will likely trade lower after Trump announced reciprocal tariffs on trading partners, stoking concerns that a global trade war may dampen demand for crude,” added Mallya.
Further pressuring oil prices, the OPEC+ advanced plans for output increases. The group aims to return 411,000 barrels per day (bpd) to the market in May, up from the planned 135,000 bpd. HSBC also trimmed its 2025 global oil demand forecast from one million bpd to 0.9 million bpd, citing tariffs and OPEC+ supply.
A Russian court’s ruling that the Caspian Pipeline Consortium’s (CPC) Black Sea export terminal facilities should not be suspended also pressured prices lower. That decision could avert a fall in Kazakhstan’s oil production and supplies.
Imports of oil, gas and refined products were exempted from Trump’s sweeping new tariffs. Still, the policies could stoke inflation, slow economic growth, and intensify trade disputes, weighing on crude oil prices.
“A sharp tariff hike on China spooked energy markets, leading to oil’s biggest single-day fall in three years. Rising OPEC+ output and weaker demand due to trade tariffs may keep prices under pressure. We expect prices to remain volatile. Oil has support at $65.50-64.80, and resistance is at $66.90-67.60. In INR, it has support at ₹5,655-5,590 while resistance at ₹5,790-5,850,” said Rahul Kalantri, VP of Commodities, Mehta Equities Ltd.
Disclaimer: The views and recommendations provided in this analysis are those of individual analysts or broking companies, not Mint. We strongly advise investors to consult with certified experts, consider individual risk tolerance, and conduct thorough research before making investment decisions, as market conditions can change rapidly, and individual circumstances may vary.
Chile, the world’s largest producer of copper, is preparing to slash its official price estimate for 2025, the Wall Street Journal reported on Saturday.
The Chilean government will cut the estimated average price to $3.90 to $4 a pound from a current projection for the year of $4.25 a pound, the WSJ said, citing a person familiar with the preliminary calculations.
Chile will publish the revised price estimate at the end of April, the newspaper said.
In February, Chile’s state copper commission, Cochilco, held its 2025 price forecast steady at $4.25 after raising it from $3.85 in May 2024.
The commission also extended the $4.25 forecast for 2026 and said it expected copper prices to remain over $4.00 a pound for the next decade.
Commodities prices including oil and other goods fell this week after new U.S. tariffs fueled fears of a global recession.
Silver price plummeted on Friday as financial market turmoil continued for the third straight day, following US President Donald Trump’s decision to impose reciprocal tariffs. Consequently, China retaliated, sparking fears of a global economic slowdown. The XAG/USD trades at $29.55, sinking more than 7%.
On its way lower, Silver fell below the 100- and 200-day Simple Moving Averages (SMAs) on Friday, indicating a strong sell-off, once the grey metal cleared $31.39 and $30.86, respectively. Although the Relative Strength Index (RSI) turned bearish and oversold, due to the aggressiveness of the move, XAG/USD could continue to edge lower.
If XAG/USD falls below $29.00, this could expose the December 19 swing low of $28.74. Once surpassed, the next support would be the September 3 low of $27.71. Conversely, if XAG/USD climbs past $30.00, buyers could be poised to challenge the 200-day SMA at $30.86, followed by the $31 mark.
Silver is a precious metal highly traded among investors. It has been historically used as a store of value and a medium of exchange. Although less popular than Gold, traders may turn to Silver to diversify their investment portfolio, for its intrinsic value or as a potential hedge during high-inflation periods. Investors can buy physical Silver, in coins or in bars, or trade it through vehicles such as Exchange Traded Funds, which track its price on international markets.
Silver prices can move due to a wide range of factors. Geopolitical instability or fears of a deep recession can make Silver price escalate due to its safe-haven status, although to a lesser extent than Gold’s. As a yieldless asset, Silver tends to rise with lower interest rates. Its moves also depend on how the US Dollar (USD) behaves as the asset is priced in dollars (XAG/USD). A strong Dollar tends to keep the price of Silver at bay, whereas a weaker Dollar is likely to propel prices up. Other factors such as investment demand, mining supply – Silver is much more abundant than Gold – and recycling rates can also affect prices.
Silver is widely used in industry, particularly in sectors such as electronics or solar energy, as it has one of the highest electric conductivity of all metals – more than Copper and Gold. A surge in demand can increase prices, while a decline tends to lower them. Dynamics in the US, Chinese and Indian economies can also contribute to price swings: for the US and particularly China, their big industrial sectors use Silver in various processes; in India, consumers’ demand for the precious metal for jewellery also plays a key role in setting prices.
Silver prices tend to follow Gold’s moves. When Gold prices rise, Silver typically follows suit, as their status as safe-haven assets is similar. The Gold/Silver ratio, which shows the number of ounces of Silver needed to equal the value of one ounce of Gold, may help to determine the relative valuation between both metals. Some investors may consider a high ratio as an indicator that Silver is undervalued, or Gold is overvalued. On the contrary, a low ratio might suggest that Gold is undervalued relative to Silver.
Important DisclaimersThe content provided on the website includes general news and publications, our personal analysis and opinions, and contents provided by third parties, which are intended for educational and research purposes only. It does not constitute, and should not be read as, any recommendation or advice to take any action whatsoever, including to make any investment or buy any product. When making any financial decision, you should perform your own due diligence checks, apply your own discretion and consult your competent advisors. The content of the website is not personally directed to you, and we does not take into account your financial situation or needs.The information contained in this website is not necessarily provided in real-time nor is it necessarily accurate. Prices provided herein may be provided by market makers and not by exchanges.Any trading or other financial decision you make shall be at your full responsibility, and you must not rely on any information provided through the website. FX Empire does not provide any warranty regarding any of the information contained in the website, and shall bear no responsibility for any trading losses you might incur as a result of using any information contained in the website.The website may include advertisements and other promotional contents, and FX Empire may receive compensation from third parties in connection with the content. FX Empire does not endorse any third party or recommends using any third party’s services, and does not assume responsibility for your use of any such third party’s website or services.FX Empire and its employees, officers, subsidiaries and associates, are not liable nor shall they be held liable for any loss or damage resulting from your use of the website or reliance on the information provided on this website.Risk DisclaimersThis website includes information about cryptocurrencies, contracts for difference (CFDs) and other financial instruments, and about brokers, exchanges and other entities trading in such instruments. Both cryptocurrencies and CFDs are complex instruments and come with a high risk of losing money. You should carefully consider whether you understand how these instruments work and whether you can afford to take the high risk of losing your money.FX Empire encourages you to perform your own research before making any investment decision, and to avoid investing in any financial instrument which you do not fully understand how it works and what are the risks involved.
Thursday’s breakdown below the 50-day moving average at $32.52 marked a major technical reversal. Friday’s continuation move sliced through the 50% Fibonacci retracement at $31.81, leading to a test of the 200-day moving average at $30.89. A close below that longer-term level would open the door for a deeper retracement toward $28.40. Resistance on the upside is now clearly defined at $31.81 and $32.53, both of which must be reclaimed to regain bullish footing.
Silver’s weakness is closely tied to forced selling across asset classes. As U.S. equity markets plummet—highlighted by a 2,000+ point drop in Dow futures over two sessions—margin calls are spilling into metals. Gold, which hit record highs Thursday, also saw liquidation pressure driven by margin demands and a bearish reversal pattern. These forced exits are compounding silver’s technical damage, dragging prices lower despite ongoing macro tailwinds like elevated inflation and Fed uncertainty.
Traders are also reacting to the latest tariff escalation, which threatens to further dampen global demand. The U.S. has implemented sweeping reciprocal tariffs affecting over 180 countries, prompting China to respond with a 34% levy on all American goods. These trade tensions are fueling risk-off flows and heightening fears of a global recession, with JPMorgan now assigning a 60% probability of a U.S. downturn. Weakening GDP forecasts and falling Treasury yields (10-year now at 3.882%) confirm the flight to safety and deteriorating sentiment.
While Friday’s payroll report showed robust job creation and stable wage growth, it has done little to counter the bearish mood. Traders remain focused on liquidity stress, softening real yields, and reduced Fed cut expectations. El-Erian’s revised call for potentially just one rate cut this year removes a key pillar of support for precious metals and leaves silver exposed in the near term.
With silver breaking key support levels and macro stress intensifying, the short-term outlook remains bearish. A failure to hold the 200-day moving average at $30.89 could accelerate the downside move toward $28.40.
Unless the metal reclaims resistance above $32.53, sellers are in control. Traders should prepare for continued volatility as recession fears, equity market stress, and policy uncertainty remain front and center.
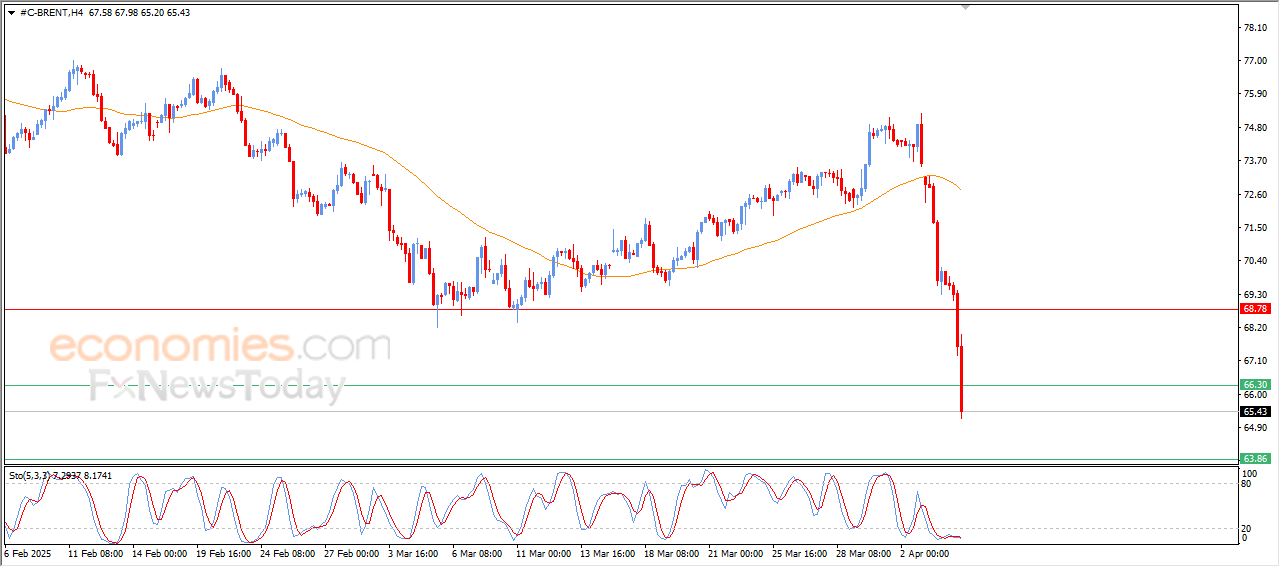
US crude oil price extended its losses in a free fall in the intraday levels, amid the dominance of the main downward trend, with the price breaching the current support of $63.10, as negative signals emerged from the Stochastic despite settling at oversold levels, indicating the strength of the selling momentum.
To get our more detailed analysis and 100% accurate signals provided by Best Trading Signal, subscribe to Economies.com VIP Club through the link below!