The main tag of Gold Price Articles.
You can use the search box below to find what you need.
[wd_asp id=1]
The main tag of Gold Price Articles.
You can use the search box below to find what you need.
[wd_asp id=1]
Silver price (XAG/USD) wobbles around $34.00 in Monday’s European session. The white metal trades flat as investors have sidelined to have a clear view on global economic outlook, with United States (US) President Donald Trump to unveil reciprocal tariffs on Wednesday.
Donald Trump is set to announce reciprocal levies on so-called “Liberation Day” after which tariffs be equivalent charged by other nations on the US for same products. The impact of reciprocal tariffs is expected to be significant on the global economic growth. The appeal of precious metals, such as Silver, increases amid heightening global economic tensions.
Investors expect Trump tariffs will also weaken the US economic growth, given that the impact of higher tariffs will be borne by US importers. This will also result in a resurgence in inflationary pressures.
Fears of US economic risks and accelerating price pressures in the near term have forced federal Reserve (Fed) officials to maintain a restrictive monetary policy guidance. On Friday, San Francisco Fed Bank President Mary Daly expressed that her confidence is easing in her expectations that there will be two interest rate cuts this year. Her confidence on two interest rate cuts this year shaken after the release of the US core Personal Consumption Expenditure Price Index (PCE) data for February, which accelerated at a faster-than-expected pace of 2.8% compared to estimates of 2.7% and the former release of 2.6%.
Historically, firm expectations for the Fed’s higher-for-longer interest rate stance weigh on non-yielding assets, such as Silver.
Silver price advances toward the flat border of the Ascending Triangle chart pattern formation on the daily timeframe near the October 22 high of $34.87. The upward-sloping border of the above-mentioned chart pattern is placed from the August 8 low of $26.45. Technically, the Ascending Triangle pattern indicates indecisiveness among market participants.
The 20-day Exponential Moving Average (EMA) near $33.30 continues to provide support to the Silver price.
The 14-day Relative Strength Index (RSI) rebounds above 60.00, suggesting a resurgence in bullish momentum.
Looking down, the March 6 high of $32.77 will act as key support for the Silver price. While, the October 22 high of $34.87 will be the major barrier.
Silver is a precious metal highly traded among investors. It has been historically used as a store of value and a medium of exchange. Although less popular than Gold, traders may turn to Silver to diversify their investment portfolio, for its intrinsic value or as a potential hedge during high-inflation periods. Investors can buy physical Silver, in coins or in bars, or trade it through vehicles such as Exchange Traded Funds, which track its price on international markets.
Silver prices can move due to a wide range of factors. Geopolitical instability or fears of a deep recession can make Silver price escalate due to its safe-haven status, although to a lesser extent than Gold’s. As a yieldless asset, Silver tends to rise with lower interest rates. Its moves also depend on how the US Dollar (USD) behaves as the asset is priced in dollars (XAG/USD). A strong Dollar tends to keep the price of Silver at bay, whereas a weaker Dollar is likely to propel prices up. Other factors such as investment demand, mining supply – Silver is much more abundant than Gold – and recycling rates can also affect prices.
Silver is widely used in industry, particularly in sectors such as electronics or solar energy, as it has one of the highest electric conductivity of all metals – more than Copper and Gold. A surge in demand can increase prices, while a decline tends to lower them. Dynamics in the US, Chinese and Indian economies can also contribute to price swings: for the US and particularly China, their big industrial sectors use Silver in various processes; in India, consumers’ demand for the precious metal for jewellery also plays a key role in setting prices.
Silver prices tend to follow Gold’s moves. When Gold prices rise, Silver typically follows suit, as their status as safe-haven assets is similar. The Gold/Silver ratio, which shows the number of ounces of Silver needed to equal the value of one ounce of Gold, may help to determine the relative valuation between both metals. Some investors may consider a high ratio as an indicator that Silver is undervalued, or Gold is overvalued. On the contrary, a low ratio might suggest that Gold is undervalued relative to Silver.
Natural gas has broken decisively above a months-long descending trendline, with prices pushing through both the 50 EMA ($3.974) and 200 EMA ($3.937). The breakout is supported by a bullish ABCD harmonic pattern completing near $3.755, marking a strong inflection point.
Price is now trading comfortably above $4.00, with momentum accelerating toward the next key resistance at $4.228, followed by $4.416. This move confirms the end of the recent consolidation phase and suggests a shift in sentiment.
A sustained hold above $4.00 strengthens the bullish case, particularly with both EMAs now trending upward. Should prices dip, immediate support rests at $3.938, then $3.755—the breakout level and harmonic support.
With volume increasing on the breakout and structure aligning, bulls appear to have regained control. Natural gas breaks out above trendline and key EMAs. Bullish above $4.00, targeting $4.228 and $4.416. Pullbacks may attract buyers near $3.938.
Even as the Stochastic continues to send out negative signals, as the price holds its ground above $5.00, it underpins the upward trend, however the price might engage in some sideways trading to gather enough momentum and rush towards $5.150, then target the major resistance at $5.340.
However, a breach of $5.00 would send the price towards more correctional negative trades towards $4.9200, then $4.8100.
Expected trading range today is between $5.000 and
$5.1500.
Today’s price forecast: Bullish
The Silver price (XAG/USD) attracts some buyers to around $34.35 during the early European session on Monday. Potential trade wars and ongoing geopolitical tensions boost the safe-haven flows, benefitting the white metal.
Traders are worried ahead of a new round of reciprocal levies that the White House is due to announce on Wednesday. Trump said late Sunday that the administration is hurrying to determine the specifics of its new tariff agenda ahead of its self-imposed deadline of Wednesday, considering possibilities after promising to remake the American economy with a slew of new levies. Aggressive tariff policies could exert some selling pressure on the Greenback and lift the USD-denominated commodity price in the near term.
Additionally, strong industrial demand, especially from new-age industries like EVs and solar energy, creates tailwinds for the white metal. Gains are also expected in the consumer electronics market, as the development of artificial intelligence systems will continue to boost product offerings.
The US ISM Manufacturing Purchasing Managers Index (PMI) for March will be in the spotlight on Tuesday. In case of a stronger-than-expected outcome, this could underpin the Greenback and cap the upside for the Silver price.
Silver is a precious metal highly traded among investors. It has been historically used as a store of value and a medium of exchange. Although less popular than Gold, traders may turn to Silver to diversify their investment portfolio, for its intrinsic value or as a potential hedge during high-inflation periods. Investors can buy physical Silver, in coins or in bars, or trade it through vehicles such as Exchange Traded Funds, which track its price on international markets.
Silver prices can move due to a wide range of factors. Geopolitical instability or fears of a deep recession can make Silver price escalate due to its safe-haven status, although to a lesser extent than Gold’s. As a yieldless asset, Silver tends to rise with lower interest rates. Its moves also depend on how the US Dollar (USD) behaves as the asset is priced in dollars (XAG/USD). A strong Dollar tends to keep the price of Silver at bay, whereas a weaker Dollar is likely to propel prices up. Other factors such as investment demand, mining supply – Silver is much more abundant than Gold – and recycling rates can also affect prices.
Silver is widely used in industry, particularly in sectors such as electronics or solar energy, as it has one of the highest electric conductivity of all metals – more than Copper and Gold. A surge in demand can increase prices, while a decline tends to lower them. Dynamics in the US, Chinese and Indian economies can also contribute to price swings: for the US and particularly China, their big industrial sectors use Silver in various processes; in India, consumers’ demand for the precious metal for jewellery also plays a key role in setting prices.
Silver prices tend to follow Gold’s moves. When Gold prices rise, Silver typically follows suit, as their status as safe-haven assets is similar. The Gold/Silver ratio, which shows the number of ounces of Silver needed to equal the value of one ounce of Gold, may help to determine the relative valuation between both metals. Some investors may consider a high ratio as an indicator that Silver is undervalued, or Gold is overvalued. On the contrary, a low ratio might suggest that Gold is undervalued relative to Silver.
Gold price continues to rally in Asian trading on Monday, marking another record high well above the $3,100 mark. Gold buyers remain undeterred due to heightened fears of a potential global trade war and its economic repercussions.
The buying interest in the Gold price remains unabated, with markets scurrying for safety in the traditional store of value amid speculations surrounding US President Donald Trump’s tariffs plans on ‘Liberation Day’, April 2.
The latest Wall Street Journal (WSJ) report highlighted that US President Donald Trump could aim for higher and broader reciprocal tariffs on Wednesday, driving riskier assets into a tailspin while bolstering the ultimate safe-haven Gold price.
“Advisers have considered imposing global tariffs of up to 20% that would hit virtually all US trading partners,” the WSJ reported.
Markets are dreading the looming risks of a full-fledged global tariff war, which is likely to unfold after Trump’s reciprocal tariffs. This could intensify inflationary pressures, leading to stagflation.
Mounting concerns over a potential stagflation in the United States (US) are weighing heavily on the US Dollar (USD) and the US Treasury bond yields, allowing the non-yielding Gold price to clinch fresh record highs.
However, the further upside in the Gold price could be capped if traders opt to cash in on the record rally ahead of Wednesday’s tariffs announcements by Trump.
The US data-docket remains light at the start of the week, leaving the Gold price at the mercy of the broad market sentiment and Trump’s tariff expectations.
A technical sell in the Gold price also cannot be ruled out as buyers have already achieved the ascending triangle target, measured at $3,080, last Friday.
Additionally, the 14-day Relative Strength Index (RSI) is trending in the highly overbought region above 75, warranting caution for buyers.
If a correction unfolds, the immediate support is seen at the intraday low of $3,077, below which the $3,050 psychological barrier will be tested.
If the selling momentum intensifies, the March 26 low of $3,012 could come to buyers’ rescue.
Conversely, if buyers retain control, the next target on the topside is seen at the $3,150 threshold.
Fresh buying opportunities would emerge above that level, opening doors for a fresh uptrend toward the $3,200 round figure.
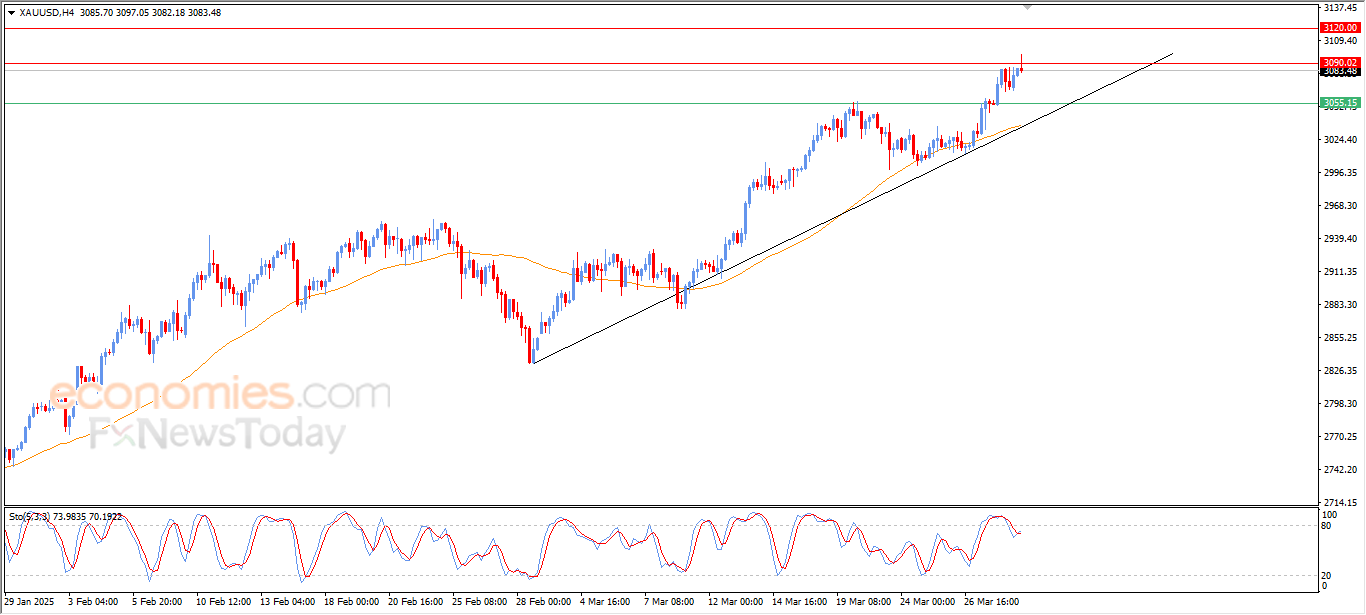
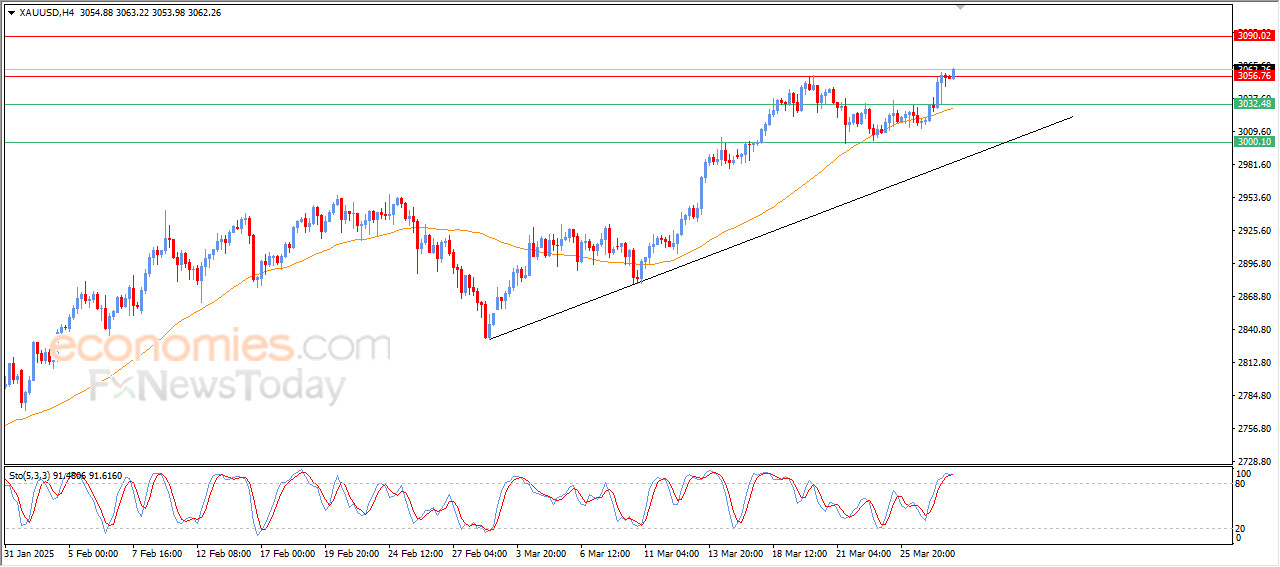
Gold price failed to maintain early gains and bounced lower, settling on a mild decline, after the current resistance of $3090 held its ground, with the price gathering positive momentum that could help it breach that resistance, while also venting off overbought saturation in the Stochastic, with negative signals emerging from it.
It comes amid the dominance of the main upward trend as the price trades alongside the secondary short-term trend line, with positive support due to trading above the 50-candle SMA.
To get our more detailed analysis and 100% accurate signals provided by Best Trading Signal, subscribe to Economies.com VIP Club through the link below!
The Gold price (XAU/USD) gains momentum to around $3,090 during the early Asian session on Monday. The precious metal maintains its uptrend near a record high amid fears of a global trade war triggered by US President Donald Trump’s latest tariffs.
Trump last week announced a 25% tariff on imported cars and light trucks set to take effect on April 3. This measure comes on top of a flat 25% tariff on steel and aluminum and Trump’s impending reciprocal tariff announcement on Wednesday. The ongoing fears related to trade wars and global economic uncertainty boost the yellow metal, a traditional safe-haven asset.
Data released by the Bureau of Economic Analysis on Friday showed that the US core Personal Consumption Expenditures (PCE) Price Index rose 0.4% MoM in February, compared to 0.3% in January. This figure came in hotter than the expectation of 0.3%. On an annual basis, the core PCE jumped 2.8% in February versus 2.7% prior (revised from 2.6%).
The report suggested sticky inflation in the US economy. Nonetheless, Trump’s aggressive trade policy raises concerns that the economy may fall into stagflation or even recession. This, in turn, undermines the Greenback and lifts the USD-denominated commodity price.
Traders will keep an eye on the US ISM Manufacturing Purchasing Managers Index (PMI) for March, which is due later on Tuesday. If the report shows a stronger-than-expected outcome, this could underpin the US Dollar (USD) and cap the upside for the Gold price.
Gold has played a key role in human’s history as it has been widely used as a store of value and medium of exchange. Currently, apart from its shine and usage for jewelry, the precious metal is widely seen as a safe-haven asset, meaning that it is considered a good investment during turbulent times. Gold is also widely seen as a hedge against inflation and against depreciating currencies as it doesn’t rely on any specific issuer or government.
Central banks are the biggest Gold holders. In their aim to support their currencies in turbulent times, central banks tend to diversify their reserves and buy Gold to improve the perceived strength of the economy and the currency. High Gold reserves can be a source of trust for a country’s solvency. Central banks added 1,136 tonnes of Gold worth around $70 billion to their reserves in 2022, according to data from the World Gold Council. This is the highest yearly purchase since records began. Central banks from emerging economies such as China, India and Turkey are quickly increasing their Gold reserves.
Gold has an inverse correlation with the US Dollar and US Treasuries, which are both major reserve and safe-haven assets. When the Dollar depreciates, Gold tends to rise, enabling investors and central banks to diversify their assets in turbulent times. Gold is also inversely correlated with risk assets. A rally in the stock market tends to weaken Gold price, while sell-offs in riskier markets tend to favor the precious metal.
The price can move due to a wide range of factors. Geopolitical instability or fears of a deep recession can quickly make Gold price escalate due to its safe-haven status. As a yield-less asset, Gold tends to rise with lower interest rates, while higher cost of money usually weighs down on the yellow metal. Still, most moves depend on how the US Dollar (USD) behaves as the asset is priced in dollars (XAU/USD). A strong Dollar tends to keep the price of Gold controlled, whereas a weaker Dollar is likely to push Gold prices up.
Silver price hits a five-month high but retreats toward the $34 figure late on Friday, as traders brace for the weekend, eyeing a busy economic schedule in the United States (US). At the time of writing, the XAG/USD pair trades at $34.03, down by over 1%.
Silver hit $34.58 earlier, before retreating as traders seem to book profits, taking risks off the table. As the grey metal falls, it has cleared the first support seen at $34.23, March 18 peak. If sellers achieve a daily close below the latter, XAG/USD could extend its losses beneath $34.00.
In that outcome, the first support would be the March 26 daily low of $33.51. Once surpassed the next stop would be $33.00. On the other hand, if Silver remains above $34.25, bulls could be poised to claim the year-to-date (YTD) high of $34.58, ahead of testing $35.00
Silver is a precious metal highly traded among investors. It has been historically used as a store of value and a medium of exchange. Although less popular than Gold, traders may turn to Silver to diversify their investment portfolio, for its intrinsic value or as a potential hedge during high-inflation periods. Investors can buy physical Silver, in coins or in bars, or trade it through vehicles such as Exchange Traded Funds, which track its price on international markets.
Silver prices can move due to a wide range of factors. Geopolitical instability or fears of a deep recession can make Silver price escalate due to its safe-haven status, although to a lesser extent than Gold’s. As a yieldless asset, Silver tends to rise with lower interest rates. Its moves also depend on how the US Dollar (USD) behaves as the asset is priced in dollars (XAG/USD). A strong Dollar tends to keep the price of Silver at bay, whereas a weaker Dollar is likely to propel prices up. Other factors such as investment demand, mining supply – Silver is much more abundant than Gold – and recycling rates can also affect prices.
Silver is widely used in industry, particularly in sectors such as electronics or solar energy, as it has one of the highest electric conductivity of all metals – more than Copper and Gold. A surge in demand can increase prices, while a decline tends to lower them. Dynamics in the US, Chinese and Indian economies can also contribute to price swings: for the US and particularly China, their big industrial sectors use Silver in various processes; in India, consumers’ demand for the precious metal for jewellery also plays a key role in setting prices.
Silver prices tend to follow Gold’s moves. When Gold prices rise, Silver typically follows suit, as their status as safe-haven assets is similar. The Gold/Silver ratio, which shows the number of ounces of Silver needed to equal the value of one ounce of Gold, may help to determine the relative valuation between both metals. Some investors may consider a high ratio as an indicator that Silver is undervalued, or Gold is overvalued. On the contrary, a low ratio might suggest that Gold is undervalued relative to Silver.
Brent crude oil price kept rising in latest intraday trading, breaching the pivotal resistance of $73.60, while buoyed by trading above the 50-candle SMA, amid the dominance of the upward correctional trend in the short term, as the price moves alongside primary and secondary trend line, indicating the strength and dominance of this trend.
To get our more detailed analysis and 100% accurate signals provided by Best Trading Signal, subscribe to Economies.com VIP Club through the link below!
Also, the second leg down in the correction generated a bullish falling wedge pattern. That might help account for the sharp runup seen today. Notice that earlier in today’s trading session the trendline and 50-Day MA were first tested as support before buyers took back control, leading to the rally.
The next decision point looks to be around the 20-Day MA, now at $4.12. That initial price target may yet be hit before the end of the day since natural gas continues to trade near the highs of the day, at the time of this writing. Other initial upside targets include the 38.2% Fibonacci retracement and a prior interim swing high at $4.26.
Given the bullish reaction following the completion of a 61.8% retracement it is possible that the corrective decline is complete. Certainly, it might be. But further evidence of strength will be needed. A daily close above the 20-Day MA would be one sign of strengthening that could lead to higher prices. But the recent interim swing high at $4.26 makes up the price structure of the recent decline as it is a lower swing high. Reclaiming that high would provide another bullish reversal signal. But keep in mind that rallies will be heading up into a consolidation zone if recent highs are approached. This could lead to further consolidation.
Finally, let’s consider the large rising trend starting from the 2024 low. It shows on the chart as a large parallel trend channel. Within the larger trend channel there are shorter trends defined by a trendline along support. Since the recent rising trendline was broken to the downside, there is the possibility that the next lower trend support line is eventually tested as it was not during the recent bearish correction. Keep that in mind if natural does eventually turn back down after reaching higher price levels.
For a look at all of today’s economic events, check out our economic calendar.