The main tag of Gold Price Articles.
You can use the search box below to find what you need.
[wd_asp id=1]
The main tag of Gold Price Articles.
You can use the search box below to find what you need.
[wd_asp id=1]
The slowing of volatility in gold has been noticeable of late and that’s particularly true if looking at the weekly chart. After a ripping up-trend started in Q1 of last year and ran clearly through the Q4 open, the past two months and a week have been less enthusiastic for bulls. But this doesn’t necessarily mean that buyers are finished as the symmetrical triangle on the below chart, when combined with the bullish trend that pushed into that formation, can be argued as a bull pennant formation. Such formations are common as an illustration of consolidation after a strong bullish move, as a combination of profit taking from prior longs and late-stage bullish press from buyers trying to bid support on pullbacks can lead to a narrowing in price action, such as we’ve seen since both the late-October and mid-November inflection points.
Normally, bull pennants are approached with aim of topside continuation. I look at the formations more neutrally, however, as prolonged consolidation doesn’t always carry the prior bias. But given the build of higher-lows after a move that priced in as much as a 40.6% gain last year, bulls can’t yet be counted out.
 Chart prepared by James Stanley; data derived from Tradingview
The 2721 level was a big spot for gold last year, helping to set swing highs in both late-November and then in December. That second inflection led to a higher-low along with a test below $2600, which then held the lows last week to allow for yet another higher-low, further substantiating the support trendline making up the triangle formation.
The bounce from the $2600 support test led to a short-term higher-high, and the pullback from that appears to be grasping to retain support around prior resistance from the $2633-$2639 zone.
This could be construed as a bullish short-term bias but it’s important to qualify that this is all taking place inside of the longer-term or bigger picture consolidation of the symmetrical triangle.
 Chart prepared by James Stanley; data derived from Tradingview
From the four-hour we can see a busy start to the week for gold prices and the most recently completed four-hour candle printed as a long-legged doji. This provides some scope of shorter-term support and resistance levels, as it was the 2650 level that seemed to deter bulls earlier in the morning, after which prices dipped down to just below 2615.
A breach of either of those prices could be construed as a short-term directional move; and for deeper support, there’s the trendline projection currently plotted around $2604, after which the $2600 level comes into the picture. For topside, a breach of $2650 opens the door for re-test of $2657, after which last week’s high comes into the picture at $2664 and that’s followed by the Fibonacci level at $2674.
 Chart prepared by James Stanley; data derived from Tradingview
— written by James Stanley, Senior Strategist
Spot Gold fell to $2,614.44 early in the American session but bounced from such a low and stabilized around its daily opening in the $2,630/40 price zone. The US Dollar (USD) started the day with a soft tone, but came under strong selling pressure mid-European session amid political headlines from the United States (US).
The Washington Post reported that Donald Trump’s transition team was working on narrowing tariffs, focusing only on key sectors deemed vital to national security, such as defence, medical supplies, and energy, narrowing the universal tariffs plan that generated concerns. Speculative interest jumped into high-yielding assets, ignoring XAU/USD.
Still, and after Wall Street’s opening, upcoming US President Donald Trump denied the headlines, saying that the story about paring back tariffs was wrong. His words boosted the USD, pushing the bright metal towards the mentioned low and putting stock markets in retreat mode.
As the dust settled, equities recovered, while the USD trimmed part of its intraday losses yet remains in the red against most major rivals. The mood remains upbeat, maintaining market players away from XAU/USD.
This week, the focus will be on US employment figures, as the country will release different figures ahead of the Nonfarm Payrolls (NFP) report, scheduled for next Friday.
The XAU/USD pair has been trading around the current level for six weeks in a row, with spikes on one side or the other being reverted, a sign investors are comfortably waiting for a powerful catalyst to justify higher highs. In the daily chart, the bright metal hovers around a flat 20 Simple Moving Average (SMA) while buyers defended the downside at around a bullish 100 SMA, now providing dynamic support at $2,624.98. Technical indicators, in the meantime, remain within negative levels, albeit with uneven directional strength, reflecting buyers’ pause.
The near-term picture suggests the bullish potential is limited. The 20, 100 and 200 SMAs converge in a tight range in the $2,640 region, rejecting advances. Finally, technical indicators have pared their slides but remain below their midlines. Gold may turn bullish if it manages to retain gains beyond the 2,665 level, where it topped in early January.
Support levels: 2,624.90 2,611.20 2,596.00
Resistance levels: 2,649.50 2,665.10 2,678.85
Silver (XAG/USD) extends Friday’s modest pullback from the vicinity of the $30.00 psychological mark and edges lower at the start of a new week. The white metal drops below the mid-$29.00s during the Asian session and now seems to have stalled its recovery from a multi-month trough touched in December.
From a technical perspective, the recent breakdown and repeated failures near the 200-day Simple Moving Average (SMA) favor bearish traders. This, along with the fact that oscillators on the daily chart are holding in negative territory, suggests that the path of least resistance for the XAG/USD is to the downside. Some follow-through selling below the $29.40 area will reaffirm the outlook and make the commodity vulnerable to weakening towards the $29.00 mark.
The downside trajectory could extend further towards the $28.75-$28.70 region, or the multi-month low, which should act as a key pivotal point. A sustained break below will set the stage for an extension of a well-established downtrend from the $35.00 neighborhood, or a multi-year peak touched in October.
On the flip side, the $30.00 mark (200-day SMA) might continue to act as an immediate strong barrier, above a bout of a short-covering could lift the XAG/USD to the next relevant hurdle near the $30.50 area. The momentum could eventually allow the white metal to reclaim the $31.00 mark and test the $31.15-$31.20 supply zone.
Silver is a precious metal highly traded among investors. It has been historically used as a store of value and a medium of exchange. Although less popular than Gold, traders may turn to Silver to diversify their investment portfolio, for its intrinsic value or as a potential hedge during high-inflation periods. Investors can buy physical Silver, in coins or in bars, or trade it through vehicles such as Exchange Traded Funds, which track its price on international markets.
Silver prices can move due to a wide range of factors. Geopolitical instability or fears of a deep recession can make Silver price escalate due to its safe-haven status, although to a lesser extent than Gold’s. As a yieldless asset, Silver tends to rise with lower interest rates. Its moves also depend on how the US Dollar (USD) behaves as the asset is priced in dollars (XAG/USD). A strong Dollar tends to keep the price of Silver at bay, whereas a weaker Dollar is likely to propel prices up. Other factors such as investment demand, mining supply – Silver is much more abundant than Gold – and recycling rates can also affect prices.
Silver is widely used in industry, particularly in sectors such as electronics or solar energy, as it has one of the highest electric conductivity of all metals – more than Copper and Gold. A surge in demand can increase prices, while a decline tends to lower them. Dynamics in the US, Chinese and Indian economies can also contribute to price swings: for the US and particularly China, their big industrial sectors use Silver in various processes; in India, consumers’ demand for the precious metal for jewellery also plays a key role in setting prices.
Silver prices tend to follow Gold’s moves. When Gold prices rise, Silver typically follows suit, as their status as safe-haven assets is similar. The Gold/Silver ratio, which shows the number of ounces of Silver needed to equal the value of one ounce of Gold, may help to determine the relative valuation between both metals. Some investors may consider a high ratio as an indicator that Silver is undervalued, or Gold is overvalued. On the contrary, a low ratio might suggest that Gold is undervalued relative to Silver.
Gold price is finding fresh demand early Monday as buyers look to regain $2,650 after correcting from three-week highs of $2,665 on Friday.
The renewed upside in Gold price could be linked to fresh optimism surrounding more stimulus coming through from China after the People’s Bank of China (PBOC) pledged over the weekend that it will step up financial support for technology innovation and consumption stimulation as part of a continued effort to boost economic growth, per Bloomberg.
Additionally, Gold buyers cheer the strong Chinese Caixin Services PMI, which shot to a seven-month high of 52.2 in December versus 51.7 expected. China is the world’s biggest Gold consumer, and any efforts by the Chinese authorities to ramp up the economic performance will likely bode well for the bright metal.
Furthermore, markets remain wary of the upcoming policies of US President-elect Donald Trump and the US Federal Reserve (Fed), helping Gold price stay afloat even as the US Treasury bond yields continue to hold firm near multi-month highs.
The US Dollar (USD) has reversed strong US ISM Manufacturing PMI-led gains, currently trading in the red, aiding the Gold price rebound.
However, it remains to be seen if the USD sustains the pullback heading into the mid-tier US final PMI and Factory Orders data releases. Speeches by Fed policymakers will also remain crucuial to determining the Fed’s policy move this month, significantly impacting the USD-denominated Gold price.
Markets are also likely to trade cautiously, gearing up for a series of labor data from the US later this week.
The daily chart shows that the 14-day Relative Strength Index (RSI) remains above the 50 level, backing the bullish bias for Gold price.
Meanwhile, Gold price defends the 21-day Simple Moving Average (SMA) at $2,638 after failing to sustain above the 50-day SMA of $2,651 on Friday.
Gold buyers remain poised to regain the 50-day SMA barrier as long as the 21-day SMA support holds.
The next relevant topside barrier is seen at the three-week high of $2,665, above which the $2,700 level will come into play.
On the flip side, a sustained move below the 21-day SMA at $2,638 will expose the 100-day SMA at $2,627.
A daily candlestick close below the latter will open the door for a retest of the previous week’s low of $2,596.
Gold has played a key role in human’s history as it has been widely used as a store of value and medium of exchange. Currently, apart from its shine and usage for jewelry, the precious metal is widely seen as a safe-haven asset, meaning that it is considered a good investment during turbulent times. Gold is also widely seen as a hedge against inflation and against depreciating currencies as it doesn’t rely on any specific issuer or government.
Central banks are the biggest Gold holders. In their aim to support their currencies in turbulent times, central banks tend to diversify their reserves and buy Gold to improve the perceived strength of the economy and the currency. High Gold reserves can be a source of trust for a country’s solvency. Central banks added 1,136 tonnes of Gold worth around $70 billion to their reserves in 2022, according to data from the World Gold Council. This is the highest yearly purchase since records began. Central banks from emerging economies such as China, India and Turkey are quickly increasing their Gold reserves.
Gold has an inverse correlation with the US Dollar and US Treasuries, which are both major reserve and safe-haven assets. When the Dollar depreciates, Gold tends to rise, enabling investors and central banks to diversify their assets in turbulent times. Gold is also inversely correlated with risk assets. A rally in the stock market tends to weaken Gold price, while sell-offs in riskier markets tend to favor the precious metal.
The price can move due to a wide range of factors. Geopolitical instability or fears of a deep recession can quickly make Gold price escalate due to its safe-haven status. As a yield-less asset, Gold tends to rise with lower interest rates, while higher cost of money usually weighs down on the yellow metal. Still, most moves depend on how the US Dollar (USD) behaves as the asset is priced in dollars (XAU/USD). A strong Dollar tends to keep the price of Gold controlled, whereas a weaker Dollar is likely to push Gold prices up.
The Gold price (XAU/USD) struggles to gain ground near $2,640 during the early Asian trading hours on Monday. The stronger US Dollar (USD) after the US ISM Manufacturing Purchasing Managers Index (PMI) weighs on the yellow metal. All eyes will be on the US labor market data for December on Friday for fresh impetus.
Data released by the Institute for Supply Management (ISM) on Friday showed that the US Manufacturing PMI rose to 49.3 in December from 48.4 in November. This reading was above the market consensus of 48.4. The upbeat data has lifted the Greenback and dragged the USD-denominated commodity price lower.
Furthermore, the US Federal Reserve’s (Fed) projection of fewer interest rate cuts could undermine the non-yielding asset. The US central bank decided to cut the interest rates in December but signaled that borrowing costs will fall more slowly than previously expected this year.
On the other hand, economic uncertainties and geopolitical tensions might boost a safe-haven asset like Gold. On Sunday, Israel and Hamas wrangled over a deal to cease violence in the Gaza Strip and return hostages home as Palestinian officials said that Israeli bombardments killed over 100 people over the weekend.
Central bank purchasing activities could contribute to the precious metal’s upside. Central banks are forecast to continue to be net buyers of around 8 million oz. in 2025, roughly unchanged to a bit lower than in 2024.
Gold has played a key role in human’s history as it has been widely used as a store of value and medium of exchange. Currently, apart from its shine and usage for jewelry, the precious metal is widely seen as a safe-haven asset, meaning that it is considered a good investment during turbulent times. Gold is also widely seen as a hedge against inflation and against depreciating currencies as it doesn’t rely on any specific issuer or government.
Central banks are the biggest Gold holders. In their aim to support their currencies in turbulent times, central banks tend to diversify their reserves and buy Gold to improve the perceived strength of the economy and the currency. High Gold reserves can be a source of trust for a country’s solvency. Central banks added 1,136 tonnes of Gold worth around $70 billion to their reserves in 2022, according to data from the World Gold Council. This is the highest yearly purchase since records began. Central banks from emerging economies such as China, India and Turkey are quickly increasing their Gold reserves.
Gold has an inverse correlation with the US Dollar and US Treasuries, which are both major reserve and safe-haven assets. When the Dollar depreciates, Gold tends to rise, enabling investors and central banks to diversify their assets in turbulent times. Gold is also inversely correlated with risk assets. A rally in the stock market tends to weaken Gold price, while sell-offs in riskier markets tend to favor the precious metal.
The price can move due to a wide range of factors. Geopolitical instability or fears of a deep recession can quickly make Gold price escalate due to its safe-haven status. As a yield-less asset, Gold tends to rise with lower interest rates, while higher cost of money usually weighs down on the yellow metal. Still, most moves depend on how the US Dollar (USD) behaves as the asset is priced in dollars (XAU/USD). A strong Dollar tends to keep the price of Gold controlled, whereas a weaker Dollar is likely to push Gold prices up.
Market the coffee world
Robusta coffee prices on the London floor updated at 15:30 p.m. on January 5, 2025 are still fluctuating between 4727 and 4968 USD/ton, unchanged from the previous day. Specifically, the monthly delivery term March 2025 is 4968 USD/ton; the monthly delivery term May 2025 is 4897 USD/ton; the monthly delivery term July 2025 is 4817 USD/ton and the monthly delivery term September 2025 is 4727 USD/ton.
| Organic coffee garden of VNUM Coffee Import-Export Company Limited_C/9 Dak Lak. Photo: Danh Huu |
Similarly, the price of Arabica coffee on the New York floor on the afternoon of January 5, 2025 was also unchanged compared to the previous day, fluctuating from 302.20 – 318.65 cents/lb. Specifically, the monthly delivery term March 2025 was 318.65 cents/lb, the monthly delivery term May 2025 was 314.90 cents/lb; the monthly delivery term July 2025 was 309.10 cents/lb and the monthly delivery term September 2025 was 302.20 cents/lb.
The price of Brazilian Arabica coffee on the morning of January 5, 2025 was updated as follows: The range is from 372.85 – 402.50 USD/ton. Specifically, the monthly delivery period March 2025 is 402.50 USD/ton; the monthly delivery period May 2025 is 392.25 USD/ton; the monthly delivery period July 2025 is 384.45 USD/ton; the monthly delivery period September 2025 is 372.85 USD/ton.
The highest domestic coffee price is 120.500 VND/kg
According to information from Giacaphe.com, at 15:30 p.m. today, domestic coffee prices remained unchanged compared to yesterday, remaining at an average of 120.300 VND/kg.
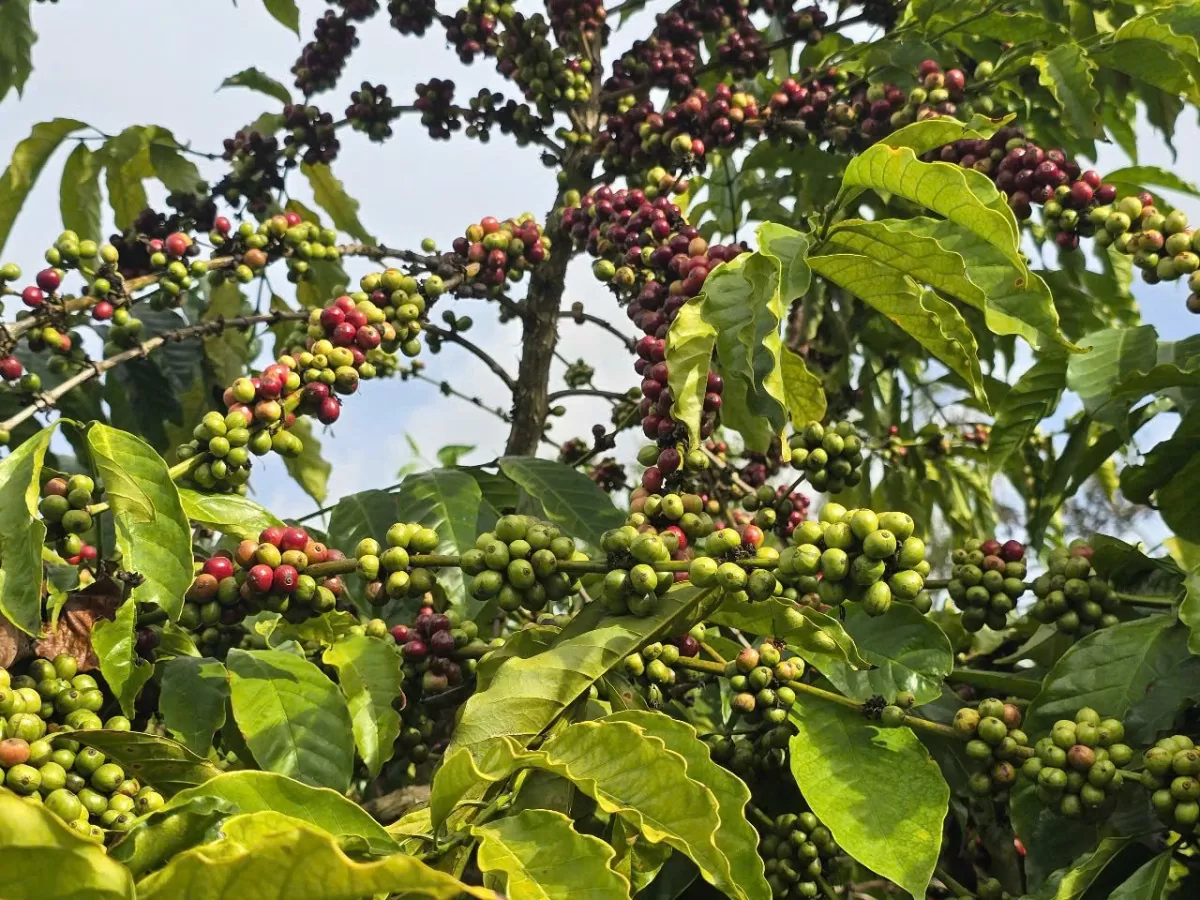 |
| Coffee in Duc Trong district, Lam Dong province. Photo: Le Son |
In the Central Highlands region, the province Lam Dong is still the locality with the lowest coffee purchasing price at 119.800 VND/kg. On the contrary, Dak Nong continues to hold the position of the place with the highest coffee purchase price, reaching 120.500 VND/kg.
Specifically, coffee prices in the Central Highlands provinces are recorded as follows: Dak Nong: 120.500 VND/kg, Dak Lak: 120.300 VND/kg, Gia Lai: 120.200 VND/kg and Lam Dong: 119.800 VND/kg.
The domestic coffee prices that Giacaphe.com lists every day are calculated based on the prices of two world coffee exchanges combined with continuous surveys from businesses and purchasing agents in key coffee growing areas across the country.
Y5Cafe always tries to stay as close as possible to each region, however there will be days when the listed price does not completely match the local coffee purchase price, but Y5Cafe believes that the listed information is a valuable reference source for farmers and coffee purchasing businesses.
Coffee price prediction tomorrow 6/ 1 / 2025
Vietnam’s coffee industry is facing major challenges as it enters the final months of 2024. Industry experts have expressed concerns about a sharp decline in coffee export volume, especially in the fourth quarter of 4.
It is estimated that coffee export volume in the fourth quarter of 4 will only reach about 2024-160.000 tons. This figure is not only lower than previous months but also equal to the export volume of a December in previous years. This shows a serious downward trend in Vietnam’s coffee supply.
Meanwhile, the global and domestic coffee markets are expected to continue to fluctuate, affected by various factors such as climate change, consumption demand and trade policy. To overcome these challenges, the Vietnamese coffee industry needs to make timely adjustments.
Experts recommend that the coffee industry should soon adjust its development strategy to maintain sustainable growth. Investing in technology and improving production processes can help improve coffee quality and output, thereby creating a competitive advantage in the international market.
In the short term, specifically tomorrow January 6, 2025, experts predict that coffee prices may continue to decrease, predicting a decrease of about 400 – 700 VND/kg.
Sources: https://congthuong.vn/du-bao-gia-ca-phe-trong-nuoc-ngay-612025-tiep-da-giam-368024.html
Coffee price world Declining in the trading sessions at the end of the old year 2024 and early 2025, the commodity market witnessed a quiet trading session and continued to adjust slightly down before the holidays due to weak trading activities and some year-end book-balancing activities.
However, for the full year of 2024, coffee is the strongest performing commodity for the second consecutive year due to a global supply shortage. The monthly robusta coffee futures contract March 2025 ended 2024 up more than 70%. After 1 year, robusta is up to 4.875 USD/ton, arabica is up to 319,75 cents/lb.
Currently, the impact on the coffee market – the Brazilian Real has lost nearly 9% of its value against the USD since the beginning of December, encouraging Brazilian producers to increase sales on the international market. Meanwhile, in Vietnam, harvesting activities continue to be hampered by rain.
Domestic coffee prices on the last day of the old year (December 31, 2024) turned down by 700 – 800 VND/kg, down to 119.700 – 120.500 VND/kg. At the end of 2024, the price of green coffee beans in the Central Highlands – Vietnam’s key coffee production area – fluctuated between 119.700 – 120.500 VND/kg, an increase of nearly 80% (about 52.000 VND/kg) over the past year. During the year, there was a time when domestic coffee prices reached an all-time high, exceeding 130.000 VND/kg.
Thanks to high prices, exports also had a brilliant 1 year. The General Department of Customs said that coffee export turnover as of 15/12 has reached 5,2 billion USD. This is the first time in the history of the Vietnamese coffee industry that coffee export turnover has exceeded the 5 billion USD mark in a year. High prices have made farmers excited and expect the 2025 year to continue to be successful.
| Domestic coffee prices at the end of the year trading session (31/2024) decreased by 700 – 800 VND/kg in some key purchasing localities. (Source: europosters.eu) |
Notes of World & Vietnam, at the end of the first trading session of the week (30/12), the price of robusta coffee on the ICE Futures Europe London monthly delivery term March 2025 continued to decrease 32 USD, trading at 4.921 USD/ton. The monthly delivery term May 2025 decreased 29 USD, trading at 4.855 USD/ton. The average trading volume was low.
Arabica coffee prices on the ICE Futures US New York floor also decreased, with the monthly delivery term March 2025 decreasing by 1,65 cents, trading at 321,00 cents/lb. Meanwhile, the monthly delivery term May 2025 decreasing by 0,65 cents, trading at 316,95 cents/lb. Average trading volume.
|
Domestic coffee prices at the end of the year trading session (31/2024) decreased by 700 – 800 VND/kg in some key purchasing localities. Unit: VND/kg
(Source: giacaphe.com) |
For now, the market outlook is muted as investors await the Federal Reserve’s 2025 outlook report, due next week. Coffee prices are also under pressure from a stronger US dollar and improved ICE certified inventories.
Coffee prices have surged in 2024, supported by adverse weather in producing countries, especially the two largest producers, Brazil and Vietnam. Severe drought in Brazil, the world’s largest coffee producer, has caused Arabica prices to surge to their highest level in more than 40 years.
Thus, coffee prices have been rising for quite a long time, now reaching a historical peak according to Trading Economics. The global coffee market is at a major crossroads as it enters 2025, with unpredictable developments from supply, weather, to currency fluctuations. Will coffee prices continue to rise or is this a time for adjustment?
The “dominant factors” of the market in 2024, such as supply disruptions, climate change and geopolitical tensions, are the main reasons for the high prices, posing many interesting predictions for 2025. Experts are particularly concerned that the upcoming crop will still be heavily affected, increasing the pressure on global supply.
Coffee prices are expected to remain high in 2025, with significant volatility due to climate disruptions, supply chain challenges and changing demand dynamics. Both the arabica and robusta markets face tight supply conditions, ensuring strong prices in the short to medium term.
The coffee market in 2025 is forecast to remain vibrant, with a mix of risks and opportunities. Factors such as weather, currency fluctuations, and global supply and demand will determine the direction of coffee prices in the coming year. With many potential uncertainties, coffee is likely to continue to be one of the most notable commodities in the global commodity market.
Sources: https://baoquocte.vn/gia-ca-phe-hom-nay-112025-ca-phe-viet-nam-ghi-nhieu-ky-luc-trong-nam-2024-du-bao-gia-ca-phe-nam-2025-299257.html
Pepper price forecast tomorrow
Forecast of domestic pepper prices tomorrow January 4, 2025 increased; current pepper purchase price in localities is on average 148.200 VND/kg.
Today’s pepper price was updated on the afternoon of January 4, 2025 as follows, domestic pepper price increased sharply, the increase was from 1.000 – 2.500 VND/kg, especially in the pepper market of the province. Binh Phuoc unchanged
Specifically, pepper price today in the province Dak Nong After many stable sessions, pepper has turned to increase, increasing by 2.500 VND/kg, currently being purchased at 149.500 VND/kg; similarly, pepper price in Ba Ria – Vung Tau increased by 2.000 VND/kg compared to the previous trading session, currently being purchased at 149.000 VND/kg; pepper price in Gia Lai at 147.500 VND/kg (up 1.000 VND/kg); pepper price in the province Dak Lak is 148.000 VND/kg (up 1.000 VND/kg). Pepper price in Binh Phuoc province remains stable, currently being purchased at 147.000 VND/kg.
| Domestic pepper price updated on January 3, 2025 |
Experts say that the Vietnamese pepper industry is currently facing many challenges such as unfavorable weather, high production costs and diseases, while the pepper growing area has decreased due to the change in crop structure. However, with low inventories and a forecast of a late 2025 harvest due to prolonged drought, pepper prices are expected to increase.
In 2024, Vietnam will export about 250.000 tons of pepper, worth 1,3 billion USD, maintaining its position as the number 1 pepper exporter. worldHowever, to maintain this position, improving product quality and value added will be important factors.
 |
| Farmers in Duc Trong district, Lam Dong province harvest pepper. |
According to statistics from the International Pepper Community (IPC), it can be said that 2024 will be a year of strong increase in pepper prices in many countries. Specifically, the price of Indonesian black pepper increased from 3.887 USD/ton to 6.855 USD/ton, thereby increasing nearly 1,8 times; the price of white pepper in this country also increased by 1,5 times.
In Malaysia, the corresponding increase was 1,7 times and 1,5 times for black pepper and white pepper. Meanwhile, the price of Brazilian black pepper doubled.
For the Vietnamese market, comparing IPC data, the export price of black pepper increased 1,6 times, with the export price of white pepper being 1,7 times. Increased production and trade factors have been embedded in pepper prices, combined with reduced output in leading producing countries, which are the main reasons for the high pepper price.
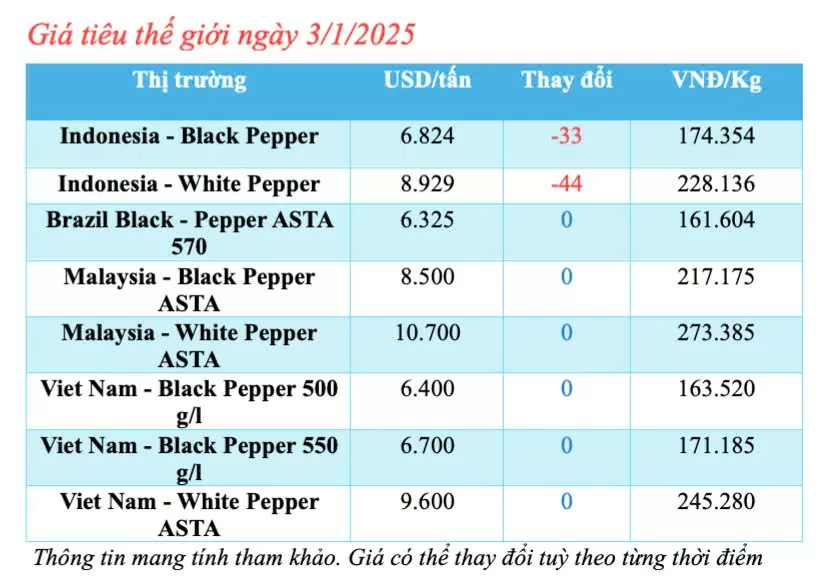 |
| Update world pepper price today January 3, 2025 |
Forecast of world pepper price tomorrow January 4, 2025
According to forecasts, world pepper prices will decrease slightly tomorrow. However, there are still increases and decreases in pepper prices in the markets of different countries.
Update on world pepper prices from the International Pepper Community (IPC) on the afternoon of January 3, 2025 as follows: the pepper market in Indonesia turned down, other markets were stable and anchored at a high level.
Specifically, IPC listed the price of Indonesian Lampung black pepper as fluctuating down compared to the previous trading session, currently at 6.824 USD/ton (down 33 USD/ton), similarly, the price of Muntok white pepper was purchased at 8.929 USD/ton (down 44 USD/ton).
The Brazilian pepper market is stable, with little fluctuation compared to the previous trading session, currently at 6.325 USD/ton.
Malaysian ASTA black pepper price is purchased at 8.500 USD/ton; ASTA white pepper price is at 10.700 USD/ton.
The export price of Vietnamese black pepper is stable, slightly decreasing, currently reaching 6.400 USD/ton for 500 g/l and 550 USD/ton for 6.700 g/l; the price of white pepper is high at 9.600 USD/ton.
*The above pepper price forecast is for reference only, the actual price will be officially available tomorrow morning (January 4, 2025) on Congthuong.vn.
Sources: https://congthuong.vn/du-bao-gia-tieu-ngay-mai-412025-gia-tieu-tang-manh-367733.html
Today’s decline puts the near-term rising trend structure at risk of being violated. Dynamic support is represented by the internal uptrend line and 20-Day line. Notice that since the 20-Day MA was reclaimed on October 29 there have been no daily closes below the line, even though intraday trading did occur below the 20-Day line.
If natural gas closes today below the 20-Day MA, it will show a change in character. This would put the 2.29 recent swing low at risk of being busted. That would then signal further weakness and increase the chance of the 50-Day MA, now at 3.13, being tested as support.
The 50-Day MA is more significant than the 20-Day MA, particularly since it shows potential support above the top boundary line of a large symmetrical triangle pattern. In addition, it is above the most recent swing low at 2.98. That swing was the first test of a prior resistance area related to the triangle formation.
It is also part of the larger trend structure of higher swing highs and higher lows, that began from the October swing low. It also resides around the initial triangle breakout trigger of 3.02. Now that the top boundary lines have fallen further, it also needs to be considered as a potential support if it approached.
In addition to bearish signs on the daily chart, the weekly chart (not shown) also looks ominous and shows bearish momentum. A bearish shooting star candle will complete today, with a likely close near the lows of the week. Further, this week’s pattern includes a long tail, derived from the bearish reversal off the top rising trend channel line (circled).
In other words, this week is the result of a bearish reversal from the top of the trend. It is supportive of a continuation lower. Nonetheless, a new bearish weekly signal will not be given unless there is a drop below this week’s low and the sellers retain control.
XAU/USD dipped on Friday, with Gold prices falling roughly two-thirds of a percent and dipping back below $2,650 per ounce as market sentiment recovers from the early week’s risk-off appetite. It’s been a wobbly start to global markets during the first week of the 2025 trading season, but investors are still looking for reasons to firm up their stance heading into the new year.
Federal Reserve (Fed) Bank of Richmond President Tom Barkin spoke to a bankers association in Maryland on Friday, highlighting that the Fed has already reduced interest rates by a full percentage point during 2024, bringing the fed funds rate down to the 4.25%-4.5% range. The US unemployment rate is also holding at historically low levels, while inflation appears to be drifting back toward the Fed’s target of 2% annually. Fed’s Barkin also downplayed the potential negative effects of incoming President Donald Trump’s plans to enact sweeping tariff proposals on his first day in office that would see the US functionally enter into simultaneous trade wars with all of the US’ closest allies and trading partners unilaterally. According to Fed policymaker Barkin, markets shouldn’t be too worried about a potential 10%-20% fee on all imported goods into the US, because the “pass-through from tariffs to prices is not straightforward, it depends on multiple factors including business supply chains, and the price elasticity of consumers.”
Coming up next week, American markets and institutions will be taking Thursday off in observation of the passing of former President Jimmy Carter, who died on December 29th at the age of 100. Friday will follow up with the first US Nonfarm Payrolls (NFP) print of 2025.
Gold prices have been caught in a rough cyclical churn through the last quarter of 2024, with XAU/USD bids routinely spinning around the $2,650 handle. Gold’s sideways grind is best highlighted by the 50-day Exponential Moving Average (EMA), which has been moving sideways since early November and is acting like a trap for bids, keeping price action constrained.
Bulls have failed repeatedly to muscle prices back above $2,720, while selling pressure remains bolstered by a near-term technical floor at the $2,600 handle.
Gold has played a key role in human’s history as it has been widely used as a store of value and medium of exchange. Currently, apart from its shine and usage for jewelry, the precious metal is widely seen as a safe-haven asset, meaning that it is considered a good investment during turbulent times. Gold is also widely seen as a hedge against inflation and against depreciating currencies as it doesn’t rely on any specific issuer or government.
Central banks are the biggest Gold holders. In their aim to support their currencies in turbulent times, central banks tend to diversify their reserves and buy Gold to improve the perceived strength of the economy and the currency. High Gold reserves can be a source of trust for a country’s solvency. Central banks added 1,136 tonnes of Gold worth around $70 billion to their reserves in 2022, according to data from the World Gold Council. This is the highest yearly purchase since records began. Central banks from emerging economies such as China, India and Turkey are quickly increasing their Gold reserves.
Gold has an inverse correlation with the US Dollar and US Treasuries, which are both major reserve and safe-haven assets. When the Dollar depreciates, Gold tends to rise, enabling investors and central banks to diversify their assets in turbulent times. Gold is also inversely correlated with risk assets. A rally in the stock market tends to weaken Gold price, while sell-offs in riskier markets tend to favor the precious metal.
The price can move due to a wide range of factors. Geopolitical instability or fears of a deep recession can quickly make Gold price escalate due to its safe-haven status. As a yield-less asset, Gold tends to rise with lower interest rates, while higher cost of money usually weighs down on the yellow metal. Still, most moves depend on how the US Dollar (USD) behaves as the asset is priced in dollars (XAU/USD). A strong Dollar tends to keep the price of Gold controlled, whereas a weaker Dollar is likely to push Gold prices up.