The main tag of Gold Price Articles.
You can use the search box below to find what you need.
[wd_asp id=1]
The main tag of Gold Price Articles.
You can use the search box below to find what you need.
[wd_asp id=1]
In May, Comex copper hit an all-time intraday high of nearly $5.20 a pound or $11,500 per tonne. Positioning went to such net lengths that dollar trading volumes scaled $100 billion (twice the Dow daily average) in one 24 hour period.
Cooler heads prevailed in London, particularly after it became clear that the squeeze was mainly a US phenomenon and cargoes destined for Rotterdam and Shanghai were soon redirected there. LME futures have yet to visit $11,000 a tonne.
A supposedly never-wrong oil hedge fund manager from France – that bastion of the commodities world – took a pause from the black stuff to forecast $40,000 a tonne for the brown metal over “the next four years or so”.
Perhaps fitting since even those with decades of experience on metals markets got caught up in the excitement, calling copper “the new oil,” the “highest conviction trade ever seen” and predicting a 50% price upside.
But like the head on a badly poured French Blanche the froth on copper markets soon settled.
Managed money longs made another big push at the end of September, this time predicated on a Beijing bazooka of economic stimulus, but the subsequent run up for copper fell well short of what was promised just like the pronouncements of the Standing Committee of the National People’s Congress.
The final blow for copper’s year of living gloriously was Trump’s tariffs and a stronger dollar and it now looks like copper will drift into the new year with most of its 2024 gains given up.
But what’s in store for 2025?
While futures are fun to follow, on and under the ground developments unfold at a slower pace – although even here surprises could be plentiful.
Copper markets took the loss of Cobre Panama mostly in stride thanks to Codelco managing to run fast enough to stand still.
Escondida, the only 1mtpa plus copper mine in the world, is also churning out metal with the latest production figures showing a 22% year on year jump, helping to lift overall Chilean output more than 6% compared to last year.
Chile’s mining association said this week copper production will range between 5.4m and 5.6m tonnes in 2025.
While major greenfield mines coming on stream is increasingly fewer and farther between with Malmyzh in Russia (120ktpa) the only entry for 2025, expansions at Almalyk in Uzbekistan (148ktpa), Kamoa Kakula (139ktpa), and QB2 in Chile, Peru’s Las Bambas in Mongolian Oyu Tolgoi each close to 80ktpa will ensure fresh supply in 2025.
With CMOC’s Tenke Fungurume and Kisanfu firing on all cylinders and ever dependable Kamoa’s contribution the DRC is likely to be once again responsible for the most additional tonnes next year as it has for the past four out of five years.
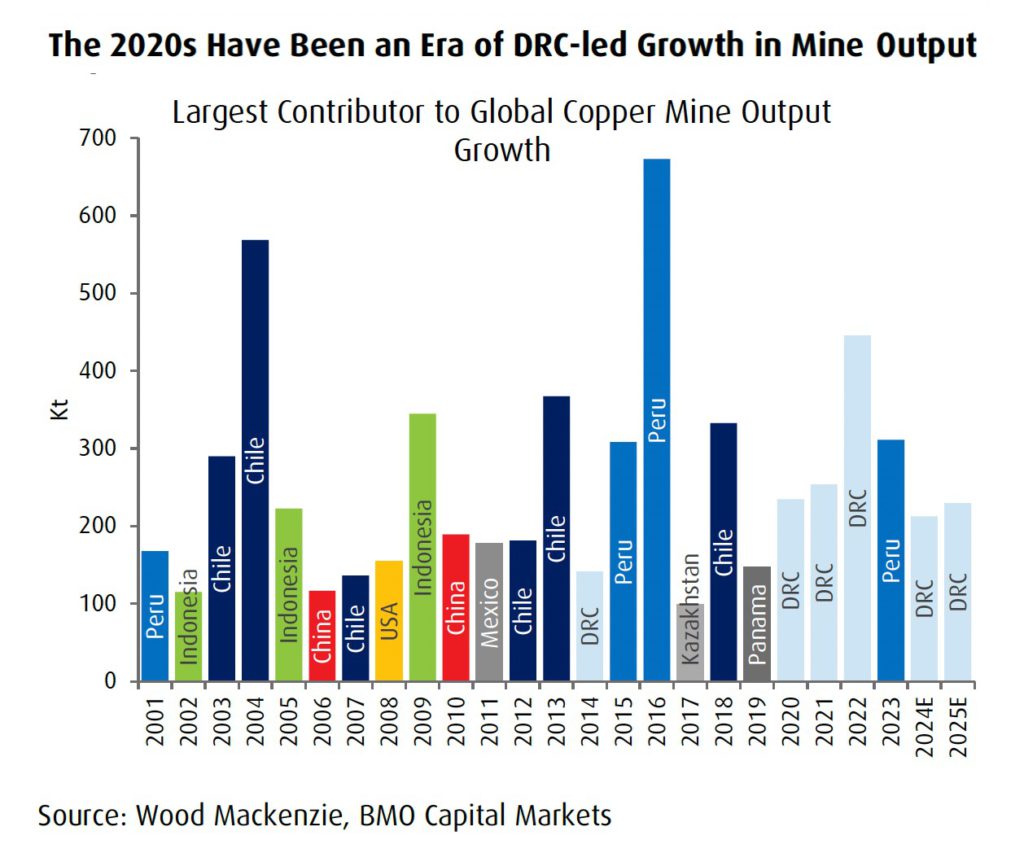
The last time the US was the greatest contributor was 2008, but the incoming Trump administration positive noises around permitting may see the country once again play its part on copper markets some time in the future.
Copper markets will remain well supplied in 2025 says BMO and at around 2.8% growth will be higher relative to recent history. Macquarie thinks output could rise by as much as 4% in 2024 and with project approvals of nearly 500kt so far in 2024, the pipeline further out may not be as thin as previously thought.
On the demand side, the backdrop of the energy transition and the rosy long term outlook for copper is very much still in place, but day-to-day it is still all about China as evidenced by the immediate response of fiscal or monetary stimulus on markets.
Overall China is responsible for around 56% of global copper consumption or around 15mt and Capital Economics in a recent research report argued that a correction in Chinese construction activity “as large as 50% decline from peak to trough” will offset most of the electrification demand.
RBC Capital Markets expects global copper demand growth of 2.9% year-over-year in 2025 with the bulk of the growth coming from outside China which will only expand by 1%.
BMO Capital Markets are more optimistic modelling 2.2% growth in China next year. Next year’s state grid budget (spending surged in 2024 by more than 20% to over $400bn) will be a factor in Chinese demand but there is consensus that the construction slump, particularly for completions, will continue to be a drag.
The all-time low benchmark treatment charges of $21.25/t (the benchmark was $80/t last year and spot TCs even went negative for several months this year) agreed between Antofagasta and Jiangxi last week lifted spirits but as many have pointed out it’s a sign of smelter overcapacity not demand for concentrate.
After promised supply cuts from Chinese refiners did not materialize 2024 turned out to be the largest (refined) copper surplus in over a decade. BMO predicts a much smaller surplus this year of around 100kt. RBC sees around half that while Macquarie is most pessimistic with a refined surplus three times BMO’s (but a deficit on concentrate markets).
Macquarie also points to the wild card for copper market over the next few years: “Should the Cobre Panama mine restart, and we believe it ultimately will, then there is the potential for an additional 300ktpa of mine supply which would keep the market in a comfortable surplus out to 2029 (all else being equal).”
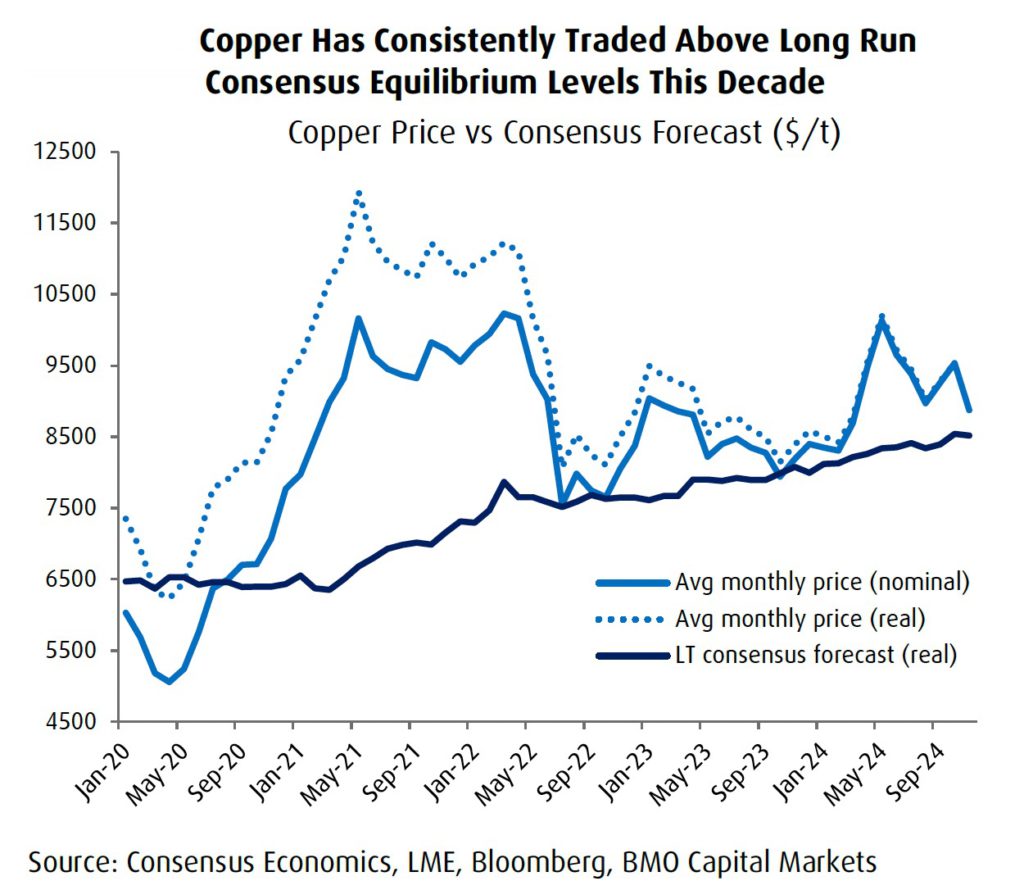
Goldman Sachs, the copper uber bulls of the last few years, took a chainsaw to its price forecast but even after cutting by $5,000 is still one of the more optimistic prognosticators. The investment bank sees copper averaging $10,160 a tonne next year.
Morgan Stanley forecasts prices will climb to $9,500 by the end of 2025. The Chile mining association is also one of the more sanguine at between $9,260–$9,920, but CitiGroup recently slashed its expectations from an average of $10,250 to $8,750 next year.
RBC lowered its 2025 estimate to $8,800 (from just under $10,000 before), while BMO’s prediction for next year is also for copper to camp out around the $4.00 or $8,800 level.
Capital Economics is the most pessimistic forecasting copper would lose touch with the $9,000 a tonne level next year, average only $8,000 by the end of 2026, and continue to drift lower through 2030.
Silver price (XAG/USD) continues its losing streak for the fourth successive day, trading around $30.50 per troy ounce during the Asian hours on Tuesday. Analysis of the daily chart indicates a momentum shift to bearish from bullish bias as the pair has broken below the ascending channel pattern.
The XAG/USD pair moves below both of these EMAs, indicating a bearish outlook and signaling to weakening short-term price momentum. This points to increasing selling interest and raises the likelihood of further price depreciation. Additionally, the 14-day Relative Strength Index (RSI) is positioned below the 50 mark, further confirming the emergence of the bearish bias.
However, the alignment of the nine- and 14-day Exponential Moving Averages (EMAs) suggests that the market is experiencing a period of consolidation, lacking a strong directional momentum. Traders may interpret this as a signal that the market is waiting for a catalyst to determine its next move, whether upward or downward.
The XAG/USD pair may test its primary support at the psychological level of $30.00, followed by a “throwback support” level at its three-month low of $29.65, which was recorded on November 28.
On the upside, the immediate barriers appear at the nine- and 14-day EMAs at $30.91 and $30.96, respectively. A break above these levels could cause the bullish bias to re-emerge and help the Silver price to retest its six-week high of $32.28, reached on December 9.
Silver is a precious metal highly traded among investors. It has been historically used as a store of value and a medium of exchange. Although less popular than Gold, traders may turn to Silver to diversify their investment portfolio, for its intrinsic value or as a potential hedge during high-inflation periods. Investors can buy physical Silver, in coins or in bars, or trade it through vehicles such as Exchange Traded Funds, which track its price on international markets.
Silver prices can move due to a wide range of factors. Geopolitical instability or fears of a deep recession can make Silver price escalate due to its safe-haven status, although to a lesser extent than Gold’s. As a yieldless asset, Silver tends to rise with lower interest rates. Its moves also depend on how the US Dollar (USD) behaves as the asset is priced in dollars (XAG/USD). A strong Dollar tends to keep the price of Silver at bay, whereas a weaker Dollar is likely to propel prices up. Other factors such as investment demand, mining supply – Silver is much more abundant than Gold – and recycling rates can also affect prices.
Silver is widely used in industry, particularly in sectors such as electronics or solar energy, as it has one of the highest electric conductivity of all metals – more than Copper and Gold. A surge in demand can increase prices, while a decline tends to lower them. Dynamics in the US, Chinese and Indian economies can also contribute to price swings: for the US and particularly China, their big industrial sectors use Silver in various processes; in India, consumers’ demand for the precious metal for jewellery also plays a key role in setting prices.
Silver prices tend to follow Gold’s moves. When Gold prices rise, Silver typically follows suit, as their status as safe-haven assets is similar. The Gold/Silver ratio, which shows the number of ounces of Silver needed to equal the value of one ounce of Gold, may help to determine the relative valuation between both metals. Some investors may consider a high ratio as an indicator that Silver is undervalued, or Gold is overvalued. On the contrary, a low ratio might suggest that Gold is undervalued relative to Silver.
Gold price holds the previous rebound above $2,650 early Tuesday as buyers remain in control amid sustained weakness in the US Dollar (USD) and sluggish US Treasury bond yields. The focus now remains on the US Retail Sales data as the US Federal Reserve (Fed) begins its two-day monetary policy meeting later on Tuesday.
Traders continue to adjust their USD positions, closing in on the Fed policy announcements, with US Treasury bond yields witnessing a choppy action, unperturbed by the mixed US S&P Global preliminary Manufacturing and Services PMI data released on Tuesday. Data showed that the US manufacturing sector contraction deepened to 48.3 in December, missing the forecast of 49.4. Meanwhile, the US Services PMI jumped to 58.5 in the same period from November’s 56.1. The market consensus was 55.7.
The CME Group’s FedWatch Tool shows that markets continue to fully price in the probability that the Fed will lower the interest rate by 25 basis points on Wednesday. This continues to underpin the sentiment around the non-yielding Gold price alongside looming geopolitical risks.
However, growing expectations that the Fed could opt for fewer rate cuts in 2025 and likely pause its easing cycle in January act as a headwind to the Gold price turnaround. Markets eagerly await the Fed’s quarterly economic projections and Chairman Jerome Powell’s comments to gauge the US central bank’s path forward on interest rates next year, which could significantly impact the Gold price.
On the geopolitical front, the US imposed new sanctions on North Korea and Russia on Monday, targeting Pyongyang’s financial activities and military support to Moscow. The political instability in South Korea and Israel-Gaza tensions also support the Gold price.
In the lead-up to the Fed event risks, Gold traders look forward to US November Retail Sales for some fresh trading incentives. The consumer spending data, however, is unlikely to alter the market’s expectations of the Fed’s move this week.
As observed on the daily chart, Gold price extends its struggles with the 21-day Simple Moving Average (SMA) support at $2,655 after having closed above it on Monday.
The 14-day Relative Strength Index (RSI) is trading flat at around the 50 level, suggesting a lack of clear directional bias.
Gold buyers must scale the 50-day SMA at $2,671 to offer extra legs to the recent rebound. The next upside target is at the $2,700 level.
Further up, Gold price could revisit the multi-week high of $2,726.
Conversely, a daily candlestick close below the 21-day SMA at $2,655 could initiate a fresh downtrend toward the December 6 low of $2,613.
The line in the sand for Gold buyers is seen at the $2,600 area, where the 100-day SMA coincides with the November 26 low.
The Retail Sales data, released by the US Census Bureau on a monthly basis, measures the value in total receipts of retail and food stores in the United States. Monthly percent changes reflect the rate of changes in such sales. A stratified random sampling method is used to select approximately 4,800 retail and food services firms whose sales are then weighted and benchmarked to represent the complete universe of over three million retail and food services firms across the country. The data is adjusted for seasonal variations as well as holiday and trading-day differences, but not for price changes. Retail Sales data is widely followed as an indicator of consumer spending, which is a major driver of the US economy. Generally, a high reading is seen as bullish for the US Dollar (USD), while a low reading is seen as bearish.
Next release: Tue Dec 17, 2024 13:30
Frequency: Monthly
Consensus: 0.5%
Previous: 0.4%
Source: US Census Bureau
Also, potential support around the near-term uptrend line was breached today. This was another minor item, but it could be an early clue to falling demand that would require further evidence. Recognize that a failed breakout to new highs was established with last week’s high of 3.56. Clearly there is resistance around that price level as it also led to a bearish reversal from the first high on November 22.
Therefore, if natural gas is going to have a possibility of breaking out above the 3.56 highs prior to a sustained decline below the 20-Day MA, demand needs to be strong enough to do it. If demand is not strong enough to facilitate a new high breakout, then consolidation near the highs is possible or another decline to below the 20-Day MA. This is why small clues related to supply and demand could help to better prepare for the next moves.
It looks like there is a chance that this week may be largely consolidation type price action given the weekly pattern. Last week’s price range was from 3.07 to 3.56. The week triggered a bearish reversal as natural gas exceeded the previous week’s high of 3.28. However, the close could have been stronger as it was 3.27, below the prior week’s high. For the week the price range was relatively large. Therefore, we could see an inside week this week, in preparation for another attempt at new highs. A scenario to consider.
For a look at all of today’s economic events, check out our economic calendar.
Silver Prices (XAG/USD) are trading in a mild positive bias on Monday, trimming some losses after the rejection from levels above $32.00 last week. A mild retreat in US Treasury yields is supporting precious metals on Monday but the overall picture shows the pair vulnerable.
The daily chart reveals a sharp reversal pattern last week, which triggered a more than 4% sell-off in the last half of the week. Upside attempts are looking feeble so far, with previous support at $30.85 likely to challenge bulls.
So far the current recovery seems corrective, unable to put a significant distance from Friday’s low, at $30.30. Below here, December’s low at the $30.00 round level might provide some support ahead of the key $29.65 level.
To the upside, immediate resistance is at $31.00. Above here, $31.45 (November 18, 24 and December 4 high and December 11 low) will be targeted ahead of last week’s highs at $32.30.
Silver is a precious metal highly traded among investors. It has been historically used as a store of value and a medium of exchange. Although less popular than Gold, traders may turn to Silver to diversify their investment portfolio, for its intrinsic value or as a potential hedge during high-inflation periods. Investors can buy physical Silver, in coins or in bars, or trade it through vehicles such as Exchange Traded Funds, which track its price on international markets.
Silver prices can move due to a wide range of factors. Geopolitical instability or fears of a deep recession can make Silver price escalate due to its safe-haven status, although to a lesser extent than Gold’s. As a yieldless asset, Silver tends to rise with lower interest rates. Its moves also depend on how the US Dollar (USD) behaves as the asset is priced in dollars (XAG/USD). A strong Dollar tends to keep the price of Silver at bay, whereas a weaker Dollar is likely to propel prices up. Other factors such as investment demand, mining supply – Silver is much more abundant than Gold – and recycling rates can also affect prices.
Silver is widely used in industry, particularly in sectors such as electronics or solar energy, as it has one of the highest electric conductivity of all metals – more than Copper and Gold. A surge in demand can increase prices, while a decline tends to lower them. Dynamics in the US, Chinese and Indian economies can also contribute to price swings: for the US and particularly China, their big industrial sectors use Silver in various processes; in India, consumers’ demand for the precious metal for jewellery also plays a key role in setting prices.
Silver prices tend to follow Gold’s moves. When Gold prices rise, Silver typically follows suit, as their status as safe-haven assets is similar. The Gold/Silver ratio, which shows the number of ounces of Silver needed to equal the value of one ounce of Gold, may help to determine the relative valuation between both metals. Some investors may consider a high ratio as an indicator that Silver is undervalued, or Gold is overvalued. On the contrary, a low ratio might suggest that Gold is undervalued relative to Silver.
Spot Gold saw little action at the beginning of the week, with the bright metal stuck around $2,660 a troy ounce. The US Dollar (USD) finds near-term demand in a cautious mood ahead of central banks’ announcements. In the upcoming days, the United States (US) Federal Reserve (Fed), the Bank of England (BoE) and the Bank of Japan (BoJ) will have monetary policy meetings and decide on interest rates while hinting at what 2025 could bring to the table.
The Fed is widely expected to cut the benchmark rate by 25 basis points (bps), completing a 100 bps trim in 2024. The movement has been long ago priced in, which means the focus will be on the Summary of Economic Projections (SEP) or dot plot, in which policymakers detail their expectations on inflation, growth, rates and employment. Any change to what officials were seeing back in September will have an impact on the USD.
In the meantime, S&P Global published the preliminary estimates of the December Purchasing Managers Indexes (PMIs) for most major economies. The US report showed a solid improvement in services output, as the index printed at 58.5, much better than the 55.7 expected and the previous 56.1. The Manufacturing PMI, on the contrary, contracted to 48.3 from the 49.7 posted in November, also missing the expected 49.4.
Coming up next, the Asian macroeconomic calendar will have nothing relevant to offer, yet the United Kingdom (UK) will release the monthly employment report while Canada will release the November Consumer Price Index (CPI). Finally, the US will publish November Retail Sales on Tuesday.
From a technical point of view, the daily chart for XAU/USD shows it is seesawing around its opening while confined to a tight range. The same chart shows the pair is unable to clearly overcome a flat 20 Simple Moving Average (SMA), while technical indicators remain flat within neutral levels. The 100 and 200 SMAs maintain their upward slopes below the current level, limiting the Gold’s bearish potential.
In the near term, and according to the 4-hour chart, the risk skews to the downside. The pair is finding intraday buyers around converging and flat 100 and 200 SMAs. The 20 SMA turned gains downward traction above the longer ones, indicating mounting selling pressure. Finally, technical indicators resumed their slides within negative levels, in line with a continued slide in the upcoming sessions.
Support levels: 2,643.40 2,630.20 2,617.90
Resistance levels: 2,657.30, 2,672.70 2,689.00
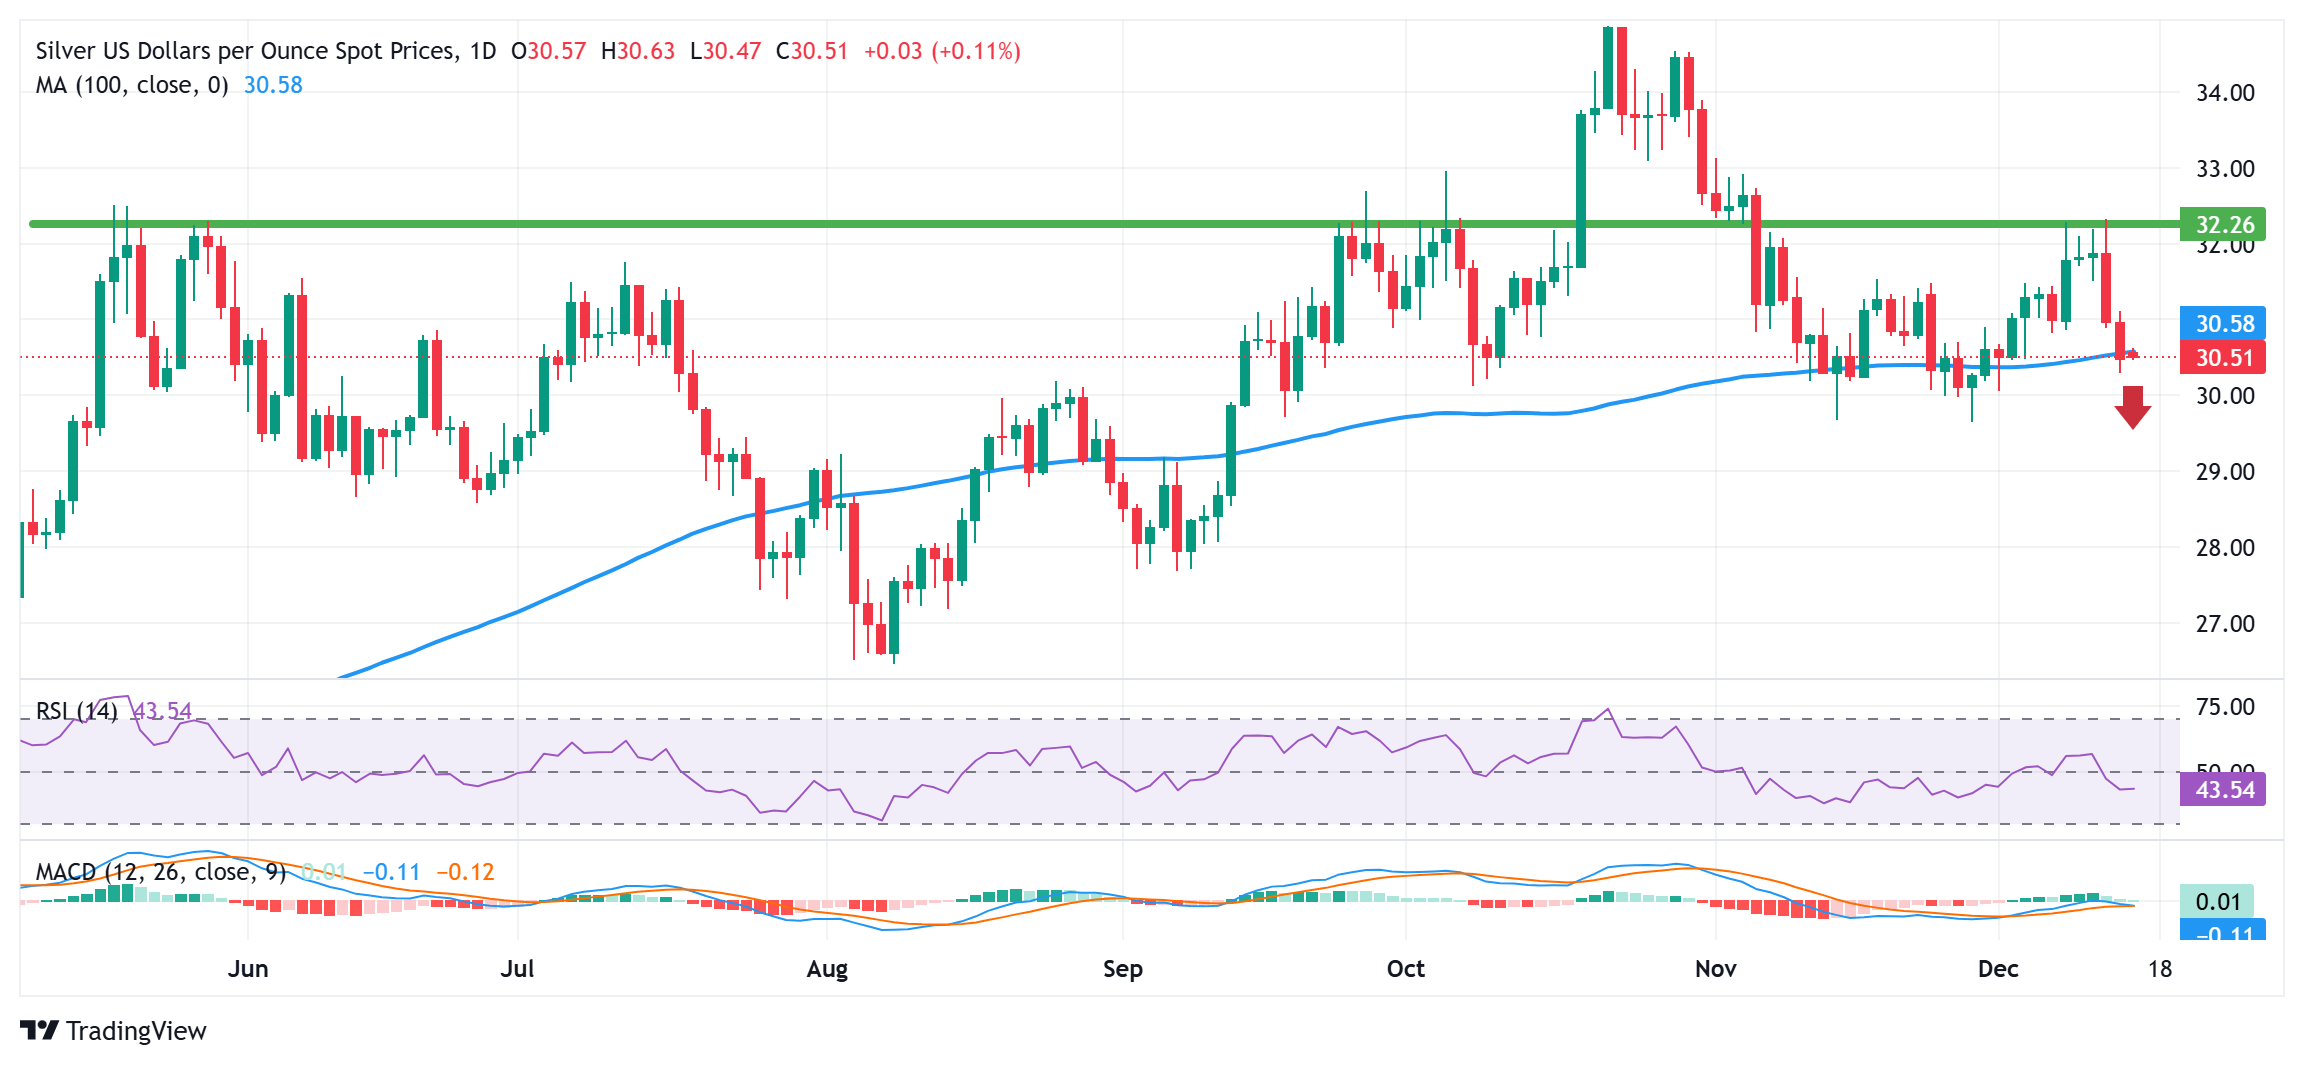
Silver (XAG/USD) kicks off the new week on a subdued note and consolidates last week’s retracement slide from or over a one-month high. The white metal remains close to a two-week low touched Friday and trades around the $30.55 region, or the 100-day Simple Moving Average (SMA), during the Asian session.
From a technical perspective, acceptance below the 100-day SMA will be seen as a fresh trigger for bearish traders against the backdrop of last week’s failure near the $32.35 horizontal resistance. Given that oscillators on the daily chart have just started gaining negative traction, the XAG/USD might then turn vulnerable to weaken further below the $30.00 psychological mark and test November lows, around the $29.70-$29.65 region.
Some follow-through selling should pave the way for an extension of the downward trajectory towards the $29.10-$29.00 support zone en route to the $28.40-$28.35 region before the XAG/USD eventually drops to the $28.00 round figure.
On the flip side, any meaningful recovery attempt now seems to confront stiff resistance and remain capped near the $31.00 mark. A sustained strength beyond, however, could trigger a short-covering rally and lift the XAG/USD towards the $31.75 horizontal barrier. The momentum could extend further towards the $32.00 round figure en route to the monthly swing high, around the $32.35 horizontal zone touched last week.
Silver is a precious metal highly traded among investors. It has been historically used as a store of value and a medium of exchange. Although less popular than Gold, traders may turn to Silver to diversify their investment portfolio, for its intrinsic value or as a potential hedge during high-inflation periods. Investors can buy physical Silver, in coins or in bars, or trade it through vehicles such as Exchange Traded Funds, which track its price on international markets.
Silver prices can move due to a wide range of factors. Geopolitical instability or fears of a deep recession can make Silver price escalate due to its safe-haven status, although to a lesser extent than Gold’s. As a yieldless asset, Silver tends to rise with lower interest rates. Its moves also depend on how the US Dollar (USD) behaves as the asset is priced in dollars (XAG/USD). A strong Dollar tends to keep the price of Silver at bay, whereas a weaker Dollar is likely to propel prices up. Other factors such as investment demand, mining supply – Silver is much more abundant than Gold – and recycling rates can also affect prices.
Silver is widely used in industry, particularly in sectors such as electronics or solar energy, as it has one of the highest electric conductivity of all metals – more than Copper and Gold. A surge in demand can increase prices, while a decline tends to lower them. Dynamics in the US, Chinese and Indian economies can also contribute to price swings: for the US and particularly China, their big industrial sectors use Silver in various processes; in India, consumers’ demand for the precious metal for jewellery also plays a key role in setting prices.
Silver prices tend to follow Gold’s moves. When Gold prices rise, Silver typically follows suit, as their status as safe-haven assets is similar. The Gold/Silver ratio, which shows the number of ounces of Silver needed to equal the value of one ounce of Gold, may help to determine the relative valuation between both metals. Some investors may consider a high ratio as an indicator that Silver is undervalued, or Gold is overvalued. On the contrary, a low ratio might suggest that Gold is undervalued relative to Silver.
Silver struggles to gain any meaningful traction on Monday and languishes near a two-week low.
Bears await a sustained break and acceptance below the 100-day SMA before placing fresh bets.
Any attempted recovery might be seen as a selling opportunity and is likely to remain capped.
Silver (XAG/UD) kicks off the new week on a subdued note and consolidates last week’s retracement slide from or over a one-month high. The white metal remains close to a two-week low touched Friday and trades around the $30.55 region, or the 100-day Simple Moving Average (SMA), during the Asian session.
From a technical perspective, acceptance below the 100-day SMA will be seen as a fresh trigger for bearish traders against the backdrop of last week’s failure near the $32.35 horizontal resistance. Given that oscillators on the daily chart have just started gaining negative traction, the XAG/USD might then turn vulnerable to weaken further below the $30.00 psychological mark and test November lows, around the $29.70-$29.65 region.
Some follow-through selling should pave the way for an extension of the downward trajectory towards the $29.10-$29.00 support zone en route to the $28.40-$28.35 region before the XAG/USD eventually drops to the $28.00 round figure.
On the flip side, any meaningful recovery attempt now seems to confront stiff resistance and remain capped near the $31.00 mark. A sustained strength beyond, however, could trigger a short-covering rally and lift the XAG/USD towards the $31.75 horizontal barrier. The momentum could extend further towards the $32.00 round figure en route to the monthly swing high, around the $32.35 horizontal zone touched last week.
Silver is a precious metal highly traded among investors. It has been historically used as a store of value and a medium of exchange. Although less popular than Gold, traders may turn to Silver to diversify their investment portfolio, for its intrinsic value or as a potential hedge during high-inflation periods. Investors can buy physical Silver, in coins or in bars, or trade it through vehicles such as Exchange Traded Funds, which track its price on international markets.
Silver prices can move due to a wide range of factors. Geopolitical instability or fears of a deep recession can make Silver price escalate due to its safe-haven status, although to a lesser extent than Gold’s. As a yieldless asset, Silver tends to rise with lower interest rates. Its moves also depend on how the US Dollar (USD) behaves as the asset is priced in dollars (XAG/USD). A strong Dollar tends to keep the price of Silver at bay, whereas a weaker Dollar is likely to propel prices up. Other factors such as investment demand, mining supply – Silver is much more abundant than Gold – and recycling rates can also affect prices.
Silver is widely used in industry, particularly in sectors such as electronics or solar energy, as it has one of the highest electric conductivity of all metals – more than Copper and Gold. A surge in demand can increase prices, while a decline tends to lower them. Dynamics in the US, Chinese and Indian economies can also contribute to price swings: for the US and particularly China, their big industrial sectors use Silver in various processes; in India, consumers’ demand for the precious metal for jewellery also plays a key role in setting prices.
Silver prices tend to follow Gold’s moves. When Gold prices rise, Silver typically follows suit, as their status as safe-haven assets is similar. The Gold/Silver ratio, which shows the number of ounces of Silver needed to equal the value of one ounce of Gold, may help to determine the relative valuation between both metals. Some investors may consider a high ratio as an indicator that Silver is undervalued, or Gold is overvalued. On the contrary, a low ratio might suggest that Gold is undervalued relative to Silver.
The Gold price (XAU/USD) trades flat around $2,650 during the early Asian session on Monday. However, strong central bank buying and ongoing geopolitical tensions in the Middle East could underpin the precious metal in the near term. Investors await the preliminary US December Purchasing Managers Index (PMI) for fresh impetus, which is due later on Monday.
Significant demand from central banks lifts the yellow metal price. Central banks have been net buyers of gold for nearly 15 years, emphasizing its value as a crisis hedge and a reliable reserve asset. According to the World Gold Council, the precious metal is expected to rise modestly in 2025 due to central bank actions, geopolitical tensions, and economic conditions in key markets like the US, China, and India.
On Sunday, Israel’s government approved a plan to double its population in the occupied Golan Heights, citing threats from Syria, per Reuters. Any signs of escalating geopolitical tensions in this region could boost a flight to safe assets, benefiting the Gold price.
On the flip side, US President-elect Donald Trump’s tariff plan would stoke further inflation and delay the Federal Reserve (Fed) easing policy. Additionally, the robust US economy could lift the US Dollar (USD) and undermine the USD-denominated commodity price as it increases the opportunity cost of holding non-yielding bullion. “Generally speaking, we see a stronger U.S. economy next year, which should leave less room for rate cuts and should thus bring less tailwinds for gold,” said Carsten Menke, an analyst at Julius Baer.
Gold traders will closely watch the Fed meeting on Wednesday, which is anticipated to cut the interest rates by 25 basis points (bps). The attention will be on Chair Jerome Powell’s speech, as it might offer some hints about US monetary policy for 2025.
Gold has played a key role in human’s history as it has been widely used as a store of value and medium of exchange. Currently, apart from its shine and usage for jewelry, the precious metal is widely seen as a safe-haven asset, meaning that it is considered a good investment during turbulent times. Gold is also widely seen as a hedge against inflation and against depreciating currencies as it doesn’t rely on any specific issuer or government.
Central banks are the biggest Gold holders. In their aim to support their currencies in turbulent times, central banks tend to diversify their reserves and buy Gold to improve the perceived strength of the economy and the currency. High Gold reserves can be a source of trust for a country’s solvency. Central banks added 1,136 tonnes of Gold worth around $70 billion to their reserves in 2022, according to data from the World Gold Council. This is the highest yearly purchase since records began. Central banks from emerging economies such as China, India and Turkey are quickly increasing their Gold reserves.
Gold has an inverse correlation with the US Dollar and US Treasuries, which are both major reserve and safe-haven assets. When the Dollar depreciates, Gold tends to rise, enabling investors and central banks to diversify their assets in turbulent times. Gold is also inversely correlated with risk assets. A rally in the stock market tends to weaken Gold price, while sell-offs in riskier markets tend to favor the precious metal.
The price can move due to a wide range of factors. Geopolitical instability or fears of a deep recession can quickly make Gold price escalate due to its safe-haven status. As a yield-less asset, Gold tends to rise with lower interest rates, while higher cost of money usually weighs down on the yellow metal. Still, most moves depend on how the US Dollar (USD) behaves as the asset is priced in dollars (XAU/USD). A strong Dollar tends to keep the price of Gold controlled, whereas a weaker Dollar is likely to push Gold prices up.
The U.S. Energy Information Administration (EIA) lowered its 2024 and 2025 Brent spot price forecast in its latest short term energy outlook (STEO), which was released this week.
According to its December STEO, the EIA now sees the Brent spot price averaging $80.49 per barrel in 2024 and $73.58 per barrel in 2025. The EIA’s previous STEO, which was released in November, projected that the Brent spot price would average $80.95 per barrel this year and $76.06 per barrel next year.
A quarterly breakdown included in the EIA’s December STEO showed that the organization expects the Brent spot price to average $74.37 per barrel in the fourth quarter of this year, $74.00 per barrel in the first quarter of next year, $74.33 per barrel in the second quarter, $74.00 per barrel in the third quarter, and $72.00 per barrel in the fourth quarter of 2025.
In its previous STEO, the EIA forecast that the Brent spot price would come in at $76.20 per barrel in the fourth quarter of this year, $78.00 per barrel in the first quarter of 2025, $77.67 per barrel in the second quarter, $75.67 per barrel in the third quarter, and $73.02 per barrel in the fourth quarter.
Both STEOs put the 2023 Brent spot price at $82.41 per barrel.
“The Brent crude oil spot price averaged $74 per barrel in November, $1 less than the average in October,” the EIA noted in its December STEO.
“Crude oil prices fell slightly in November following a ceasefire between Israel and Hezbollah in Lebanon. The ceasefire removed some of the risk premium present in oil prices, which had reflected the potential for attacks on oil infrastructure and a disruption to oil supplies,” it added.
“In addition, signs of weakening global oil demand growth, primarily centered on slowing oil demand growth in China, continued to weigh on prices,” it continued.
In its latest STEO, the EIA also highlighted that, last week, some OPEC+ countries “agreed to delay production increases that were set to begin in January 2025 until April 2025” and OPEC+ “announced production targets through 2026”.
“Our forecast assumes OPEC+ will generally raise production in line with the new target levels through much of 2025, as the announced targets align with the production that we expect will keep oil markets relatively balanced next year,” the EIA said in its December STEO.
“We expect global oil inventories will end 2025 near their current volume. We estimate that ongoing OPEC+ production cuts have contributed to global oil inventory withdrawals of about 0.4 million barrels per day on average in 2024, and we expect that the extension of OPEC+ production cuts will cause inventories to fall by 0.7 million barrels per day the first quarter of 2025,” it added.
“However, we expect the subsequent ramp up in OPEC+ production and continued supply growth outside of OPEC+ will lead to an average inventory build of 0.1 million barrels per day over the remainder of 2025,” it went on to state.
The EIA said in its latest STEO that it forecasts that inventory builds will put some downward pressure on crude oil prices later in 2025, “with Brent falling from an average of $74 per barrel in 1Q25 to an average of $72 per barrel in 4Q25”.
The organization also warned in its December STEO that it continues to see “at least two main sources of price uncertainty”. These are “the course of the ongoing Middle East conflict and OPEC+ members’ willingness to adhere to voluntary production cuts”, the EIA highlighted in the STEO.
“The volatility and risk premium associated with the conflict in the Middle East moderated in recent weeks before prices increased again on December 9 following Syrian President Bashar al-Assad’s ouster,” the EIA said in its latest STEO.
“An escalation in the regional conflict has potential to reduce oil supplies, and regional political uncertainty can increase the risk premium,” it added.
“Second, although we assess that OPEC+ producers will likely continue to limit production below recently announced targets in 2025, the potential for weakening commitment among OPEC+ producers to continue cutting production adds downside risk to oil prices,” it continued.
A research note sent to Rigzone by the JPM Commodities Research team on December 6 showed that J.P. Morgan expects the Brent Crude price to average $80 per barrel in 2024 and $73 per barrel in 2025.
That note showed that the company sees the commodity averaging $74 per barrel across the fourth quarter of 2024 and the first quarter of 2025, $77 per barrel in the second quarter of next year, $73 per barrel in the third quarter, and $69 per barrel in the fourth quarter.
“Our view on oil shifts from neutral to outright bearish,” J.P. Morgan analysts stated in the note.
“Brent crude oil price is projected to average $80 per barrel in 2024 – $2 below our expectations from last June – before slipping to $73 in 2025 and $61 in 2026,” they added.
A report sent to Rigzone by Standard Chartered Bank Commodities Research Head Paul Horsnell this week showed that the bank expects the ICE Brent nearby future crude oil price to average $89 per barrel in the first quarter of next year, $92 per barrel in the second quarter, $95 per barrel in the third quarter, $93 per barrel in the fourth quarter, and $92 per barrel overall in 2025.
“We forecast a 2025 global demand increase of 1.31 million barrels per day, with non-OPEC supply growth of 0.96 million barrels per day,” Standard Chartered analysts, including Horsnell, said in the report.
“Our model puts the Q1 balance as a draw of 0.2 million barrels per day … Our overall projected balance for 2025 is a draw of 0.1 million barrels per day, even if there are no reductions in export flows from Iran during the year,” they added.
To contact the author, email andreas.exarheas@rigzone.com