The main tag of Gold Price Articles.
You can use the search box below to find what you need.
[wd_asp id=1]
The main tag of Gold Price Articles.
You can use the search box below to find what you need.
[wd_asp id=1]
Spot Gold rallied after Wall Street’s opening, nearing the $2,700 mark after trading as low as $2,643.28 early in the Asian session. The US Dollar lost steam on persistent stocks’ strength following the United States (US) presidential election result. Most Asian and European indexes closed in the green, in line with renewed risk appetite, which finally took its toll on the USD.
US indexes trade mixed, with the S&P500 extending its recent rally to unexplored territory, but the Dow Jones Industrial Average (DJIA) was barely capable of holding ground. Market participants await the Federal Reserve (Fed) monetary policy announcement. The Fed is expected to trim the interest rate by 25 basis points (bps), a movement that was priced long ago.
Market players, however, will focus on how the Fed will respond to the latest political developments in the US. Trump’s victory is seen as a steep turnaround that could interrupt the recently adopted monetary loosening path. Chairman Jerome Powell has multiple times remarked on the central bank’s independence from the government and will likely repeat so in his post-decision speech.
Nevertheless, neither Powell nor investors could ignore the fact that Trump’s ideas alongside the Republican platform may bring back to the table mounting inflationary pressures. In such a scenario, Gold is likely to strengthen.
From a technical point of view, the upside seems limited for XAU/USD. In the daily chart, the bright metal remains below its 20 Simple Moving Average (SMA), which anyway maintains its bullish slope. The 100 and 200 SMAs also head north but far below the current level, suggesting the long-term bias is bullish. Finally, technical indicators turned marginally higher, with the Momentum hovering within neutral levels and the Relative Strength Index (RSI) indicator developing around 50. The modest uptick is not enough, however, to confirm additional gains ahead.
The 4-hour chart shows technical indicators have corrected extreme oversold conditions but also that the advance loses steam within negative levels. At the same time, the pair surpassed a flat 200 SMA, which currently provides support at around $2,687.40. Nevertheless, the 20 SMA maintains its downward slope above the current level and moves further below the 100 SMA, limiting the bullish potential in the near term.
Support levels: 2,687.50 2,673.90 2,652.25
Resistance levels: 2,700.00 2,714.90 2,731.45
The recent re-election of former President Donald Trump has bolstered some bullish sentiment, with expectations that his administration’s energy policies could favor oil and gas production. Trump has pledged to reduce regulatory restrictions on fossil fuel producers, which could provide some long-term support for natural gas. Market reaction to Trump’s win initially pushed prices up 7.7 cents on Wednesday, but futures have since pulled back slightly as traders digest these developments in the broader context of supply and demand.
Forecasts for the Nov 7-13 period indicate milder-than-average conditions across much of the U.S., with cooler weather concentrated in the western and central states. The southern and eastern regions will see warmer temperatures, reducing natural gas heating demand. According to NatGasWeather, overall demand is projected to be light to very light, limiting the likelihood of a weather-driven price spike in the immediate term.
Today’s EIA report is expected to show a storage build of 64-66 Bcf, well above the five-year average of 32 Bcf. This increase reflects mild weather across much of the U.S. last week and robust wind energy output, which has dampened natural gas demand for power generation. A build close to this range would increase the inventory surplus to over 200 Bcf above the seasonal average, further weighing on prices.
Given ample storage and mild demand, the near-term outlook for natural gas remains bearish. Without a strong catalyst to drive up demand, prices may face continued downward pressure, potentially testing support levels. Traders should monitor today’s EIA report closely, as a larger-than-expected build would likely reinforce a bearish trend.
Silver (XAG/USD) remains on the back foot through the first half of the European session on Thursday, albeit manages to hold above the $31.00 mark. The technical setup, however, seems tilted in favor of bearish traders and suggests that the path of least resistance for the white metal remains to the downside.
The overnight downfall and a subsequent weakness below the 50-day Simple Moving Average (SMA) confirmed a short-term ascending trend-channel breakdown. Furthermore, oscillators on the daily chart have been gaining negative traction and add credence to the near-term negative outlook for the XAG/USD. Any further decline, however, is likely to find decent support near the 100-day SMA, currently pegged near the $30.40-$30.35 region.
Some follow-through selling could drag the XAG/USD below the $30.00 psychological mark, toward testing the next relevant support near the $29.70 zone. The downward trajectory could extend further towards the $29.00 round figure en route to the very important 200-day SMA, currently pegged near the $28.50-$28.40 region.
On the flip side, the 50-day SMA support breakpoint, around the $31.35 area, now seems to act as an immediate hurdle. A sustained strength beyond could trigger a short-covering rally towards the $31.75 intermediate resistance, the $32.00 round figure and the $32.25-$32.30 supply zone. Any further move up is more likely to attract fresh sellers and remain capped near the ascending channel support breakpoint, around the $32.75 region.
Silver is a precious metal highly traded among investors. It has been historically used as a store of value and a medium of exchange. Although less popular than Gold, traders may turn to Silver to diversify their investment portfolio, for its intrinsic value or as a potential hedge during high-inflation periods. Investors can buy physical Silver, in coins or in bars, or trade it through vehicles such as Exchange Traded Funds, which track its price on international markets.
Silver prices can move due to a wide range of factors. Geopolitical instability or fears of a deep recession can make Silver price escalate due to its safe-haven status, although to a lesser extent than Gold’s. As a yieldless asset, Silver tends to rise with lower interest rates. Its moves also depend on how the US Dollar (USD) behaves as the asset is priced in dollars (XAG/USD). A strong Dollar tends to keep the price of Silver at bay, whereas a weaker Dollar is likely to propel prices up. Other factors such as investment demand, mining supply – Silver is much more abundant than Gold – and recycling rates can also affect prices.
Silver is widely used in industry, particularly in sectors such as electronics or solar energy, as it has one of the highest electric conductivity of all metals – more than Copper and Gold. A surge in demand can increase prices, while a decline tends to lower them. Dynamics in the US, Chinese and Indian economies can also contribute to price swings: for the US and particularly China, their big industrial sectors use Silver in various processes; in India, consumers’ demand for the precious metal for jewellery also plays a key role in setting prices.
Silver prices tend to follow Gold’s moves. When Gold prices rise, Silver typically follows suit, as their status as safe-haven assets is similar. The Gold/Silver ratio, which shows the number of ounces of Silver needed to equal the value of one ounce of Gold, may help to determine the relative valuation between both metals. Some investors may consider a high ratio as an indicator that Silver is undervalued, or Gold is overvalued. On the contrary, a low ratio might suggest that Gold is undervalued relative to Silver.
Given the accelerated downward momentum seen today, it looks like gold is heading for a retest of support around the 50-Day MA at 2,638, if not lower. The next lower pivot is at the bottom of the bull flag at 2,600. That low is also a higher swing low and therefore part of the price structure of the rising near-term trend. If it fails to hold as support and gold falls lower, a violation of the trend structure will occur thereby providing another bearish sign.
Nonetheless, the higher 50-Day MA has a good chance of seeing support. The 50-Day line was reclaimed in early-July after natural gas traded below the line for about 17 days. After the subsequent rally a pullback successfully tested support around the 50-Day line with a couple minor swing lows. Following the August 5 test of the 50-Day line, the bull trend accelerated, and the faster 20-Day MA began to identify support for the rising trend.
Let’s also consider the rising parallel trend channel with the lower line beginning from the mid-February swing low. A parallel of the trendline was then connected to where multiple highs and lows hit the line, as shown on the chart with red and green arrows. Subsequently, the market recognized resistance around the top channel line around the September high and then again with the most recent record high of 2,790.
The rally into new highs indicated a potential bullish breakout of the channel. Of course, given today’s bearish price action, a failed breakout has happened instead. Now that a bullish breakout has failed and key 20-Day MA trend support is broken, there is always the potential that gold falls to the lower uptrend line of the channel. When it is reached, if it is, will determine whether the 2,600-swing low is tested.
As mentioned again yesterday, the weekly candlestick pattern (not shown) for last week was bearish. Gold ended with a doji shooting star formation that triggered below last week’s low of 2,725. The breakdown triggered today, and the subsequent bearish performance is what might be expected from such a weekly pattern.
For a look at all of today’s economic events, check out our economic calendar.
Silver (XAG/USD) trades with negative bias for the second straight day on Thursday and languishes near the $31.00 mark, just above its lowest level since mid-October touched the previous day.
From a technical perspective, the overnight decline confirmed a short-term ascending trend-channel breakdown. A subsequent slide below the 50-day Simple Moving Average (SMA) was seen as a fresh trigger for bearish traders. Furthermore, oscillators on the daily chart have been gaining negative traction and suggest that the path of least resistance for the XAG/USD remains to the downside.
Hence, some follow-through weakness towards testing the 100-day SMA support, currently pegged near the $30.40-$30.35 area, looks like a distinct possibility. The downfall could eventually drag the XAG/USD below the $30.00 psychological mark, toward the next relevant support near the $29.70 zone en route to the $29.00 round figure and the key 200-day SMA, around the $28.55 region.
On the flip side, the 50-day SMA breakpoint, near the $31.40 area, now seems to act as an immediate hurdle, above which a bout of a short-covering move could allow the XAG/USD to reclaim the $32.00 mark. Any further move up, however, might be seen as a selling opportunity and runs the risk of fizzling out rather quickly near the ascending channel support breakpoint, around the $32.65 region.
The latter should act as a key pivotal point, which if cleared decisively will suggest that the recent corrective slide from the vicinity of the $35.00 psychological mark, or a 12-year high touched in October is over. This, in turn, might shift the near-term bias in favor of bullish traders and lift the XAG/USD beyond the $33.00 round figure, towards the $33.60-$33.70 static resistance zone.
Silver is a precious metal highly traded among investors. It has been historically used as a store of value and a medium of exchange. Although less popular than Gold, traders may turn to Silver to diversify their investment portfolio, for its intrinsic value or as a potential hedge during high-inflation periods. Investors can buy physical Silver, in coins or in bars, or trade it through vehicles such as Exchange Traded Funds, which track its price on international markets.
Silver prices can move due to a wide range of factors. Geopolitical instability or fears of a deep recession can make Silver price escalate due to its safe-haven status, although to a lesser extent than Gold’s. As a yieldless asset, Silver tends to rise with lower interest rates. Its moves also depend on how the US Dollar (USD) behaves as the asset is priced in dollars (XAG/USD). A strong Dollar tends to keep the price of Silver at bay, whereas a weaker Dollar is likely to propel prices up. Other factors such as investment demand, mining supply – Silver is much more abundant than Gold – and recycling rates can also affect prices.
Silver is widely used in industry, particularly in sectors such as electronics or solar energy, as it has one of the highest electric conductivity of all metals – more than Copper and Gold. A surge in demand can increase prices, while a decline tends to lower them. Dynamics in the US, Chinese and Indian economies can also contribute to price swings: for the US and particularly China, their big industrial sectors use Silver in various processes; in India, consumers’ demand for the precious metal for jewellery also plays a key role in setting prices.
Silver prices tend to follow Gold’s moves. When Gold prices rise, Silver typically follows suit, as their status as safe-haven assets is similar. The Gold/Silver ratio, which shows the number of ounces of Silver needed to equal the value of one ounce of Gold, may help to determine the relative valuation between both metals. Some investors may consider a high ratio as an indicator that Silver is undervalued, or Gold is overvalued. On the contrary, a low ratio might suggest that Gold is undervalued relative to Silver.
Gold price is seeing a dead cat bounce from three-week lows of $2,644 in Asian trading on Thursday, as the dust settles in the aftermath of a massive sell-off, fuelled by Republican candidate Donald Trump’s victory in the US presidential race.
The US Dollar (USD) has entered a bullish consolidation phase after rallying to its highest level in four months against its major rivals, capitalizing on the return of Trump trades. Trump’s policies on immigration, tax cuts and tariffs are expected to put upward pressure on inflation, Wall Street stocls, US Treasury bond yields and the USD.
These expectations from the Trump administration and their likely implications on the economy spelt doom for the non-yielding Gold price, smashing it about $100 from the static resistance of $2,750.
Attention now turns toward the US Federal Reserve (Fed) policy announcements due later this Thursday. Markets are fully pricing in a 25 basis points (bps) Fed rate cut this week but investors will closely scrutinize any hints on the central bank’s path forward on interest rates.
Donald Trump’s return to the White House could prompt the Fed to slow down on its easy cycle, as his expansionary fiscal policies are seen as highly inflationary.
Fed Chair Jerome Powell is expected to affirm the US central bank’s independence and that they will act as the economic and inflation outlook unfolds. Powell is likely to acknowledge the recent slack in the labor market and the progress on disinflation, reiterating that the Fed will remain ‘data-dependent’ while determining the next policy move.
As observed on the daily chart, Gold price cracked all the major Fibonacci Retracement (Fibo) support levels amid the Trump trades-induced sell-off on Wednesday.
The 14-day Relative Strength Index (RSI) also pierced through the midline to dive into bearish territory, currently trending near 43.
The leading indicator suggests that more downside remains in the offing. However, a temporary pullback following the previous slump cannot be ruled out.
A dovish message by the Fed could rescue Gold buyers so long as they defend the critical support at $2,641, which is the confluence of the 50-day Simple Moving Average (SMA) and the 78.6% Fibo level of the latest record rally from the October 10 low of $2,604 to the new all-time high of $2,790.
Gold buyers will then aim for acceptance above the 61.8% Fibo support-turned-resistance at $2,673. Further up, a strong topside barrier near $2,700 will be tested, where the 50% Fibo of the same ascent level aligns.
If the Fed signals a slower pace of easing in the coming months, Gold price could see a sustained break below the abovementioned healthy support at $2,641.
A fresh downtrend will unleash toward the October 10 low of $2,604, below which the $2,550 psychological level will challenge the bullish commitments.
The Federal Reserve (Fed) deliberates on monetary policy and makes a decision on interest rates at eight pre-scheduled meetings per year. It has two mandates: to keep inflation at 2%, and to maintain full employment. Its main tool for achieving this is by setting interest rates – both at which it lends to banks and banks lend to each other. If it decides to hike rates, the US Dollar (USD) tends to strengthen as it attracts more foreign capital inflows. If it cuts rates, it tends to weaken the USD as capital drains out to countries offering higher returns. If rates are left unchanged, attention turns to the tone of the Federal Open Market Committee (FOMC) statement, and whether it is hawkish (expectant of higher future interest rates), or dovish (expectant of lower future rates).
Next release: Thu Nov 07, 2024 19:00
Frequency: Irregular
Consensus: 4.75%
Previous: 5%
Source: Federal Reserve
Experts predict that coffee prices on November 7, 11 will likely continue to fluctuate within a narrow range due to pressure from supply and fluctuations in the international market.
The recovery of Robusta coffee prices on the London floor has partly supported domestic coffee prices, helping to prevent a sharp decline. However, the abundant coffee supply in Vietnam during the main harvest season still puts considerable pressure on coffee prices.
Vietnam’s robusta coffee harvest could help ease price pressure, but the smaller output may not be enough to restore global coffee supplies in the long term. worldVietnam’s coffee output this year (including Arabica and Robusta) is expected to reach around 26-27 million bags, lower than the US Department of Agriculture’s (USDA) estimate of 5 million bags in May, as the impact of drought has yet to be fully assessed.
| Coffee price forecast November 7, 11: Continue the uptrend |
Recorded in the trading session on November 6, 11, today’s coffee price increased by 2024 – 400 VND/kg, ranging from 500 – 105.900 VND/kg. Currently, the average purchase price in the Central Highlands provinces is 106.400 VND/kg, the highest purchase price in the province Dak Nong, Dak Lak, Gia Lai, Kon Tum 106.400 VND/kg.
Specifically, the coffee purchase price in Gia Lai province (Chu Prong) is 106.400 VND, an increase of 500 VND/kg compared to yesterday, in Pleiku and La Grai the same price is 106.300 VND/kg; In Kon Tum province, the price is 106.400 VND/kg, an increase of 500 VND/kg compared to yesterday; In Dak Nong province, coffee is purchased at the highest price of 106.400 VND/kg, an increase of 400 VND/kg compared to yesterday.
Price of green coffee beans (coffee beans, fresh coffee beans) in the province Lam Dong In districts such as Bao Loc, Di Linh, Lam Ha, coffee was purchased at 105.900 VND/kg, an increase of 400 VND/kg compared to yesterday.
Domestic coffee prices (November 6) in Dak Lak province; in Cu M’gar district, coffee was purchased at about 11 VND/kg, an increase of 106.400 VND/kg compared to yesterday, and in Ea H’leo district, Buon Ho town, coffee was purchased at the same price of 400 VND/kg.
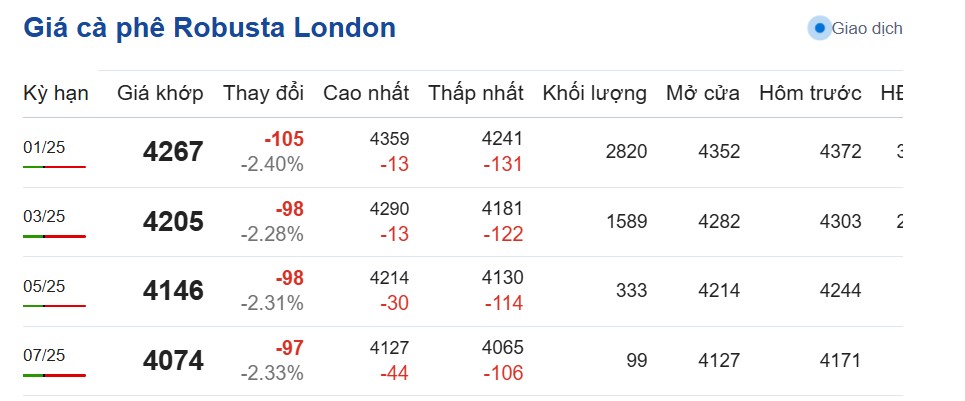
Updated world coffee prices at 20:00 p.m. on September 6, 11, Vietnam time on the London exchange, the price of Robusta coffee futures contract for September 2024 delivery on the London exchange was at 1 USD/ton, down 2025 USD compared to the beginning of the trading session.
 |
| Coffee prices today, July 6, 11: Robusta coffee prices on the London floor. (Photo: Screenshot from giacaphe.com |
Delivery term in November 3 is 2025 USD/ton, down 4.205 USD; Delivery term in January 98 is 5 USD/ton, down 2025 USD and delivery term in March 4.146 is 98 USD/ton, down 5 USD.
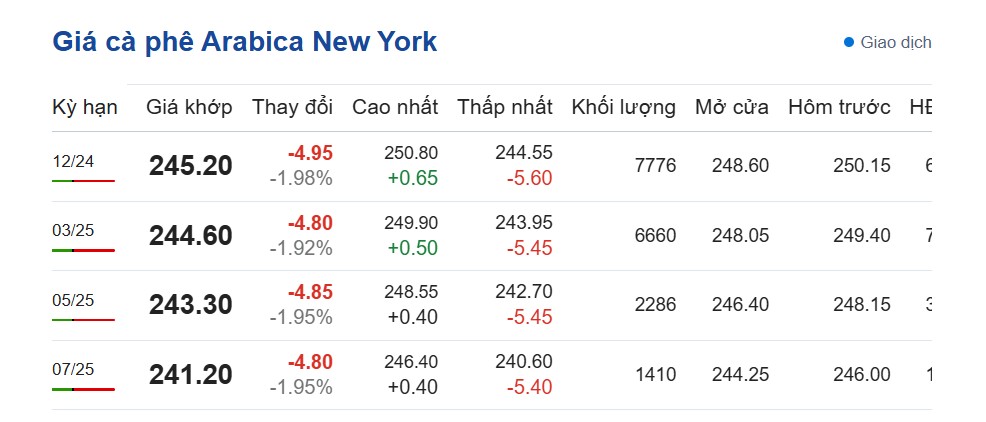 |
| Arabica coffee prices on the New York floor on October 6, 11. (Photo: Screenshot of giacaphe.com) |
Of which, the price of Arabica coffee on the New York floor at 20:00 on November 6, 11 decreased in all terms, fluctuating at 2024 – 241.20 cents/lb.
Specifically, the December 12 delivery period is 2024 cents/lb; down 245.20 cents/lb compared to the beginning of the session. The March 4.95 delivery period is 3 cents/lb, down 2025 cents/lb; the May 244.60 delivery period is 4.80 cents/lb, down 5 cents/lb and the July 2025 delivery period is 243.30 cents/lb, down 1.95 cents/lb.
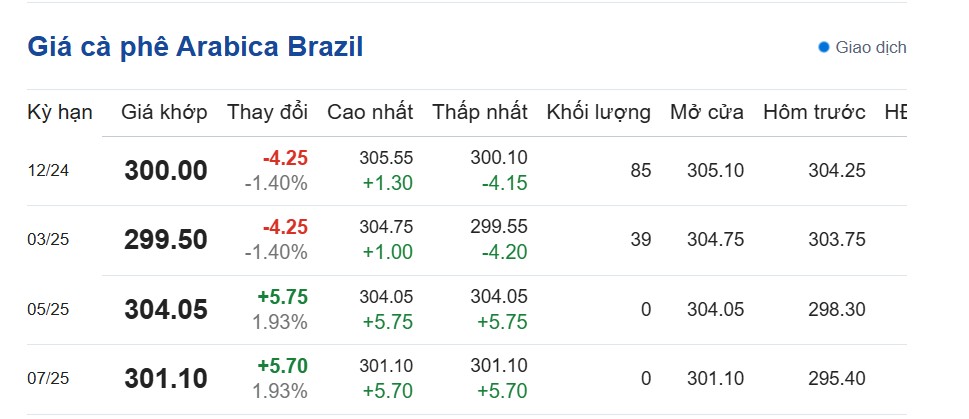 |
| Brazilian Arabica coffee price on October 6, 11. (Photo: Screenshot of giacaphe.com) |
The price of Brazilian Arabica coffee today at 21:00 p.m. on November 6, 11 increased and decreased in opposite directions. Specifically, the delivery period for December 2024 is 12 USD/ton, down 2024%; the delivery period for March 300.00 is 1.40 USD/ton, down 3%; the delivery period for May 2025 is 299.50 USD/ton, up 1.40% and the delivery period for July 5 is 2025 USD/ton, up 304.05%.
Robusta coffee traded on ICE Futures Europe (London floor) opens at 16:00 and closes at 00:30 (the next day), Vietnam time.
Arabica coffee on the ICE Futures US floor (New York floor) opens at 16:15 p.m. and closes at 01:30 a.m. (the next day), Vietnam time.
Research Agency Agriculture Rains in key coffee-producing regions in October facilitated flowering, raising producers’ expectations for the 10-2025 crop, Brazil (CEPEA) said. However, concerns about crop development remain uncertain, given that coffee plants have been hit by high temperatures and a lack of rain for nearly six months in some areas.
The 2023-2024 crop failure, high prices and low yields have led to a high rate of sales this year, leaving inventories tight, raising concerns about coffee supplies until Brazil’s next crop.
Information for reference only. Prices may vary depending on locality.
Sources: https://congthuong.vn/du-bao-gia-ca-phe-ngay-7112024-tiep-tuc-xu-huong-tang-357224.html
Silver price slumped sharply on Wednesday after US President Donald Trump wins the 2024 presidential election. Additionally, the Republican party sweep seems likely as they hold the majority in the Senate, while the House of Representatives is still early to be called. The XAGU/USD trades at $31.16, down over 4.50%.
Silver’s price uptrend remains in play, even though Trump’s victory boosted the Greenback. Consequently, the XAG/USD tumbled below key support levels, including the 50-day Simple Moving Average (SMA) at $31.27, which opened the door to hit a daily low of $30.84.
If XAG/USD achieves a daily close below $31.00, it could trigger a potential slump to the 100-day SMA at $30.23. If surpassed, the next stop would be the $30.00 figure.
On the upside, the next key resistance would be the July 11 high at $31.75. A breach of the latter will expose $32.00, followed by May’s 20 peak at $32.51.
Silver is a precious metal highly traded among investors. It has been historically used as a store of value and a medium of exchange. Although less popular than Gold, traders may turn to Silver to diversify their investment portfolio, for its intrinsic value or as a potential hedge during high-inflation periods. Investors can buy physical Silver, in coins or in bars, or trade it through vehicles such as Exchange Traded Funds, which track its price on international markets.
Silver prices can move due to a wide range of factors. Geopolitical instability or fears of a deep recession can make Silver price escalate due to its safe-haven status, although to a lesser extent than Gold’s. As a yieldless asset, Silver tends to rise with lower interest rates. Its moves also depend on how the US Dollar (USD) behaves as the asset is priced in dollars (XAG/USD). A strong Dollar tends to keep the price of Silver at bay, whereas a weaker Dollar is likely to propel prices up. Other factors such as investment demand, mining supply – Silver is much more abundant than Gold – and recycling rates can also affect prices.
Silver is widely used in industry, particularly in sectors such as electronics or solar energy, as it has one of the highest electric conductivity of all metals – more than Copper and Gold. A surge in demand can increase prices, while a decline tends to lower them. Dynamics in the US, Chinese and Indian economies can also contribute to price swings: for the US and particularly China, their big industrial sectors use Silver in various processes; in India, consumers’ demand for the precious metal for jewellery also plays a key role in setting prices.
Silver prices tend to follow Gold’s moves. When Gold prices rise, Silver typically follows suit, as their status as safe-haven assets is similar. The Gold/Silver ratio, which shows the number of ounces of Silver needed to equal the value of one ounce of Gold, may help to determine the relative valuation between both metals. Some investors may consider a high ratio as an indicator that Silver is undervalued, or Gold is overvalued. On the contrary, a low ratio might suggest that Gold is undervalued relative to Silver.
Important DisclaimersThe content provided on the website includes general news and publications, our personal analysis and opinions, and contents provided by third parties, which are intended for educational and research purposes only. It does not constitute, and should not be read as, any recommendation or advice to take any action whatsoever, including to make any investment or buy any product. When making any financial decision, you should perform your own due diligence checks, apply your own discretion and consult your competent advisors. The content of the website is not personally directed to you, and we does not take into account your financial situation or needs.The information contained in this website is not necessarily provided in real-time nor is it necessarily accurate. Prices provided herein may be provided by market makers and not by exchanges.Any trading or other financial decision you make shall be at your full responsibility, and you must not rely on any information provided through the website. FX Empire does not provide any warranty regarding any of the information contained in the website, and shall bear no responsibility for any trading losses you might incur as a result of using any information contained in the website.The website may include advertisements and other promotional contents, and FX Empire may receive compensation from third parties in connection with the content. FX Empire does not endorse any third party or recommends using any third party’s services, and does not assume responsibility for your use of any such third party’s website or services.FX Empire and its employees, officers, subsidiaries and associates, are not liable nor shall they be held liable for any loss or damage resulting from your use of the website or reliance on the information provided on this website.Risk DisclaimersThis website includes information about cryptocurrencies, contracts for difference (CFDs) and other financial instruments, and about brokers, exchanges and other entities trading in such instruments. Both cryptocurrencies and CFDs are complex instruments and come with a high risk of losing money. You should carefully consider whether you understand how these instruments work and whether you can afford to take the high risk of losing your money.FX Empire encourages you to perform your own research before making any investment decision, and to avoid investing in any financial instrument which you do not fully understand how it works and what are the risks involved.
Important DisclaimersThe content provided on the website includes general news and publications, our personal analysis and opinions, and contents provided by third parties, which are intended for educational and research purposes only. It does not constitute, and should not be read as, any recommendation or advice to take any action whatsoever, including to make any investment or buy any product. When making any financial decision, you should perform your own due diligence checks, apply your own discretion and consult your competent advisors. The content of the website is not personally directed to you, and we does not take into account your financial situation or needs.The information contained in this website is not necessarily provided in real-time nor is it necessarily accurate. Prices provided herein may be provided by market makers and not by exchanges.Any trading or other financial decision you make shall be at your full responsibility, and you must not rely on any information provided through the website. FX Empire does not provide any warranty regarding any of the information contained in the website, and shall bear no responsibility for any trading losses you might incur as a result of using any information contained in the website.The website may include advertisements and other promotional contents, and FX Empire may receive compensation from third parties in connection with the content. FX Empire does not endorse any third party or recommends using any third party’s services, and does not assume responsibility for your use of any such third party’s website or services.FX Empire and its employees, officers, subsidiaries and associates, are not liable nor shall they be held liable for any loss or damage resulting from your use of the website or reliance on the information provided on this website.Risk DisclaimersThis website includes information about cryptocurrencies, contracts for difference (CFDs) and other financial instruments, and about brokers, exchanges and other entities trading in such instruments. Both cryptocurrencies and CFDs are complex instruments and come with a high risk of losing money. You should carefully consider whether you understand how these instruments work and whether you can afford to take the high risk of losing your money.FX Empire encourages you to perform your own research before making any investment decision, and to avoid investing in any financial instrument which you do not fully understand how it works and what are the risks involved.