The main tag of Gold Price Articles.
You can use the search box below to find what you need.
[wd_asp id=1]
The main tag of Gold Price Articles.
You can use the search box below to find what you need.
[wd_asp id=1]
Spot Gold came under strong selling pressure after Wall Street’s opening, with XAU/USD retreating sharply from record highs and currently trading near a daily low of $2,731.45. A risk-averse mood took over financial markets on Wednesday when United States (US) data showed resilient economic growth and a healthy labour market, cooling interest rate cut expectations.
The Federal Reserve (Fed) will meet next week and announce its decision on monetary policy on Thursday, November 7. Odds for a 25 basis points (bps) interest rate cut are at 94.5%, slightly down from the 95.5% chance a week earlier. Still, market players ponder whether a Republican victory in the upcoming presidential election may force the Fed to slow the pace of loosening.
Meanwhile, the Bank of Japan (BoJ) decided to keep the interest rate target unchanged at 0.25% on Thursday and reiterated its forecast that inflation will persist near the 2% target. The announcement weighed on the Japanese Yen (JPY), providing support to the US Dollar.
Finally, the US reported that Initial Jobless Claims for the week ended October 25 improved to 216K from a revised 228K in the previous week. The country also released the September Personal Consumption Expenditures (PCE) Price Index, the Federal Reserve’s (Fed) favorite inflation gauge. PCE inflation was up 2.1% YoY and 0.2% MoM, as expected, while the core annual reading hit 2.7%, higher than the 2.6% anticipated by market participants.
Asian and European indexes edged sharply lower, leading to a second consecutive day of sharp losses in Wall Street.
The focus now shifts to the US Nonfarm Payrolls (NFP) report, which will be released on Friday. The economy is expected to have added 113K new job positions in October, while the unemployment rate is foreseen steady at 4.1%.
The XAU/USD pair trimmed most of its weekly gains, and the daily chart shows the corrective decline may continue, albeit the pair is far from bearish. In the daily chart, technical indicators retreated sharply from overbought readings and head firmly south above their midlines. At the same time, the pair remains above all its moving averages, which maintain their bullish slopes. The 20 Simple Moving Average (SMA) currently develops at around $2,696.00, providing dynamic support.
In the near term, and according to the 4-hour chart, the risk skews to the downside. XAU/USD broke below its 20 SMA, which lost its bullish strength at around $2,766.00. Nevertheless, the 100 and 200 SMAs keep heading firmly higher, well below the current level. Finally, technical indicators crossed their midlines into negative territory, maintaining their sharp downward slopes, in line with another leg lower.
Support levels: 2,731.45 2,716.90 2,701.70
Resistance levels: 2,747.75 2,760.40 2,772.50
From October 31 through November 6, weather systems are expected to bring cooler temperatures across parts of the western and central U.S., with highs ranging between the 40s and 60s Fahrenheit. Meanwhile, the southern and eastern U.S. will experience milder weather with highs in the 60s to 80s, and occasional peaks in the 90s in isolated areas. These conditions contribute to an overall light demand profile for natural gas this week.
The U.S. Energy Information Administration’s (EIA) weekly natural gas storage report, due later Thursday, is also expected to pressure prices downward. Analysts expect a substantial inventory build, with estimates clustered around an 84 billion cubic feet (Bcf) injection. This projection significantly exceeds the five-year average build of 67 Bcf, underscoring a supply surplus amid mild weather that limited consumption in recent days.
If the EIA confirms a build near 84 Bcf, it would mark a notable increase, pointing to ample supply levels as the market heads into the winter season. With production steady and wind energy contributing robustly to electricity generation, less natural gas is currently needed to meet power demands. The market outlook remains sensitive to inventory levels, with larger-than-average injections creating a bearish outlook as they continue to weigh on prices.
Given the warmer weather outlook, lighter-than-normal demand, and anticipated storage injection above seasonal norms, the short-term outlook for U.S. natural gas prices remains bearish. Unless colder weather patterns emerge, price recovery may be limited in the near term as supply continues to outpace demand. Traders should monitor upcoming weather model updates and next week’s EIA storage data closely, as any significant deviations from current forecasts could drive volatility in either direction.
Silver Prices (XAG/USD) are trading lower for the second consecutive day on Thursday, with price action approaching a key support area at $33.10.following Wednesday’s reversal at the $34.50 area.
The lower high posted on Wednesday and price action breaking below the 4 H 50 SMA suggest that the pair might have reached the end of its bullish cycle and is ready for a corrective reversal.
On the other hand, the US Dollar is showing a moderately bearish tone over the last sessions. This will likely keep precious metals from retreating further until the US PCE prices index and especially Friday’s NFP report are out.
A clear break of the previous resistance, now turned support at the mentioned $33.10 area would confirm that view and add selling pressure towards the 38.6% Fibonacci retracement of the September-October bullish run, at $32.10 ahead of $31.30.
To the upside, resistance levels remain at $34.50, and the long-term high, at $34.85.
Silver is a precious metal highly traded among investors. It has been historically used as a store of value and a medium of exchange. Although less popular than Gold, traders may turn to Silver to diversify their investment portfolio, for its intrinsic value or as a potential hedge during high-inflation periods. Investors can buy physical Silver, in coins or in bars, or trade it through vehicles such as Exchange Traded Funds, which track its price on international markets.
Silver prices can move due to a wide range of factors. Geopolitical instability or fears of a deep recession can make Silver price escalate due to its safe-haven status, although to a lesser extent than Gold’s. As a yieldless asset, Silver tends to rise with lower interest rates. Its moves also depend on how the US Dollar (USD) behaves as the asset is priced in dollars (XAG/USD). A strong Dollar tends to keep the price of Silver at bay, whereas a weaker Dollar is likely to propel prices up. Other factors such as investment demand, mining supply – Silver is much more abundant than Gold – and recycling rates can also affect prices.
Silver is widely used in industry, particularly in sectors such as electronics or solar energy, as it has one of the highest electric conductivity of all metals – more than Copper and Gold. A surge in demand can increase prices, while a decline tends to lower them. Dynamics in the US, Chinese and Indian economies can also contribute to price swings: for the US and particularly China, their big industrial sectors use Silver in various processes; in India, consumers’ demand for the precious metal for jewellery also plays a key role in setting prices.
Silver prices tend to follow Gold’s moves. When Gold prices rise, Silver typically follows suit, as their status as safe-haven assets is similar. The Gold/Silver ratio, which shows the number of ounces of Silver needed to equal the value of one ounce of Gold, may help to determine the relative valuation between both metals. Some investors may consider a high ratio as an indicator that Silver is undervalued, or Gold is overvalued. On the contrary, a low ratio might suggest that Gold is undervalued relative to Silver.
Meanwhile, US Treasury yields fell, boosting demand for non-yielding commodities such as gold and silver. According to gold trading platforms, the rise in gold prices comes ahead of next week’s US presidential election and the Federal Reserve’s policy meeting. Furthermore, gold bulls remained resilient in the face of expectations that bets on interest rate cuts by the Fed will decline.

The US central bank cut interest rates by 50 basis points in September, fuelling expectations of a similar cut in November. However, hotter-than-expected inflation and a resilient US Labor market have since reduced bets on a similar rate cut. According to the CME FedWatch tool, traders are pricing in a 98.9% chance of the Fed cutting rates by 25 basis points at its meeting next week.
The increased uncertainty surrounding the outcome of next week’s US elections has bolstered demand for the safe-haven gold. Polls and analysts expect a close contest between former President Donald Trump and Vice President Kamala Harris. The candidates have outlined different plans for the US economy, which has increased uncertainty about the political scenario in the United States. Investors will be closely monitoring the election results next week as they could shape US policy for the next four years.
Reports on Tuesday highlighted casualties from an airstrike, following recent military actions in the region. These developments have heightened tensions in the Middle East, with analysts noting increased geopolitical risks. This has contributed to the bullish sentiment for the safe-haven XAU/USD pair, despite the strength in US Treasury yields and the US dollar.
Investors will focus on the release of US third-quarter GDP data on Thursday. Also, the jobless claims report will be released on Thursday, which will provide further signals on the health of the US economy. In addition, the US personal consumption expenditure index will be released on Friday. The data is the Federal Reserve’s preferred measure of inflation. US non-farm payrolls data is also scheduled to be released on Friday. If the data points to a resilient US economy, the Federal Reserve may stick to smaller US interest rate cuts in its upcoming meetings. However, any rate cuts bode well for gold as it is a non-yielding asset.
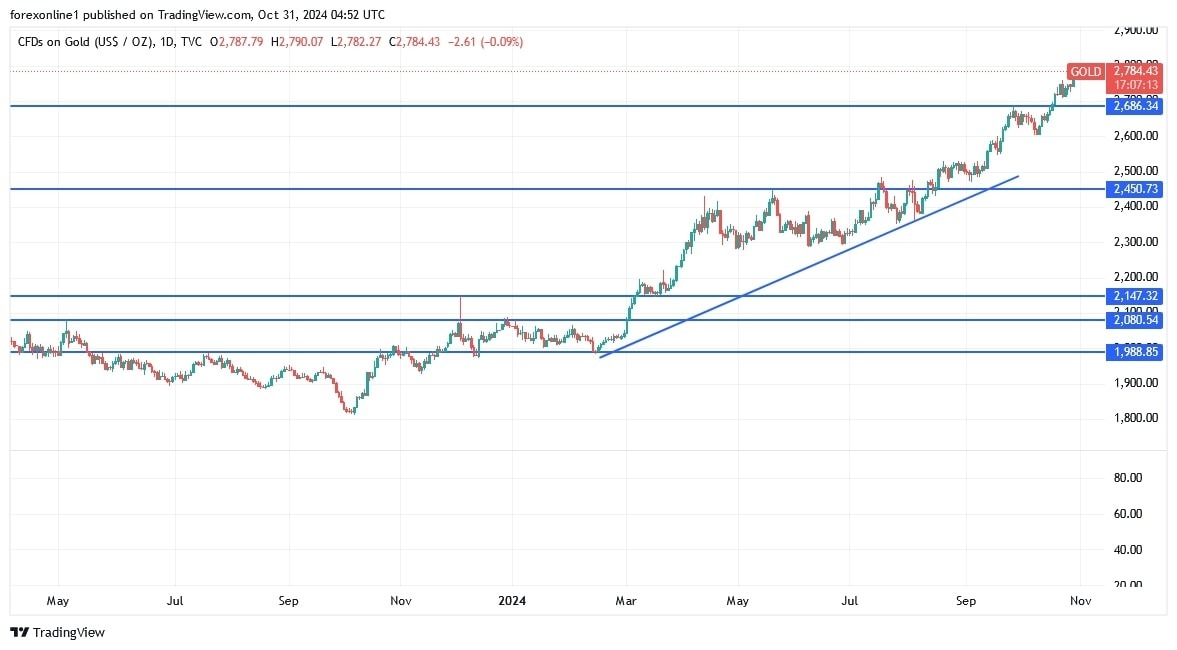
According to gold analysts today, the overall trend for the gold price will remain bullish and there is a strong chance of testing the historical psychological level of $2800 per ounce. There could be more to come if the factors driving gold gains persist, including increasing global geopolitical tensions and the abandonment of tightening by global central banks. Investors are not as concerned about technical indicators moving towards oversold levels as they are about monitoring the continued factors driving gold gains. Ultimately, no significant profit-taking will occur without a resolution to global tensions.
Ready to trade today’s Gold forecast? Here are the best Gold brokers to choose from.
Silver prices (XAG/USD) extends its losses for the second consecutive day, trading around $33.60 during the Asian hours on Thursday. However, the downside of the Silver price could be restrained amid increased demand for safe-haven assets amid uncertainties surrounding the US elections and geopolitical risks.
Former President Donald Trump has made gains among Hispanic men as the November 5 US presidential election approaches, where he will face Democratic candidate Kamala Harris. According to an analysis of Reuters/Ipsos polling, Trump is now trailing Harris by only 2%, with support at 44% compared to her 46%.
Meanwhile, Harris has seen increased support among white women. In late 2020, white women favored Trump over Biden by 12%, but now they lean Republican by a margin of 3%. The race between the two candidates is extremely close, with Harris holding a slight lead of 46% to 43% in the latest poll conducted from October 16 to 21.
Silver prices are likely to rise due to safe-haven demand as traders keep a close eye on escalating geopolitical tensions in the Middle East. This comes in the wake of Israel’s military chief warning of a “very hard” strike on Iran if missile attacks continue. Lebanese Prime Minister Najib Mikati mentioned on Wednesday that US envoy Amos Hochstein indicated a possible ceasefire in the Israel-Hezbollah conflict could be achieved before the U.S. elections on November 5.
Additionally, investors are looking forward to China’s parliamentary meeting scheduled for November 4-8, where announcements regarding potential stimulus measures from Beijing are anticipated. Reports indicate that China is considering a stimulus package exceeding 10 trillion Yuan to boost its economy.
Silver is a precious metal highly traded among investors. It has been historically used as a store of value and a medium of exchange. Although less popular than Gold, traders may turn to Silver to diversify their investment portfolio, for its intrinsic value or as a potential hedge during high-inflation periods. Investors can buy physical Silver, in coins or in bars, or trade it through vehicles such as Exchange Traded Funds, which track its price on international markets.
Silver prices can move due to a wide range of factors. Geopolitical instability or fears of a deep recession can make Silver price escalate due to its safe-haven status, although to a lesser extent than Gold’s. As a yieldless asset, Silver tends to rise with lower interest rates. Its moves also depend on how the US Dollar (USD) behaves as the asset is priced in dollars (XAG/USD). A strong Dollar tends to keep the price of Silver at bay, whereas a weaker Dollar is likely to propel prices up. Other factors such as investment demand, mining supply – Silver is much more abundant than Gold – and recycling rates can also affect prices.
Silver is widely used in industry, particularly in sectors such as electronics or solar energy, as it has one of the highest electric conductivity of all metals – more than Copper and Gold. A surge in demand can increase prices, while a decline tends to lower them. Dynamics in the US, Chinese and Indian economies can also contribute to price swings: for the US and particularly China, their big industrial sectors use Silver in various processes; in India, consumers’ demand for the precious metal for jewellery also plays a key role in setting prices.
Silver prices tend to follow Gold’s moves. When Gold prices rise, Silver typically follows suit, as their status as safe-haven assets is similar. The Gold/Silver ratio, which shows the number of ounces of Silver needed to equal the value of one ounce of Gold, may help to determine the relative valuation between both metals. Some investors may consider a high ratio as an indicator that Silver is undervalued, or Gold is overvalued. On the contrary, a low ratio might suggest that Gold is undervalued relative to Silver.
Gold traded as high as $2,789.72 a troy ounce on Wednesday, a fresh record high. XAU/USD retreated after Wall Street’s opening but met buyers at around $2,770 and approaches the aforementioned high en route to unexplored territory.
The US Dollar (USD) reacted positively to the first batch of United States (US) data, surging after an upbeat ADP report on private job creation showed the sector added 233K new positions in October, much better than the 115K expected. The Greenback retained its strength following the release of the Q3 Gross Domestic Product (GDP) preliminary estimate, showing that the economy grew at an annualized pace of 2.8%, below the 3% expected and the previous, yet still far from concerning.
Finally, the US reported an uptick in inflation in the three months to June, as the core Personal Consumption Expenditures (PCE) Price Index rose by 2.2%, easing from the previous 2.8% but above the 2.1% expected.
Employment, growth, and inflation all fell within a tolerable range, resulting in little relevance to the upcoming Federal Reserve’s (Fed) monetary policy decision next week. In the end, market players welcomed the figures. As a result, the USD came under selling pressure while Wall Street trimmed pre-opening losses, and the three major indexes turned positive.
Meanwhile, uncertainty surrounding the outcome of the US presidential election keeps boosting demand for Gold and buyers take their chances on intraday deeps. Demand for Gold will likely continue outpacing that of the USD in risk-averse scenarios, while also gaining when the latter weakens.
The US will release the September PCE Price Index on Thursday, although it may have a limited impact given the quarterly figures just released within the GDP report. On Friday, the country will publish the October Nonfarm Payrolls (NFP) report.
Technically, the daily chart for the XAU/USD pair is bullish despite being overbought. The pair keeps trading above all its moving averages, with the 20 Simple Moving Average (SMA) currently at around $2,691.70. The 100 and 200 SMAs accelerated higher far below the shorter one, reflecting persistent buying interest. Finally, technical indicators entered overbought readings, partially losing their upward strength but far from showing upward exhaustion. Higher highs are still on the docket before a relevant downward correction occurs.
The 4-hour chart indicates a persistently strong upward momentum. Technical indicators resumed their advances in the overbought territory after a modest corrective decline, confirming buyers continue to take their chances on dips. At the same time, the 20 SMA accelerated north far below the current level while above the 100 and 200 SMAs. A bullish continuation beyond $2,800 is on the docket before the US election.
Support levels: 2,770.90 2,757.30 2,742.50
Resistance levels: 2,790.00 2,810.00 2,825.00
A decisive advance above the top line that is followed by a continuation higher indicates an initial breakout of the triangle consolidation pattern. However, subsequent price behavior is key to guard against a false breakout. Since the most recent swing high was at 3.02, it should also be considered since it is relatively nearby.
A rally above that high would further confirm strength as a prior swing will have been reclaimed. However, a daily close above it is needed to complete that breakout. That swing is part of the price structure of lower swing highs that occurred since the 3.64 peak in 2003. The top boundary line defining resistance of the symmetrical triangle formation touches those highs.
Since resistance has been seen so far, a bearish retracement may be next on the agenda. Weakness is indicated on drop below today’s low of 2.77. Also, a decline below yesterday’s low of 2.79 can be seen as a gauge. The 38.2% Fibonacci retracement is at 2.65 and it may be the first price zone to see signs of support. Lower down is possibly a more significant support zone from 2.58 to 2.56 as it marks the confluence of several levels. A prior high resistance and now possibly support was at 2.58 and it is joined by the 50% retracement at 2.57 and the 20-Day MA at 2.56.
Price behavior around the 20-Day line will likely provide the most value as it helps identify support of the near-term trend. It has been trending down since a little before the last swing low. However, the 50-Day MA has been trending up since mid-September and is now at 2.44. If natural gas breaks below the 20-Day MA and continues lower the 50-Day line becomes a potential target. Moreover, the 61.8% Fibonacci retracement can be watched as well at 2.48.
For a look at all of today’s economic events, check out our economic calendar.
Silver (XAG/USD) meets with a fresh supply on Wednesday and drops back closer to the $34.00 mark during the first half of the European session, reversing a part of the previous day’s move up.
From a technical perspective, the XAG/USD is holding comfortably above important daily moving averages – 50-day, 100-day and 200-day SMAs. Moreover, oscillators on the daily chart maintain their positive bias and are still away from being in the overbought territory, suggesting that the path of least resistance for the white metal remains to the upside.
Hence, any subsequent slide is more likely to find decent support near the $33.70 horizontal zone. This is followed by last week’s swing low, around the $33.10 area, which if broken decisively might shift the bias in favor of bearish traders. The XAG/USD might then accelerate the slide towards the $32.20-$32.15 intermediate support en route to the $32.00 round figure.
Some follow-through selling below the $31.70-$31.65 region could drag the XAG/USD towards the $31.00 mark. The downward trajectory could extend further towards the $30.50 area and the monthly swing low, close to the $30.00 psychological mark tested on October 8.
On the flip side, bulls might now wait for a sustained strength beyond the $34.50-$34.55 area before making a fresh attempt to conquer the $35.00 psychological mark. The subsequent move up has the potential to lift the XAG/USD further towards the October 2012 swing high, around the $35.35-$35.40 region.
Silver is a precious metal highly traded among investors. It has been historically used as a store of value and a medium of exchange. Although less popular than Gold, traders may turn to Silver to diversify their investment portfolio, for its intrinsic value or as a potential hedge during high-inflation periods. Investors can buy physical Silver, in coins or in bars, or trade it through vehicles such as Exchange Traded Funds, which track its price on international markets.
Silver prices can move due to a wide range of factors. Geopolitical instability or fears of a deep recession can make Silver price escalate due to its safe-haven status, although to a lesser extent than Gold’s. As a yieldless asset, Silver tends to rise with lower interest rates. Its moves also depend on how the US Dollar (USD) behaves as the asset is priced in dollars (XAG/USD). A strong Dollar tends to keep the price of Silver at bay, whereas a weaker Dollar is likely to propel prices up. Other factors such as investment demand, mining supply – Silver is much more abundant than Gold – and recycling rates can also affect prices.
Silver is widely used in industry, particularly in sectors such as electronics or solar energy, as it has one of the highest electric conductivity of all metals – more than Copper and Gold. A surge in demand can increase prices, while a decline tends to lower them. Dynamics in the US, Chinese and Indian economies can also contribute to price swings: for the US and particularly China, their big industrial sectors use Silver in various processes; in India, consumers’ demand for the precious metal for jewellery also plays a key role in setting prices.
Silver prices tend to follow Gold’s moves. When Gold prices rise, Silver typically follows suit, as their status as safe-haven assets is similar. The Gold/Silver ratio, which shows the number of ounces of Silver needed to equal the value of one ounce of Gold, may help to determine the relative valuation between both metals. Some investors may consider a high ratio as an indicator that Silver is undervalued, or Gold is overvalued. On the contrary, a low ratio might suggest that Gold is undervalued relative to Silver.
At the beginning of this week’s trading, according to gold trading companies, gold prices came under pressure as the Israeli attack on Iran over the weekend had a limited impact as it did not target any oil or nuclear sites. However, safe-haven demand for the yellow metal remains intact ahead of next week’s US elections. Uncertainty over the outcome, which will determine US policy for the next four years, has kept traders on their toes.
The uncertainty surrounding next week’s elections could shape gold prices. Most opinion polls show former US President Donald Trump ahead of Vice President Kamala Harris. However, analysts believe the race will be close. Overall, the continued safe-haven demand stemming from tensions in the Middle East and US election tensions continues to act as a tailwind for the precious metal. Should Trump win, concerns over a trade war with China would increase safe-haven demand for gold. Moreover, Trump could also ease sanctions on Russia, while doubling them in Iran.
Traders are also focusing on the release of third-quarter GDP data from the US on Thursday. Additionally, the Personal Consumption Expenditures (PCE) index, the preferred measure of the US Federal Reserve, will be released on Friday, along with non-farm payrolls data. All of these data are due ahead of the US Federal Reserve’s policy meeting next week. If the data shows further economic slowdown, it could herald further interest rate cuts in the US.
Meanwhile, lower interest rates increase demand for non-yielding metals such as gold and silver.
According to the CME FedWatch tool, traders are pricing in a 95% chance of the US Federal Reserve cutting interest rates by 25 basis points at its November meeting. At its September meeting, the Fed cut rates by 50 basis points, surprising the market.
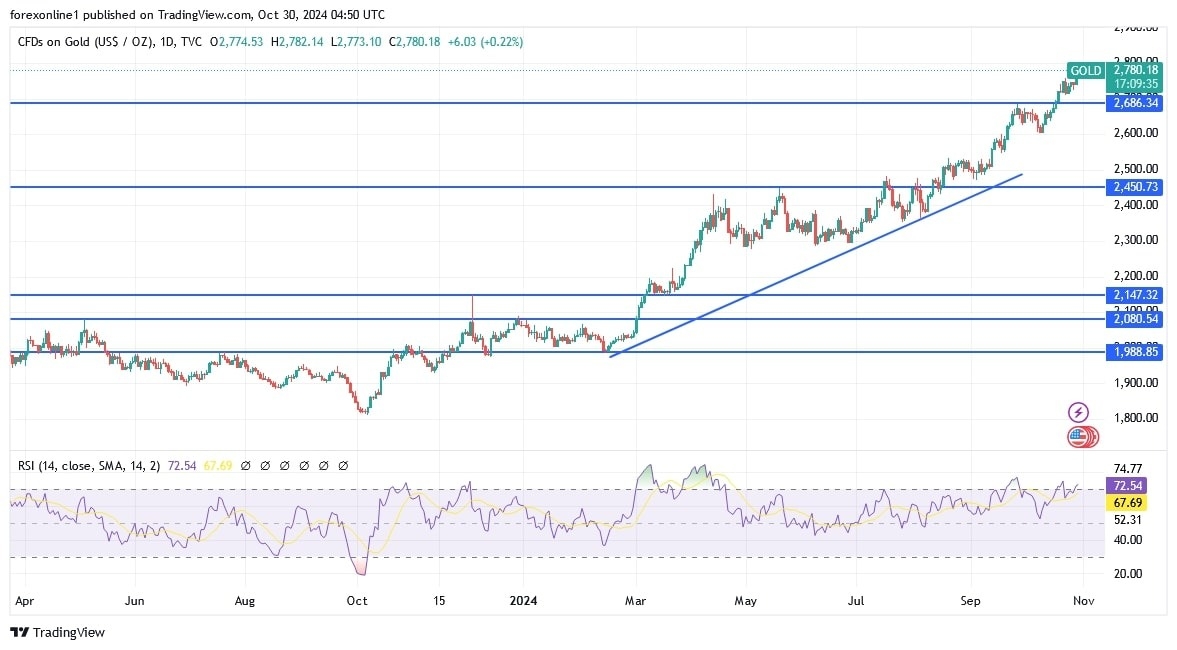
According to gold price forecast experts, gold prices are facing resistance at $2,770-2,775 per ounce. If prices break above $2,775 per ounce, the yellow metal could rally to $2,800 per ounce after that. Overall, COMEX gold prices have gained more than 30% since the beginning of this year. However, the Relative Strength Index (RSI) on the daily chart is about to break into the overbought zone and warrants some caution from bulls. Therefore, it would be wise to wait for some near-term neutrality or a modest pullback before placing any further discretionary move in the near term.
Ready to trade today’s Gold forecast? Here are the best Gold brokers to choose from.
Silver prices (XAG/USD) dips slightly to around $34.30 during the Asian trading hours on Wednesday. However, Silver gained over 2% on Tuesday amid ongoing uncertainty surrounding the US presidential election.
A three-day poll conducted by Reuters/Ipsos, which concluded on Sunday and was released on Tuesday, indicated that the race is essentially tied as the November 5 election approaches. Vice President Kamala Harris, the Democratic candidate, has seen her lead over Republican nominee Donald Trump narrow to just one percentage point, with 44% support compared to Trump’s 43%.
Silver prices might have encountered difficulties due to safe-haven flows, following an Axios reporter post on X that Israeli Prime Minister Benjamin Netanyahu is set to meet with various ministers and military and intelligence leaders to discuss a diplomatic resolution to the war in Lebanon, according to Reuters.
The dollar-denominated commodity, like Silver, typically benefits from a weaker US dollar and lower Treasury yields as traders exercise caution ahead of significant US economic data releases this week. A declining US dollar makes Silver more affordable for foreign buyers, which can boost demand for the precious metal.
The preliminary US Q3 Gross Domestic Product (GDP) figures and October’s ADP Employment Change are set to be released on Wednesday. Additionally, US PCE inflation and Nonfarm Payrolls will be closely monitored on Thursday and Friday, respectively.
Investors are also anticipating the upcoming meeting of China’s parliament, scheduled for November 4-8, as reported by state media on Friday. There is considerable interest in the gathering of the standing committee of the National People’s Congress, which is expected to provide updates on potential fiscal stimulus measures.
Silver is a precious metal highly traded among investors. It has been historically used as a store of value and a medium of exchange. Although less popular than Gold, traders may turn to Silver to diversify their investment portfolio, for its intrinsic value or as a potential hedge during high-inflation periods. Investors can buy physical Silver, in coins or in bars, or trade it through vehicles such as Exchange Traded Funds, which track its price on international markets.
Silver prices can move due to a wide range of factors. Geopolitical instability or fears of a deep recession can make Silver price escalate due to its safe-haven status, although to a lesser extent than Gold’s. As a yieldless asset, Silver tends to rise with lower interest rates. Its moves also depend on how the US Dollar (USD) behaves as the asset is priced in dollars (XAG/USD). A strong Dollar tends to keep the price of Silver at bay, whereas a weaker Dollar is likely to propel prices up. Other factors such as investment demand, mining supply – Silver is much more abundant than Gold – and recycling rates can also affect prices.
Silver is widely used in industry, particularly in sectors such as electronics or solar energy, as it has one of the highest electric conductivity of all metals – more than Copper and Gold. A surge in demand can increase prices, while a decline tends to lower them. Dynamics in the US, Chinese and Indian economies can also contribute to price swings: for the US and particularly China, their big industrial sectors use Silver in various processes; in India, consumers’ demand for the precious metal for jewellery also plays a key role in setting prices.
Silver prices tend to follow Gold’s moves. When Gold prices rise, Silver typically follows suit, as their status as safe-haven assets is similar. The Gold/Silver ratio, which shows the number of ounces of Silver needed to equal the value of one ounce of Gold, may help to determine the relative valuation between both metals. Some investors may consider a high ratio as an indicator that Silver is undervalued, or Gold is overvalued. On the contrary, a low ratio might suggest that Gold is undervalued relative to Silver.